Chapter 2: Private sector development in fragile states
PSD in Africa
PSD in fragile states
Rationale for public sector support of the private sector
Existing multilateral efforts—the World Bank Group
Promoting business growth—policy goals in fragile states
Private sector development policy design in fragile states
Note
Chapter 3: Constraints to business growth in African fragile states
World Bank Doing Business Reports
World Bank Enterprise Surveys
World Bank Group alignment with business constraints
Conclusion
Notes
Chapter 4: Government priorities in fragile states
Methodology
Country government priorities
Economic sector priorities
World Bank Group alignment with government priorities
Conclusion
Notes
Chapter 5: What works—proven PSD successes in fragile environments
IDA alignment with what works
IFC alignment with what works
Notes
Chapter 6: Country case study—South Sudan
Contextual overview
Private sector overview
Major business constraints
Government priorities
Existing donor programs
Conclusion
Notes
Chapter 7: Conclusion
Moving forward
Note
Appendixes
Appendix 1: IFC investments in African fragile state sample, 2000–11
Appendix 2: MIGA guarantees in African fragile state sample, 2011
Appendix 3: Traditional aid modality limitations in fragile states
Appendix 4: Private sector–related donor projects, South Sudan, as of end-2010
Appendix 5: Country case study—Zimbabwe
Appendix 6: Country case study—Somaliland
Appendix 7: Fragile states and World Bank CPIA scores, 2005–09
Appendix 8: Other private sector development initiatives in fragile states
Appendix 9: Methodology for reclassifying IDA PSD-related projects
Appendix 10: Top PSD-related constraints and economic sectors, African fragile states
Appendix 11: IDA IEG project outcome ratings and distributions, 1980–2006
Appendix 12: Correlation analysis of IDA IEG project rating components
Figures
1: Policy design framework for fragile states
1.1: Per capita World Bank Group disbursements by income category, 2010
2.1: Policy design framework for fragile states
3.1 Most frequently cited business constraints in African countries
3.2: IDA alignment, fragile state commitments
3.3 IFC alignment with business constraints, selected measures, 2000–11
4.1: World Bank Group alignment with countries’ PSD priorities
5.1: PSD-related project rating distribution in fragile states, 1980–2006
5.2: Historical IDA prioritization and outcome ratings, by PSD subsector
5.3: Current PSD subsector prioritization and outcome ratings, African fragile states
5.4: DOTS development outcome ratings by sector, weighted and unweighted
5.5: IFC investment return versus portfolio share, 2009–10
6.1: Donor alignment with major business constraints
6.2: Donor alignment with what works
A5.1: GDP and sector growth, 2005–10
A5.2: Change in Doing Business scores, 2006–11
A5.3: “Protecting investors” score, Zimbabwe and comparator economies
A5.4: Deposits and credit to private sector
A5.5: Deposits (left axis) and loan-to-deposits ratio (right axis), 2008–10
A11.1: Project outcome ratings by sector, fragile and nonfragile states, 1980–2006
Tables
1: Criteria to build roads in the Republic of Congo
1.1: African fragile states sample and selected indicators
3.1: Fragile states compared with other developing countries, Doing Business indicators
3.2: Most frequently cited business constraints in African fragile states (percent)
3.3: IDA alignment with “major constraints,” by country, selected measures
3.4: IFC alignment with constraints, 2000–11 (percent)
3.5: IFC investments in African fragile states by sector, 1980–2000
3.6: MIGA investments in African fragile states by sector, 1990–2011
4.1: Country PSD constraint priorities, by frequency
4.2: Country economic sector priorities, by frequency
4.3: IDA project alignment with government priority constraints
4.4: IFC investments and priority sector mapping
4.5: MIGA PSD project and priority sector mapping
5.1: IDA PSD-related project evaluation data, 1980–2006
5.2: IDA project outcome ratings by PSD-related sector, 1980–2006
5.3: IFC loan and equity portfolio income, 2009–10
6.1: Private enterprises in South Sudan, by number and distribution of employees
6.2: Commercial bank exposure, by sector (SDG millions)
6.3: Use of banking services among households, by state (percent)
6.4: Distribution of commercial banking services, by state (number of branches)
6.5: Price comparison of select intermediate inputs, Malakal and other cities
6.6: Time and cost to import a container, Juba and comparator cities
6.7: Donor funding for private sector–related projects, 2010
6.8: Donor alignment with government priorities
References
Supporting Private Business Growth in African Fragile States
A Guiding Framework for the World Bank Group in South Sudan and Other Nations
Benjamin Leo, Vijaya Ramachandran, and Ross Thuotte April 2012
About the authors
Benjamin Leo is a former Research Fellow at the Center for Global Development and the Global Policy Director at the ONE Campaign. Vijaya Ramachandran is a Senior Fellow at the Center for Global Development. Ross Thuotte is a Research Assistant at the Center for Global Development. The authors would like thank the Government of Denmark for generous financial support. We are also grateful to James Emery for his detailed reading of several drafts and his comments on our interpretation of the IFC data. In addition, Alan Gelb, Alvaro Gonzalez, Charles Kenny, Todd Moss, and Gaiv Tata provided extensive comments on various drafts of this report, and we would like to thank them for their efforts. John Osterman was of great help in guiding this manuscript through to publication, and Julie Walz provided excellent research assistance. The authors are solely responsible for any errors in fact or judgment.
The Center for Global Development is grateful for contributions from the Royal Danish
Embassy in support of this work.
Preface
Fragile and post-conflict states pose a daunting challenge to the World Bank Group. They suffer from a combination of harsh business environments, unstable and corrupt political regimes, and rent-seeking actors. These barriers prevent private businesses from generating much-needed services, economic growth, and jobs. Viewing the private sector as the key to economic and social progress in fragile states, the authors of this report assess the programs and projects supported by the three major arms of the World Bank active in those states (the International Development Association, the International Finance Corporation, and the Multilateral Investment Guarantee Agency) and propose a strategy to improve the overall effectiveness of the Bank’s work.
Though the World Bank Group and its shareholders have made fragile states a priority in recent years, their private sector–oriented programs in the past decade have not yielded many concrete development results. Bank Group staff has been asked to improve project outcomes and to help increase the absorptive capacity of fragile states while targeting priority sectors. But there has not been a clear World Bank Group-wide strategy for fragile states operations.
Using project documents and other sources of information, the authors have compiled a comprehensive dataset on the Bank Group’s work in 14 African states (Sudan, Central African Republic, Democratic Republic of Congo, Togo, Guinea Bissau, Guinea, Liberia, Angola, Côte d'Ivoire, Republic of Congo, Zimbabwe, Eritrea, Chad, and Burundi) which are classified as fragile by the World Bank Group. The dataset describes 5,000 IDA projects, 3,700 IFC projects and 700 MIGA projects over the period 1980–2011 that focus on building the private sector in these states. These data are available for the first time in an easily accessible format and will likely serve as a valuable resource for policymakers, donors and other interested actors. Analysis of the data shows that there often does not appear to be a clear strategy driving the interventions and that they are sometimes at odds with the stated needs of policymakers and the public.
Policymakers at the World Bank and those in its shareholder countries should heed the authors’ findings if they hope to help private sector businesses grow in Africa’s most challenging investment environments. The authors’ methodical and exhaustive assessment allows them to deliver a clear message. The World Bank should design and implement projects that a) alleviate the growth constraints most identified by businesses, b) target sectors that governments have explicitly made priorities, and c) align with proven, country-specific successes. Adherence to this framework could greatly increase the chances of successful future private sector–oriented interventions in fragile states.
Nancy Birdsall
President
Center for Global Development
Acronyms
AfDB
African Development Bank
CPIA
Country Policy and Institutional Assessment
DOTS
Development Outcome Tracking System
FCS
Fragile and conflict situation
FIAS
Financial Investment Advisory Service
FY
Fiscal year
ICT
Information and communication technology
IDA
International Development Association
IEG
World Bank Independent Evaluation Group
IFC
International Finance Corporation
IFI
International financial institution
IRAI
IDA Resource Allocation Index
IRR
Internal rate of return
MDC
Movement for Democratic Change
MIGA
Multilateral Investment Guarantee Agency
PPIAF
Public-Private Infrastructure Advisory Facility
PPP
Public-private partnership
PSD
Private sector development
SME
Small and medium enterprise
USAID
U.S. Agency for International Development
WFP
World Food Programme
ZANU-PF
Zimbabwe African National Union–Patriotic Front
This document is fully functional in Chrome, Safari, Firefox, and Internet Explorer 9
Supporting Private Business Growth in African Fragile States
A Guiding Framework for the World Bank Group in South Sudan and Other Nations
Benjamin Leo, Vijaya Ramachandran, and Ross Thuotte April 2012
The World Bank Group faces significant operational changes over the near to medium term. More than half of poor countries are projected to graduate
from the World Bank’s International Development Association (IDA) concessional assistance over the next 15 years.[1] As a result, IDA’s country client
base is projected to become dominated by African fragile states. To its credit, the World Bank Group recognizes these coming changes and the unique
needs and constraints present in fragile environments. It has publicly expressed a plan to develop an organization-wide strategy tailored specifically
for fragile and conflict-affected situations.
At the same time, private businesses often are able to operate in the absence of stable, well-established governments and therefore can present donor
organizations with an attractive pro-growth opportunity in fragile states. After all, the overwhelming majority of African jobs come from the private
sector, and private businesses are responsible for some of the most dramatic improvements in the African economic landscape over the past decade.
Perhaps most impressively, the mobile telecommunications sector, comprised almost entirely of private firms, generated more than 300 million mobile
phone subscribers between 2000 and 2008. Recognizing these issues, the World Bank Group must make business growth a central objective of its future
strategy for fragile and conflict-affected states. The most recent World Development Report and its subsequent implementation report partially
reflect this sentiment. They argue that the organization must “position fragility, conflict, and violence at the core of its development mandate” and
that the Bank must “significantly adjust its operations model” to reflect this priority shift.[2] Currently, the World Bank Group is
devising a new strategy that will set the tone for Group-wide strategic changes.
Scope and key findings
First, we examine three key private sector–related factors in African fragile states: what businesses cite as the most binding constraints to private
sector growth; what government priorities are for business climate improvements or strategic economic sectors; and what types of projects have been
more effective over time. This analysis draws upon World Bank Enterprise Survey data, a newly assembled database of African fragile state government
priorities, and World Bank Independent Evaluation Group project outcome rating data. Our summary findings include:
Business constraints.
On average, the most frequently cited business constraints in African fragile states include electricity (68 percent of survey respondents), access
to finance (56 percent), political instability (56 percent), corruption (48 percent), and tax rates (40 percent).
Government priorities.
African fragile state governments have prioritized the following issues: regulatory framework reforms (100 percent of sample countries), transport
infrastructure (100 percent), electricity (92 percent), access to and cost of finance (83 percent), and macroeconomic stability (75 percent). Our
analysis seeks to identify government priorities in a defined set of African fragile states. A separate comparison between fragile and nonfragile
low-income country priorities could be useful to World Bank project design staff.
Project outcome performance.
The private sector–related subsectors with the highest project outcome ratings include: telecommunications, oil and gas, transport infrastructure,
and trade policy reform. At least half of IDA projects had at least “satisfactory” outcome ratings in these subsectors. The worst-performing
subsectors include: port infrastructure; banking; micro, small, and medium enterprise finance; rail infrastructure; and mining.
Subsequently, we assess the alignment of World Bank Group operations within these three areas over the last decade. For this analysis, we have
assembled a new database covering all World Bank Group operations in fragile states since 1980, which includes current and past fragile states (both
African and non-African). Overall, we find that project alignment varies widely across the World Bank Group’s three largest subsidiaries—IDA, the
International Finance Corporation (IFC), and the Multilateral Investment Guarantee Agency (MIGA). Despite several bright spots, our analysis suggests
that strategic changes in the World Bank Group’s operations are needed—particularly for IFC and MIGA. Our summary findings include:
IFC and MIGA alignment performance
. IFC and MIGA projects are only modestly aligned with the private sector’s most binding constraints or government priorities. Instead, projects
have been heavily concentrated in low-risk sectors, such as the extractive sector (between 1980 and 2000). In recent years, this concentration has
shifted toward the financial sector (on a project count basis) and the telecommunications sector (on a project value basis). Taken
together, IFC activities over time suggest that the organization chooses its investments on a project-by-project basis, rather than implementing a
comprehensive, systematic strategy in African fragile states.
IDA alignment performance
. IDA exhibits very strong alignment with government priorities and reasonably good prioritization in sectors with higher project outcome ratings.
But it has a more mixed performance with respect to focusing on what businesses cite as the most binding private sector–related constraints. By
illustration, it has focused a disproportionate share of private sector–related projects on transport infrastructure, which businesses cite less
frequently as a “major constraint.” On the other hand, IDA has pursued fewer projects focusing on the most binding constraints, such as electricity
and access to finance.[3]
Recommendations
Based on this analysis, we propose a new guiding framework for the World Bank Group and other donor institutions for prioritizing private
sector–related projects in fragile states. We recommend that private sector promotion policies prioritize three key issues: addressing the most severe
constraints to private sector growth; matching the host government’s stated priorities; and targeting sectors and subsectors with proven track records,
relative to other sectors (figure 1). Moreover, donor policies and projects should also contribute to broader development goals, including job
creation, economic growth, broadening and strengthening of the tax base, and positive spillover effects into other economic sectors.
Ideally, donor institutions would pursue projects in sectors or areas where all three components intersect (what the private sector needs, what the
government wants, and what donors do effectively). For example, a project to build roads in the Republic of Congo would meet all three criteria (table
1).
Table 1: Criteria to build roads in the Republic of Congo
Component
Rationale
Constraints
According to a 2010 World Bank Business Enterprise survey, 57 percent of Congolese businesses cite transport as a “major constraint” togrowth
Government priorities
Transport infrastructure is cited as a major constraint to business by the Republic of Congo’s most recent Poverty Reduction StrategyPaper
Track record
Between 1980 and 2006, road projects in fragile and conflict-affected countries received an average rating of 2.4 of 5—a relativelyhigh score for projects in these countries
Development goals
Building roads would create near-term jobs for workers while providing a public good for other sectors over the medium to long term.Eventually, the tax base could be strengthened if tax-paying businesses benefited from the road network improvements
To be most effective, this framework could be applied to all segments of the World Bank Group project cycle—including policy design, ongoing
operations, and exit evaluations. Operational implementation of the proposed approach clearly should be customized across subsidiaries and individual
countries. But without a concerted and consistent strategy both within and across subsidiaries, World Bank Group projects will continue to perform at a
suboptimal level in fragile and conflict-affected states.[4]
To help implement this framework, the World Bank Group should consider ways of addressing three central issues: improving managerial capacity to enable
a bolder approach to fragile states; revising human resource strategies to attract and retain staff who are willing to take risks and understand the
operating conditions in fragile states; and improving staff incentives to reward greater risk-taking and innovation. Each of these areas is enormously
challenging, but must be tackled in order to successfully implement an ambitious fragile states agenda.
[2]
World Bank Group Development Committee (2011).
[3]
World Bank Group project decisions are complex and consider a broad array of issues. Promoting private sector business growth is just one of
the many priorities of the World Bank Group; this may be reflected in its project portfolio.
[4]
Fragile states are often affected by violence and conflict and generally suffer from poor governance. Furthermore, large elements of the
private sector in these countries may be criminalized, dominated by rent-seeking actors, or entirely informal and unregulated. As such,
expectations for project effectiveness in these countries should be lower relative to non-fragile countries. However, adherence to the proposed
framework would address some of the pitfalls involved in fragile state private sector growth promotion efforts and might improve their
effectiveness.
Overview
In recent years, international financial institutions (IFIs) have dramatically increased their worldwide investments in the private sector—from $10
billion in 1998 to more than $35 billion in 2008.[1] In Sub-Saharan Africa, donor
financing for private sector–related activities through loans, guarantees, and advisory services has also increased at a fast pace. By contrast,
African fragile states overall have experienced little growth in donor projects targeting private sector activities and continue to receive
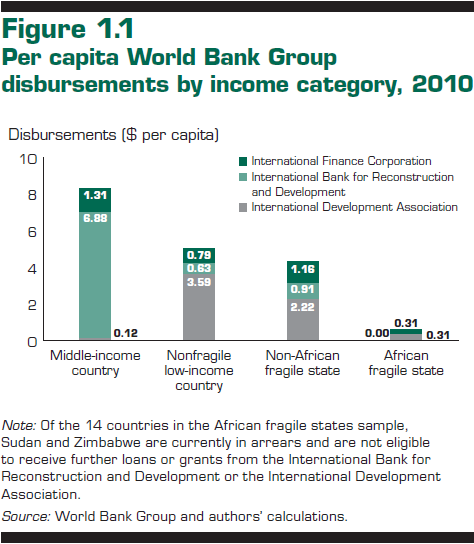
infinitesimal (albeit slowly increasing) portions of World Bank Group disbursements in recent years (figure 1.1) on a per capita basis.[2] The time period for the data in
figure 1.1 is 2010, which the World Bank Group considers to be a “postcrisis” period. Some disbursements in this year are countercyclical measures to
mitigate the negative impact of the financial crisis. Therefore, we cannot assume that this is entirely indicative of World Bank Group disbursements in
a typical year. However, countercyclical lending policies are mostly likely not the sole cause of the large discrepancy between disbursements to
middle-income countries, low-income countries, and African fragile states.
There are a number of factors driving these low investment levels, such as small market size, high political risk, poor infrastructure, and weak legal
and regulatory frameworks. Moreover, International Development Association (IDA) projects are roughly twice as likely to fail as those in nonfragile
states.[3],[4] Institutional factors within
IFIs themselves also have contributed to underinvestment over time. For example, the International Finance Corporation’s (IFC) risk-averse culture and
mandate to earn a profit are just two factors that have led to very few investment deals in African fragile states outside of enclave sectors.[5] The current World Bank Group
project portfolio reflects the realities of investing in fragile states. It also reveals some of the challenges that the World Bank Group and other
IFIs might consider when scaling up their activities in fragile states over the near to medium term.
Definition of fragile states
For the purposes of our analysis, we define African fragile states according to countries’ respective IDA Resource Allocation Index (IRAI) score
between 2005 and 2009.[6]
Specifically, countries are defined as fragile if they fall into one of two categories:[7],[8]
All core.
Country has remained below a score of 3.0 for all years.[9]
All marginal.
Country has remained below a score of 3.2 for all years.
Based on this approach, the countries of interest (in order of 2009 IRAI scores from lowest to highest) include: Zimbabwe, Eritrea, Sudan, Chad,
Guinea-Bissau, the Central African Republic, the Democratic Republic of Congo, Togo, the Republic of Congo, Liberia, Angola, Côte d’Ivoire, Guinea, and
Burundi. These 14 countries provide a variety of case studies spanning geographic regions, income groups, and natural resource endowments (table 1.1).
Our diverse group of African fragile states also allows us to formulate a policy framework that may be relevant to a wider range of fragile
environments.
Table 1.1: African fragile states sample and selected indicators
Country
Population (millions)
GDP
(USD millions)
GDP per Capita
CPIA (2010)
Conflict-Affected
In Arrears
Oil Exporter
Angola
19.0
25,901
1,364
2.8
✓
✓
Burundi
8.5
966
113
3.1
✓
Central African Republic
4.5
1,054
234
2.8
✓
Chad
11.5
3,097
269
2.4
✓
✓
Congo, Dem. Rep.
67.8
6,851
101
2.7
✓
✓
Congo, Rep.
3.8
5,067
1,348
2.9
✓
✓
Côte
d'Ivoire
21.6
11,666
541
2.7
✓
✓
Eritrea
5.2
692
133
2.2
✓
Guinea
10.3
4,108
398
2.8
Guinea-Bissau
1.6
244
148
2.7
Liberia
4.1
619
151
2.9
✓
Sudan
43.6
22,819
524
2.4
✓
✓
✓
Togo
6.8
1,719
254
2.9
Zimbabwe
12.6
4,082
323
2.0
✓
Total
221.0
88,887
421
2.7
-
-
-
In its latest World Development Report, the World Bank stresses the importance of integrating security and development activities in
conflict-affected and fragile state environments.[10] In operational terms, the
report suggests that the World Bank Group plan to make country strategies more fragility-focused; prioritize private sector development (PSD) and job
creation; realign results and risk-based frameworks; and reduce volatility in financing levels. The World Bank’s concessional financing entity—the
IDA—has already been pursuing a number of evolving strategies customized for fragile state environments. While modest progress has been achieved,
significant work remains. In contrast with IDA, the World Bank Group’s other subsidiaries—IFC and the Multilateral Investment Guarantee
Agency—currently do not have operational strategies for fragile states. So the World Bank Group faces a number of challenges in translating the new World Development Report directives into effective programs on the ground.
Against this backdrop, we consider a range of issues and options that may help the World Bank Group and other donor organizations streamline operations
and improve their effectiveness in African fragile states. First, we examine whether the World Bank Group implemented its projects in African fragile
states over the last decade in order to address the most significant obstacles to business growth; country government priorities; and areas where the
World Bank Group has a proven track record. In this manner, we gauge how well the World Bank Group is focusing on what is needed, what is wanted, and
what works. Second, we apply this approach to assess donors’ PSD support in the newly independent nation of South Sudan.[11] Taken together, our findings
suggest a somewhat mixed picture about the World Bank Group’s alignment and effectiveness in promoting PSD in African fragile states. Finally, drawing
upon this analysis, we propose a number of strategic and operational policy recommendations for the World Bank Group to consider as it seeks to
prioritize and improve its PSD programs in African fragile states.
[2]
In this report, we use several metrics to demonstrate the relative size of World Bank Group commitments to fragile states. First, to reduce the
bias of countries with larger populations receiving more commitments, we use per capita figures. Second, to gain the perspective of fragile
state commitments versus commitments in other countries, we use commitment values in fragile states as a percentage of total commitment values
in all countries. Third, for countries in which high-value projects are simply not feasible, we use project count metrics in relation to total
Group projects in all countries.
[4]
While IDA’s supply-driven resource allocation model ensures that fragile states receive substantial assistance volumes, poor project
performance levels have a significant influence on the sectors targeted by IDA funding. IDA’s performance-based allocation (PBA) system does
include a project portfolio quality component, which has a modest impact on each respective recipient country’s resource allocation.
[5]
Of the numerous private sector–related programs and funding sources listed later in this paper, investments in fragile states constitute a
small portion of overall investments. For a complete breakdown of multilateral development banks’ investments, see Perry (2011).
[6]
IRAI scores are based on the World Bank’s annual Country Policy and Institutional Assessment (CPIA) exercise. They are calculated as the
average of country ratings across four distinct categories: economic management; structural policies; policies for social inclusion/equity; and
public sector management and institutions. The CPIA/IRAI is the principal determinant of a given country’s IDA allocation. For additional
details, see www.worldbank.org/ida.
[7]
Appendix 7includes a full list of existing African “fragile states,” their IRAI scores, and categorizations. To maintain close
relevance with our target countries, we have omitted island nations and non-African countries.
[8]
This report’s definition of fragile states tracks largely with that of the World Bank, which defines “core” and “marginal” states as those
countries with IRAI scores of below 3.0 and 3.2, respectively. Our only departure from the Bank’s definition is that we extend the period to
2005–09.
[9]
This categorization also includes countries that are missing data for one or more years, but that lie below 3.0 when scored.
[11]
Appendixes 5 and 6 provide further analysis on the case studies of Zimbabwe and Somaliland.
Private sector development in fragile states
PSD in Africa
In recent years, the majority of investment in the African private sector has flowed toward the rapidly expanding telecommunications and extractive
industry sectors. Between 2005 and 2008, private investors contributed 62 percent of total funding to the telecommunications industry, which has
resulted in the rapid expansion of networks and profitability, as well as prospects for continued growth.[1] By illustration, African
telecommunications firms generated more than 316 million mobile phone subscribers between 2000 and 2010.[2] The rapid 43 percent annual
growth rate leaves plenty of room for upward movement in the sector, as mobile penetration only reached 44 percent in 2009.[3] Unlike other sectors,
telecommunications growth has spanned the gamut of Sub-Saharan countries, ranging from middle-income economies to fragile states.[4] The natural resources and
extractive industries have also accounted for a significant portion of African growth, contributing roughly a quarter of Africa’s growth between 2002
and 2007.[5]
While progress in the telecommunications and extractive industry sectors is promising, current signals indicate that private investors’ appetite for
other sectors continues to grow and that private sector expansion could provide a valuable boost to capital- and capacity-starved fragile states.
Private sector investment projects in infrastructure could provide high investment returns (as in telecommunications) for both investors and customers
in fragile states. For example, “bankable” investments in electricity generation capability and infrastructure (for which there is significant consumer
demand) could greatly decrease costs for businesses while generating revenue for power providers.[6]
PSD in fragile states
Theoretically, the private sector has many opportunities to thrive in environments in which traditional aid cannot succeed. For instance, the private
sector can exist (and even thrive) even when there is no central government that is stable enough to accept foreign aid (for example, Somaliland). This
could make the private sector a particularly viable and valuable target for economic development interventions in fragile states. Therefore, promoting
private sector growth in fragile states could be one tangible first step toward better governance and more diverse, robust economies. However, despite
a sound rationale for public sector intervention in the private sector, private sector development (PSD)–focused activities in fragile state
environments remain vulnerable to a range of binding or limiting constraints.
Fragile states generally are categorized by very weak business climates that often restrict individual firm activities through several channels. In
particular, the indirect costs of poor infrastructure, regulatory challenges (such as excessive licensing fees, bribes, and so forth), and low labor
productivity can reduce profit margins and reduce incentives for business owners and prospective entrepreneurs.[7] These effects can be
exacerbated in fragile states, in which governments and institutions routinely fail to administer services, enforce contracts, and reduce corruption.
Political risk also is a major concern for multilateral institutions that wish to invest in the African private sector. This illustrates African
fragile states’ acute need for customized financing instruments, such as political risk guarantees.
Fragile states also lack the human capital needed to operate scalable business ventures. While skilled micro-entrepreneurs may exist en masse in
countries like Chad and Burundi, many of the most skilled businesspeople (such as those with formal skills in accounting, personnel management,
strategic planning, risk analysis, marketing, and the like) have often left these hostile business environments for more lucrative and/or secure
opportunities abroad. Although these highly skilled workers often send home substantial remittances, they frequently do not maintain local businesses
in the fragile-state environment from where they came.[8]
Many firms in fragile states are also heavily constrained by what Ramachandran, Gelb, and Shah (2009) refer to as “external costs.”[9] These external or indirect
costs—such as those stemming from failures in electricity service provision, transport infrastructure, and supplier networks—often erode individual
businesses’ profit-making capabilities. In other words, many African firms’ “ability to produce value beyond the cost of their direct and indirect
inputs is heavily constrained by the magnitude of the cost of the latter.”[10] Finally, markets for goods
in nearly all of our 14 fragile states are particularly disparate and weak. Even with strong support from multilateral development banks on the supply
side, the private sector will not thrive without predictable and steadily increasing demand from local consumers.
Rationale for public sector support of the private sector
Before launching into a more in-depth discussion of PSD initiatives in fragile states, we shall examine several broad theoretical rationales for public
sector support of the private sector. First, it is believed that PSD activities help to create jobs and foster economic growth (the private sector
accounts for roughly 90 percent of jobs in the developing world).[11] Second, many argue that the
public sector should support the private sector because individual businesses are constrained by numerous government-driven limitations, ranging from
corruption to lack of physical infrastructure. Third, many of these constraints result from market deficiencies that theoretically can be rectified by
public sector initiatives. For example, imperfect capital markets hinder businesses—notably small and medium enterprises—by not investing in profitable
projects. This often occurs because of imperfect information regarding profitability, high transaction costs, and insufficient legal frameworks and
enforcement mechanisms. Relatedly, informal and small firms are often unable to pledge collateral and lack formal title rights to physical property.[12] Another example relates to
governance. PSD requires an appropriate institutional framework that the private sector cannot provide for itself. While there are several examples of
private sector firms joining together to help stabilize the governance environment (such as in Somaliland), most firms in fragile states are unwilling
or unable to create the institutional framework necessary to promote PSD by themselves.[13]
Existing multilateral efforts—the World Bank Group
The World Bank Group and others donor organizations’ PSD goals in African fragile states broadly mirror those in other low-income countries. The key
differences relate to developing policies and projects that are tailored to the more difficult operating environments.
The World Bank’s soft loan facility (the International Development Association, or IDA) has a significant presence in fragile states. All of the
African fragile states are IDA-eligible borrowers, though several countries (namely, Sudan and Zimbabwe) currently are inactive due to World Bank Group
loan arrears. Oil-producing African fragile states (Angola and the Republic of Congo) are above the IDA lending income cutoff, but still have access to
IDA loans on “hardened terms.”[14] Although one of IDA’s
specific foci is PSD, its projects in many sectors such as infrastructure and regulatory reform result in positive spillover effects for private sector
businesses. Indeed, much of IDA’s contribution to the private sector may result from indirect benefits from non-PSD–focused IDA projects. IDA’s current
eligibility requirements have significant implications for the institution’s future. A recent study estimates that by 2025, most IDA-eligible countries
will be African fragile states—a reality that may compel IDA to restructure its strategy around fragile lending environments in the coming years.[15] By extension, adapting to
the specific constraints of fragile states will be essential to IDA’s continuing success.
The efforts of the World Bank Group’s private sector arm are of particular interest. The International Finance Corporation (IFC) is a leading global
player in the PSD spectrum and makes nearly 40 percent of all investments that originate from development finance institutions.[16] However, IFC’s 2010 project
disbursements to African fragile states, on a per capita basis, were four times smaller than commitments to middle-income countries.[17] The smaller levels of
investment in African fragile states reflect investment conditions characterized by volatility and high levels of risk, limited private sector
partners, and few choices for viable investment projects. And if IFC hopes to scale up its investments in African fragile states (a World Bank
Group–wide measure has been proposed in the most recent World Development Report), it must innovate its investment model.
Taken together, the World Bank Group has shown an increased level of commitment toward fragile states in recent years. During the World Bank’s spring
2011 Development Committee meeting, shareholders agreed on the following commitments:[18]
Make fragile and conflict situation (FCS) strategies more fragility-focused by preparing new strategies for FCS countries.
Increase attention to jobs and PSD by promoting a common World Bank Group approach to employment and introducing new IFC/Multilateral Investment
Guarantee Agency (MIGA) instruments.
Realign results and risk frameworks for FCS countries through the development of results metrics that are sensitive to conflict and fragility.
Strive for “global excellence in FCS” by establishing a new FCS hub in Nairobi by the end of fiscal year (FY) 2011 and further revising human
resource policies that reflect FCS priorities and needs.
Since this World Bank Group strategy was approved only recently, it has yet to be operationalized by the individual World Bank subsidiary organizations
such as IFC and IDA. However, the IFC launched its five-yearConflict Affected States in Africa Initiative in 2008 to help design and implement
integrated strategies that support economic recovery in conflict-affected countries. Roughly 18 percent of total IFC advisory service expenditures
worldwide are committed to World Bank–classifiedfragile states, which include non-African countries. Specifically, the Conflict Affected States
in Africa program has four main elements: improving the business environment through regulatory reform; strengthening small and medium enterprises and
support institutions (such as chambers of commerce); rebuilding financial markets and other financial institutions; and increasing private sector
involvement in rebuilding infrastructure.[19] The IFC has implemented
Conflict Affected States in Africa projects in several postconflict countries with severe business climate constraints, such as Burundi, the Central
African Republic, the Democratic Republic of Congo, Liberia, and Sierra Leone. It continues its extensive advisory service operations in many African
fragile states. IFC emphasizes the importance of these services in lieu of larger investment project operations, which it says are especially difficult
in fragile environments.[20]
Although there are numerous efforts aimed at promoting African infrastructure growth (one result of which would be private sector growth), few of these
initiatives have the capability and/or audacity to commit resources to fragile states. Although examined for this report, many private sector and
infrastructure initiatives were not included because they do not focus on fragile states. These initiatives/institutions include NEPAD’s Infrastructure
Investment Fund, DevCo (a fund overseen by the Private Infrastructure Development Group), and InfraCo (also funded by the Group). A list of selected
PSD initiatives in fragile states is located in appendix 8. Of particular interest is the Public-Private Infrastructure Advisory Facility (PPIAF),
which was established in 1999 to increase private sector participation in emerging markets. PPIAF provides grants to help governments create a sound
enabling environment for private participation in infrastructure through activities such as framing infrastructure development strategies, organizing
stakeholder consultation workshops, and designing pioneering projects.[21] PPIAF, committing about $20
million a year globally, has sponsored projects in fragile states such as the Democratic Republic of Congo, Guinea, Guinea-Bissau, Liberia, and Sierra
Leone.[22] The projects often
have a regional focus, and PPIAF’s 2011–13 work plan cites fragile states as one of four major cross-cutting themes for future projects.
The World Bank Group’s Financial Investment Advisory Service (FIAS) is a multidonor investment climate program that assists developing and transition
economies to improve their business environments with an emphasis on regulatory simplification and investment generation.[23] FIAS also coordinates with
IFC Advisory Services and other World Bank Group departments. Forty-five percent of FIAS activities in FY10 occurred in Sub-Saharan Africa, including
31 percent of its implementation expenditures in fragile and postconflict states.[24] FIAS completed five business
reforms in three fragile states, including business taxation reform in Sierra Leone, construction permits in the Democratic Republic of Congo, and
investment policy reforms in Guinea-Bissau. In 2011, FIAS began designing a methodology to estimate the savings accrued to firms resulting from its
business climate reform support. FIAS’s client satisfaction rating has hovered around 90 percent in recent years.[25] Moreover, FIAS released a Rough Field Guide to Investment Climate Reform in Conflict-Affected Countries in 2010, which explicitly links investment climate improvement
with peace-building efforts in postconflict countries. The report also provides highly detailed instructions on the design, implementation, and
evaluation of investment climate reforms, including laws, regulations, and procedures that govern industry competiveness, bureaucratic efficiency, and
institutional governance.[26]
The World Bank’s Doing Business project provides absolute and relative measurements of business regulations and obstacles across 183 economies. These
annual reviews contain extensive data on constraints to business growth, including time and costs required to start a business, licensing fees,
construction permits, and trading across borders. Unlike most private sector–oriented diagnostics, Doing Business collects data annually for nearly all
of the world’s economies.[27]
While the Doing Business program does not support specific business reform activities, its field analysis and findings feed into IFC, FIAS, and
non–World Bank Group programs assisting fragile states (and other countries) with business climate reforms.
Promoting business growth—policy goals in fragile states
The next chapters describe the World Bank Group’s projects in some detail. But first, with a view to evaluating the efforts of the World Bank Group, we
describe four key business growth–related objectives in fragile states: supporting broad-based economic growth, job creation, tax mobilization, and
positive spillovers. We also introduce a conceptual framework to guide support operations that could be adapted and applied to a variety of African
fragile state environments.
Broad-based economic growth
Sustained, broad-based economic growth is the critical driver for significant poverty reduction in low-income countries, particularly in view of the
limited scope for income redistribution. But as the World Bank’s Commission on Growth and Development states, economic growth is not an end in itself.
Rather, it is the spark to create resources and social services to support health, education, job creation, and other development goals. By
illustration, one study estimated that a 2 percent rise in average household income resulted in a 1.2–7.0 percent decline in poverty rates.[28] Therefore, economic growth
has major implications for poverty reduction in African fragile states.[29] Over the last 30 years,
poverty levels have fallen significantly, with much of the progress being attributable to economic growth. Globalization has provided the platform to
expand markets, import ideas and technology, and facilitate the movement of human capital and investment to regions that were previously largely closed
off from the global economy. Although there is not one common success story, countries that have achieved sustained economic growth have maintained
macroeconomic and political stability, raised investment and savings, and opened their markets. The overriding policy challenge is to determine how to
apply these success stories to the poorest and most fragile countries.
The World Bank’s Commission on Growth and Development outlines several types of countries that face dramatic challenges in achieving sustained economic
growth. These include Sub-Saharan countries still contending with postcolonial resource extraction models and negative spillovers from unstable and
violent neighbors; small states with significant concentration in a few economic sectors highly vulnerable to exogenous shocks; governments facing
comparatively high per capita costs of social services; and countries rich in natural resources facing Dutch disease and rent-seeking risks. Most
African fragile states examined in this report fall into one of these categories.
Job creation
The labor market is deeply entwined with both economic growth and poverty reduction. Many African fragile states face high, persistent unemployment
levels, particularly among youth and demobilized combatants, which can contribute to increased rates of violence, political instability, and higher
levels of poverty.[30] Therefore,
supporting job creation opportunities should be a central objective of any World Bank Group operation that aims to promote business growth. The
relationship between jobs and growth is largely a two-way street: sustainable economic growth depends at least partly on the underlying labor market
structure and a flexible labor force, while employment growth often depends on growth of output in the formal sector. But a key characteristic of
African labor markets is the very high ratio of informal to formal sector employment.[31] Thus, although formal sector
growth is essential in the long term, the informal sector often has greater capacity to absorb the ever-expanding labor force—especially in economies
constrained by low formal output growth.[32] Therefore, African fragile
state governments and donor organizations often need to pursue two-track approaches for supporting increased productivity within the informal sector
while simultaneously improving the operating environment for formal enterprises.
Tax mobilization
A third PSD-related objective is fostering a broad, stable tax base, which contributes to improved governance, accountability, and economic growth.
Domestic tax policies have the potential to strengthen government legitimacy in the eyes of constituents through increased accountability and
transparency, perceived fairness, and a clear political commitment to shared prosperity.[33] Government revenues are also
necessary for providing social services and can be used to support economic growth and diversification. There is considerable variation in African
countries’ tax bases, with the lowest tax bases often corresponding to almost exclusive dependence on natural resource rents. Tax revenues average
roughly 14 percent of GDP in African fragile states, with oil exporters Chad and the Republic of Congo on the low end with slightly higher than 5
percent of GDP and Liberia and Zimbabwe on the high end with approximately 30 percent of GDP.[34] Due to large informal
sectors, most fragile states have relatively narrow tax bases. Thus, the government’s “fiscal-social contract” with the private sector is an important
step toward reform. Formalizing the informal sector of the economy creates not only a broader tax base and larger stream of revenue to provide
necessary services, it provides an incentive for expanded political participation.[35]
Positive spillovers and multipliers
Another driver of success is growth spillovers—when growth in one part of the country or some subset of firms impacts the growth of other firms or
regions. At the country level, open borders for the flow of goods and services, along with increasing migration and flow of human capital, lead to
increasingly positive spillovers. Within countries, knowledge and technology are key ingredients in the development of industry, and can be shared
across firms. Also, firms in fragile states may be able to “borrow” knowledge cheaply, helping to “leapfrog” the historic development process. Mobile
phone technology is a prime example.[36] Finally, some types of
investments can also spur the growth of related industries, either upstream or downstream in the production process.[37]
Private sector development policy design in fragile states
In light of these policy goals, how should the World Bank Group best prioritize its PSD-related support programs in African fragile states? Upon
careful review of the diagnostics of each economy and the tools available to donors, we propose that good policies are drawn from the intersection of
three elements—the private sector’s most severe constraints, the stated priorities of governments, and policy interventions with an acceptably
effective track record (figure 2.1). The policies emerging from the intersection of these areas must also support the above-mentioned goals of economic
growth, job creation, tax mobilization, and positive spillovers.
Our conceptual model brings together these three fundamental areas for policy design. First, to generate growth, policymakers must create a conducive
environment for business owners and managers of small, medium, and large firms. Extensive survey data on the problems reported by businesses are
available on the World Bank’s website and from other sources.[38] We analyze these data to
identify the most critical problems facing businesses that are trying to survive in fragile environments. Understanding their constraints is the
crucial first step toward good policy design. Whether it is the basics (infrastructure and public services), regulations (taxes, licensing rules), or
labor shortages, we need to know what the private sector believes is holding back growth.
The second area is understanding government priorities. Policymakers in fragile states operate in very difficult environments, often trying to address
various constraints simultaneously with very few resources. Understanding their perspective and primary objectives is important, especially for
policymakers in multilateral institutions. By searching through public documents, speeches, and other data, we try to identify what African fragile
state governments perceive to be their most binding PSD-related obstacles. There may well be some overlap between their perspective and that of the
private sector, as we will see in next chapters.
Third, we must use the lessons learned from past policy interventions. Understanding what has worked in fragile environments will be useful to the
design of new policies, programs, and projects, particularly when these findings are referenced against public and private sector constraints and
priorities. To accomplish this task, we analyze past policy interventions using a database of IDA projects and other sources to identify successful
projects by sector, type, and location.
When considered together, these three analytical components can help multilateral organizations prioritize PSD-related programs in fragile states. As
noted previously, donor institutions ideally would pursue projects in sectors or areas where all three components intersect (what the private sector
needs, what the government wants, and what donors do effectively). This is the “priority action” zone of the conceptual framework. But there will be
situations or environments in which multilateral organizations may wish or need to pursue projects or investments that do not meet this condition. In
this instance, we recommend that multilateral organizations then prioritize projects in sectors or areas where two of the three components intersect.
Careful attention should be given to why one of the components does not meet this condition and what types of remedial actions would be required. For
each of the omitted policy prioritization components, potential remedial steps could include the following in different situations:
Major PSD constraints (need to tread carefully).
Multilateral organizations should proceed very cautiously in the absence of private sector buy-in. However, there could be instances when
proceeding could be justified—such as a prioritization overlap with informal and/or small and medium enterprises, though not with the business
elite.
Government priorities (need to get buy-in).
Multilateral organizations should determine why the private sector and national government priorities are not consistent. After this, steps should
be taken to encourage government buy-in as appropriate—particularly in areas where direct or indirect government involvement is likely. But
multilateral organizations may want to deprioritize the need for buy-in in failed or highly repressive states.
Proven results (need to innovate)
: Multilateral organizations will need to consider innovative or alternative implementation models to ensure that project or investment results
exceed historical performance patterns. Moreover, careful attention should be given to programmatic factors that are significantly predictive of
project outcome performance ratings, such as quality-at-entry and supervision (these issues are examined in greater detail in chapter 4).
The next chapters explore each of these areas—constraints reported by businesses, priorities of governments, and understanding what works—in
significant detail. Each chapter examines the available data, and then compares them with the project portfolio of the three relevant World Bank Group
entities—IDA, IFC, and MIGA (when possible). The aim of this analysis is to understand whether these institutions have operated with a consistent,
well-defined strategy and whether their projects have met needs identified by either the government or the private sector (or ideally both). Finally,
our conceptual model is used to identify priorities for Africa’s newest country, South Sudan (chapter 6). Case studies for Somaliland and Zimbabwe are
included as well.
[4]
For example, Zain (a Kuwaiti mobile telecommunications company) has made major investments in South Sudan since 2008. To date, Zain has
invested more than $300 million in their South Sudan network.
[5]
Government spending from resource-generated revenue contributed an additional 8 percentage points. See McKinsey & Company (2010).
[6]
In a 2010 interview with the Infrastructure Consortium for Africa, Bobby J. Pittman Jr., African Development Bank Vice President for
Infrastructure, Private Sector Development, and Regional Integration, noted the AfDB’s strong interest in high-return investments in African
infrastructure projects.
[8]
Fragile states record significant amounts of remittances from abroad. World Bank estimates for 8 of the 14 countries in the sample are that
remittances counted for an average of nearly 4 percent of GDP in 2009. During that year, the average for Sub-Saharan Africa was roughly 2.5
percent.
[13]
See appendix 6 for more in-depth information on how the Somaliland private sector helped stabilize an otherwise volatile business environment
in the subnational territory.
[16]
IFC (2010a). This includes institutions such as IFC, the European Bank for Reconstruction and Development, and MIGA.
[17]
Of IFC capital, 89 percent is invested in middle-income countries (DfID 2010). According to authors’ calculations, IFC’s 2010 commitments to
MICs were roughly $1.31 per capita, while commitments to African fragile states were only $0.31 per capita.
[18]
World Bank Group Development Committee (2011).
[20]
The developmental and financial returns gained from advisory service projects are far more ambiguous than returns gained from investment
projects (for instance, IFC received a 16.5 percent return on its organizationwide manufacturing equity investments in 2010). Therefore, much
of IFC’s work in African fragile states is difficult to quantify, and the full impact of IFC in these countries may not necessarily be
presented by the data analysis contained in this report. But the IFC’s own evaluation report completed by the World Bank Group’s Independent
Evaluation Group determined that advisory projects in “high-risk” business climates tend to have higher development effectiveness than those in
their non-high-risk counterparts. This same assessment applies to IFC investment projects in high-risk climates.
[22]
The PPIAF also manages the Private Participation in Infrastructure Database, which houses data on more than 4,600 infrastructure projects in
137 countries, including the Central African Republic, Sierra Leone, and Zimbabwe. The database has project-level reports on energy,
telecommunications, transport, and water and sewage sectors, which allow trend identification in the private infrastructure space.
[24]
FIAS implementation expenditures for 2010 totaled $18.5 million.
[25]
Another positive indicator is FIAS’s recent improvements (from 48 percent in 2008 to 77 percent in 2010) in the World Bank’s own Development
Effectiveness ratings.
[26]
Also in 2010, FIAS launched the Investing Across Borders report, which provides objective data on the climate for foreign direct
investment in 21 African countries, including Liberia and Sierra Leone. The report presents numerous indicators under the following four
categories: friendliness to foreign investors (that is, the percent of ownership allowed), ease of starting a foreign business, ease of
accessing industrial land, and complexity and length of the commercial arbitration process. See World Bank(2010b).
[27]
The only African fragile state without Doing Business coverage is Somalia.
[29]
Over the past decade, the average oil-exporting African fragile state’s GDP grew at a pace of between 3 and 11 percent, while the average
non-oil-exporting African fragile state grew at a pace of –1 to 5 percent (measured on an annual basis).
Constraints to business growth in African fragile states
One of the public sector’s primary objectives in assisting the private sector is to relieve constraints that may stifle businesses’ ability to grow,
expand employment opportunities, and generate profits. Recognizing this, donor organizations have increased funding over the last decade for private
sector development (PSD) diagnostics that help to identify these binding constraints. While there are a number of instruments available, we focus
primarily on two World Bank surveys: the Doing Business reports, which provide comprehensive assessments on regulatory, financial, and political
constraints through a top-down methodology; and the Enterprise Surveys, which gauge firms’ views about business environment constraints.
World Bank Doing Business Reports
Doing Business country (and subnational) reports provide relative and absolute measures of business environment constraints across eight distinct
categories, such as the ease and cost of starting a new business, enforcing contracts, and trading across borders. The Doing Business methodology
scores countries according to both the attractiveness of their current business environment (the number of days it takes to secure an import license)
and their progress toward delivering more private sector–friendly policies (the number of regulatory reforms that have been completed in a given year).
Overall, the Doing Business reports, providing the most comprehensive country coverage, are completed on an annual basis—which allows for more dynamic
monitoring of business environment changes and trends.
With few exceptions, African fragile states lag far behind their higher income and non-African fragile counterparts on nearly every Doing Business
measure. On average, African fragile states have an ease of doing business ranking of 171 (of 182 countries) compared with an average ranking of 125
for other low-income countries (table 3.1). Importing a standardized container of goods costs nearly three times more in African fragile states than in
middle-income countries.[1] And
starting a new business costs more than three times as much in African fragile states than in other low-income countries. These exorbitant operating
costs have a profound impact on businesses’ ability to generate profits, expand, and compete in a globalized marketplace.[2] Moreover, they contribute to
broader economic effects, such as inflation, large informal sectors, and rent-seeking behavior.
Table 3.1: Fragile states compared with other developing countries, Doing Business indicators
Income category
Overall ranking
Cost to import container ($)
Cost to start a business (percentage of GDP per capita)
Time to register property (days)
Time to enforce a contract (days)
Middle-income country
96
1,443
26
49
635
Low-income country
125
2,308
61
68
545
Africa nonfragile state
117
1,972
47
54
629
Non-African fragile state
125
1,968
69
132
650
African fragile state
171
3,596
184
96
722
Source: World Bank 2011b.
While Doing Business reports provide a useful assessment of business environment issues, they also omit several factors that impact PSD, such as
macroeconomic stability, security, quality of infrastructure, and corruption. As such, they should be used with other diagnostic instruments to
identify the most binding constraints on business growth in African fragile states.
World Bank Enterprise Surveys
The World Bank Enterprise Surveys compile individual firms’ opinions and concerns to assess national and regional business environments. The surveys
fill in many of the gaps in the Doing Business reports, such as corruption, physical infrastructure (including transport), crime, informality,
competition, and access to finance. Private contractors administer the surveys to firms largely in the manufacturing and service sectors, including
construction, transport, and information and communication technology. As of mid-2011, World Bank Enterprise Surveys were available for 12 of our
sample of 14 African fragile states.[3]
Despite their significant strengths, World Bank Enterprise Surveys have two key weaknesses. First, they are fairly expensive, time-consuming, and
infrequently completed (not annually or according to a clearly defined timetable). So they are not an ideal instrument for identifying country trends
over time. Second, the surveys focus almost exclusively on firms in the formal sector.[4] Since the informal sector
accounts for the overwhelming majority of businesses and employment in low-income countries, enterprise surveys may not adequately reflect constraints
impacting the broader business sector. Even so, while World Bank Enterprise Surveys may have limitations, they remain a very useful tool in gauging
firms’ views about major constraints.[5]
Ramachandran (2010) summarizes in detail the available survey data for African countries, along with analyzing trends between countries and income
groups.[6] Businesses in the
poorest African countries—in which most fragile states are included—tend to cite basic infrastructure deficiencies, access to financing, and lack of
macroeconomic stability as the primary constraints to profitability and expansion.[7] Other constraints, such as
weak governance, low administrative and bureaucratic capacity, and official corruption are cited more frequently in the next highest income tier of
Sub-Saharan countries (such as Kenya and Senegal). Businesses in the highest income group (such as Gabon and South Africa), on average, cite the lack
of job skills and labor regulation as more binding constraints.
Since country fragility is defined according to policy and institutional quality measures, we also examine business constraints in relation to IDA
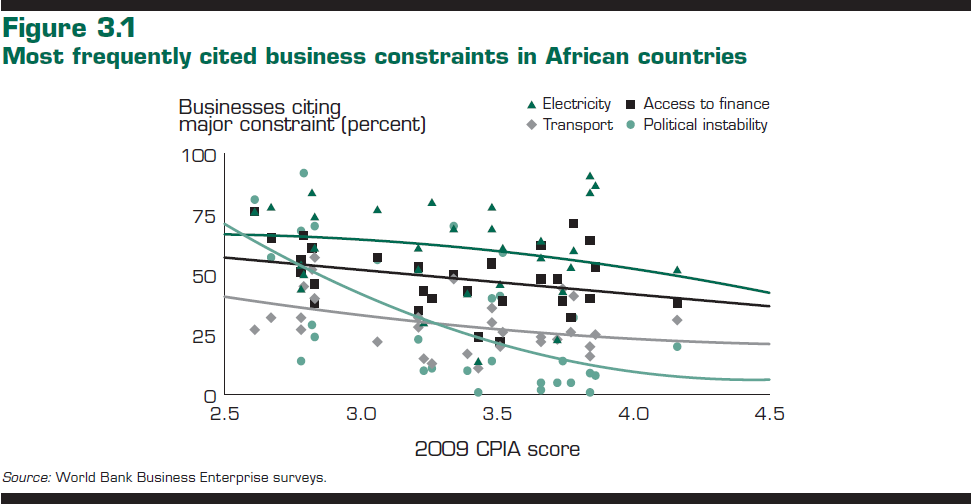
Resource Allocation Index (IRAI) scores (as opposed to income per capita levels). Figure 3.1 illustrates several of the most frequently cited business
constraints in African countries—political instability, transport infrastructure, electricity, and access to finance.[8] Across the board, the
percentage of firms reporting these issues as “major constraints” declines as countries’ IRAI scores increase. Not surprisingly, concerns about
political instability decline the most dramatically across our country sample. Nearly twice as many African firms cite concerns about electricity as a
“major constraint” compared with concerns about transport infrastructure. And access to finance is also cited more frequently as a “major constraint”
than transport infrastructure is.
For African fragile states, the most frequently cited business constraints include: electricity (68 percent), access to finance (56 percent), political
instability (56 percent), corruption (48 percent), taxation rates (40 percent), competition from informal firms (40 percent), transport (38 percent),
crime (35 percent), customs regulations (28 percent), and worker skills (27 percent; table 3.2).
Table 3.2: Most frequently cited business constraints in African fragile states (percent)
Country
Electricity
Access to finance
Political instability
Corruption
Tax rate
Competition from informals
Transport
Crime
Customs regulations
Worker skills
Angola
43.9
55.8
13.6
35.0
22.6
25.4
27.0
35.5
21.6
20.6
Burundi
76.5
56.6
56.3
18.1
33.6
39.8
22.1
21.2
20.4
15.5
Chad
81.6
47.4
68.9
66.9
54.4
71.3
45.9
51.5
58.1
59.7
Congo, Dem. Rep
78.4
64.9
56.7
21.3
52.6
45.5
32.0
20.6
19.8
16.2
Congo, Rep.
74.4
45.5
70.4
66.4
42.9
49.2
57.0
47.1
49.1
53.9
Côte d'Ivoire
50.1
66.2
92.2
71.7
40.8
32.8
44.7
54.9
27.3
37.7
Guinea
84.2
61.4
28.8
53.8
38.0
25.0
52.2
34.8
12.0
14.1
Guinea-Bissau
75.7
75.7
80.6
40.0
47.9
32.9
27.1
31.4
26.4
15.0
Liberia
60.8
37.7
23.5
38.2
26.0
22.7
40.3
30.6
17.4
13.0
Togo
53.8
50.8
68.3
66.1
40.5
52.0
32.3
22.2
30.2
19.5
Average
68.0
56.2
55.9
47.8
39.9
39.7
38.1
35.0
28.2
26.5
Other Sub-Saharan countries
51.0
41.0
17.0
32.0
39.0
34.0
25.0
27.0
20.0
22.0
Source: World Bank Business Enterprise surveys.
World Bank Group alignment with business constraints
The aforementioned surveys and analysis provide programmatic prioritization insights for respective donor organizations.
Since the World Bank Group expends significant resources on business diagnostics, we would expect International Development Association (IDA),
International Finance Corporation (IFC), and Multilateral Investment Guarantee Agency (MIGA) activities to direct their projects toward those factors
that pose a “major constraint” to PSD in fragile states.[9] Put differently, the World
Bank Group should be drawing upon individual firms’ opinions before developing and implementing sizable support programs and investments for
PSD-related activities.[10]
Methodology
To gauge the World Bank Group’s alignment, we focus on a subset of major business constraints that can be mapped clearly to World Bank Group projects
and investments, including electricity, access to finance, and transport infrastructure. The multifaceted dimension of other constraints—such as
political instability and crime—makes it difficult to identify overlap with donor programs in a concise manner.[11] For projects and
investments, we examine all IDA, IFC, and MIGA activities between 2000 and 2010 in 11 African fragile states with business enterprise survey data.[12] Moreover, we use each
institution’s classifications to determine the priority sector or area for each project, investment, or guarantee.[13]
IDA
As seen in a number of different measures, IDA projects over the last decade exhibit a significant level of alignment with firm views concerning
electricity and transport constraints. The correlation between the number of IDA projects targeting these sectors (measured as the percentage ofall IDA PSD-related projects) and the percentage of firms citing them as “major constraints” is 0.54 and 0.52, respectively.[14] As expected, there is
almost no correlation between the total value of IDA projects targeting these sectors (measured as the percentage of all IDA projects).
Put differently, IDA has prioritized electricity and transport projects within its PSD-related portfolio while not necessarily prioritizing them with
respect to its overall project portfolio value in African fragile states. Given broader development priorities that commonly exist in African
fragile states—such as social service delivery and security sector reform—this is not particularly surprising. By contrast, IDA’s alignment with firms’
concerns about access to finance is strikingly low. The correlation between IDA projects targeting this constraint (measured as a percentage of all PSD
projects) is only 0.04, suggesting that IDA has deprioritized financial sector projects in African fragile states—in the form of either regulatory
reform or support for local financial institutions (table 3.3).[15] ,[16] IDA’s low level of access
to finance projects could also be attributed to the comparative advantage of other World Bank Group subsidiaries (IFC) in this sector, which may be
better-equipped to promote access to finance.
Table 3.3: IDA alignment with “major constraints,” by country, selected measures [CLICK TO VIEW]
Figure 3.2 provides another illustration of IDA’s prioritization across the examined sectors according to the percentage of individual firms citing
them as “major constraints.” As the aforementioned correlation analysis suggests, IDA appears to prioritize PSD projects in electricity and transport
in African fragile states where they present the greatest constraints. Alternatively, IDA appears to pursue fewer financial sector projects when firms
cite access to finance more frequently as a “major constraint.”
IFC
Unlike IDA, IFC investment services focus on economic sectors (such as manufacturing and services companies) rather than broader constraints to PSD
growth. Conversely, IFC advisory services often work with governments to improve the overall investment climate in fragile states such as the
Democratic Republic of Congo and South Sudan. Neither investment nor advisory services focus explicitly on electricity and transport constraints, and
thus we expect that very few investments have targeted those obstacles to private business growth. However, we could expect IFC investments in the
financial services sector (to counteract the “access to finance” constraint).
IFC investments in recent years. Based on a number of different measures, IFC investments in African fragile states over the last decade exhibit almost no alignment with firm
concerns about binding electricity and transport constraints (figure 3.3 and table 3.4).[17] Indeed, the correlation
between the number of IFC investments targeting these sectors (measured as the percentage of total number of IFC investments) and the percentage
of firms citing them as “major constraints” is –0.25 and 0, respectively.[18] For electricity, possible
reasons for the misalignment are the highly regulated nature of electricity sectors in African countries and the limited openings for private
investment in public power projects. IFC has been successful in investing in Togo’s power sector, and it has been able to contribute to the
electricity-related regulatory dialogue in Liberia.
Table 3.4:IFC alignment with constraints, 2000–11 (percent)
Electricity
Transport
Access to finance
Firms citing as major obstacle
In-country project value
In-country project count
Firms citing as major obstacle
In-country project value
In-country project count
Firms citing as major obstacle
In-country project value
In-country project count
Angola
43.9
0.0
0.0
27.0
0.0
0.0
55.8
4.4
50.0
Burundi
76.5
0.0
0.0
22.1
0.0
0.0
56.6
3.3
40.0
Chad
81.6
0.0
0.0
45.9
0.0
0.0
47.4
10.5
50.0
Congo, Dem. Rep.
78.4
0.0
0.0
32.0
0.0
0.0
64.9
12.4
53.8
Congo, Rep.
74.4
0.0
0.0
57.0
0.0
0.0
45.5
0.0
0.0
Côte d'Ivoire
50.1
0.0
0.0
44.7
0.0
0.0
66.2
100.0
100.0
Guinea
84.2
0.0
0.0
52.2
0.0
0.0
61.4
0.0
0.0
Guinea-Bissau
75.7
0.0
0.0
27.1
0.0
0.0
75.7
100.0
100.0
Liberia
60.8
9.5
20.0
40.3
0.0
0.0
37.7
30.7
40.0
Sudan
41.0
0.0
0.0
22.0
0.0
0.0
45.0
0.0
0.0
Togo
53.8
9.7
20.0
32.3
0.0
0.0
50.8
3.8
20.0
Correlation
–0.25
–0.25
0.61
0.64
Source: International Finance Corporation and authors’ calculations.
Ultimately, however, the IFC is less likely, on average, to support investment deals in environments with more binding constraints, apart from access
to finance. The data illustrate IFC’s recent concerted efforts to target access to finance constraints in several African fragile states, including
Côte d’Ivoire and Guinea-Bissau. Recent IFC investments in these two countries are wholly concentrated in finance-related sectors.[19] While firm concerns could
signify strong market demand opportunities for IFC, the high respondent rates likely also signify regulatory distortions and other market risks that
could jeopardize IFC’s financial returns. While these findings are striking, they should not be overemphasized given IFC’s historical focus on market
sectors (as noted above). IFC alignment with these sectors is explored in chapter 4.
IFC investments before 2000. When we extend our country sample prior to recent years and beyond the 14 current African fragile states, historical IFC investment trends show
little focus on constraints such as electricity, roads, and access to finance. Between 1980 and 2000, IFC invested $2.6 billion in all African
fragile states that fit our definition of “chronically fragile” states (table 3.5).[20] Of this $2.6 billion, 63
percent went to mining projects alone, while just 0.7 percent went to electricity and 0.5 percent to roads. Nineteen banking and finance projects
accounted for just 3.2 percent of the total. Assuming that business constraints in African fragile states have remained relatively unchanged over the
past few decades, IFC’s investment record does not show a commitment toward addressing some of these limitations.[21]
Table 3.5: IFC investments in African fragile states by sector, 1980–2000
Sector
Total commitments (2000 $ millions)
Commitments in African fragile states (2000 $ millions)
Commitments in African fragile states (percent)
Infrastructure
12,742
63
2.4
Telecommunications
3,694
15
0.6
Roads
1,090
5
0.2
Electricity
5,851
42
1.6
Water and sanitation
699
0
0.0
Railways and ports
1,408
1
0.0
Regulatory
1,927
5
0.2
Trade
532
0
0.0
Economic management
292
0
0.0
Financial sector
1,103
5
0.2
Extractive
9,352
1,664
63.2
Oil and gas
927
0
0.0
Mining
8,425
1,664
63.2
Social services
554
4
0.1
Education
65
0
0.0
Health
457
4
0.1
Finance
9,649
83
3.2
Banking
9,649
83
3.2
General agriculture
2,697
69
2.6
General PSD
38,511
744
28.3
Environment
16
0
0.0
Total
75,449
2,632
100.0
Source: International Finance Corporation.
MIGA
Between 2000 and 2010, MIGA provided only one banking sector guarantee in our sample of 14 African fragile states. It did not provide any guarantees to
support foreign investments to improve electricity or transport infrastructure networks. As a result, there is no alignment between MIGA activities and
firms’ concerns about “major constraints” to growth and profitability. Historical MIGA guarantees mirror this trend when we extend our country sample
beyond the 14 current African fragile states. Between 1990 and 2011, MIGA provided guarantees totaling $797 million in African fragile states—of which
27 percent went to telecommunications projects (a low priority for businesses; table 3.6). Also during this time, MIGA guarantees for electricity and
roads projects were just 2 percent and 0 percent of total guarantees in African fragile states. However, as with IFC, MIGA has traditionally been
focused on market sectors instead of broader PSD-related constraints. MIGA alignment with these sectors is explored in the chapter 4.
Table 3.6: MIGA investments in African fragile states by sector, 1990–2011
Sector
Total MIGA guarantees ($ millions)
Guarantees to African fragile states ($ millions)
African fragile state guarantees (percent)
Total MIGA project count
Project count in African fragile states
Africa fragile state projects (percent)
Infrastructure
9,354
255
32.0
170
12
32.4
Telecommunications
2,074
213
26.7
39
9
24.3
Roads
2,626
0
0.0
20
0
0.0
Electricity
3,571
20
2.5
85
1
2.7
Water and sanitation
748
4
0.4
21
1
2.7
Finance
8,849
173
21.7
254
8
21.6
Agriculture
501
165
20.7
36
6
16.2
Banking
8,347
8
1.0
218
2
5.4
Extractive
2,794
38
4.7
56
2
5.4
Oil and gas
1,132
24
3.0
17
1
2.7
Mining
1,662
14
1.7
39
1
2.7
General PSD
4,641
332
41.7
213
15
40.5
Total
25,637
797
100.0
693
37
100.0
Source: Multilateral Investment Guarantee Agency.
Conclusion
While the World Bank Group has made significant strides in assessing the constraints to business growth in fragile states over the past 10
years, two of its subsidiaries (IFC and MIGA) have not committed significant financial resources to address the most binding business constraints. As
noted above, both organizations’ business models prioritize financial returns as opposed to development returns. Given this, IFC and MIGA, for various
reasons, have been reluctant, unable, or unwilling to execute investments and guarantees in African fragile states that target the most binding
business constraints. By contrast, IDA displays a significant level of alignment with business constraints in African fragile states—with the possible
exception of access to finance.
Notes
[1]
This disparity is not driven solely by landlocked status. Only four of the examined African fragile states are landlocked (Burundi, the Central
African Republic, Chad, and Zimbabwe).
[2]
In general, the World Bank Group’s efforts to improve country business environments are based on the assumption that higher institutional
quality will lead to increased business performance. But the literature does not unanimously support this assumption. For instance, Commander
and Nikoloski (2010) do not find a statistically significant relationship between many of the Doing Business indicators and actual business and
investment performance. Even so, the World Bank’s current initiatives aimed at promoting investment in developing countries place a strong
emphasis on business constraints, such as those determined by Doing Business Surveys.
[3]
These include Angola, Burundi, Chad, Côte d’Ivoire, the Democratic Republic of Congo, Eritrea, Guinea, Guinea-Bissau, Liberia, the Republic of
Congo, Sudan, and Togo. However, the Eritrea business enterprise survey is excluded from our analysis due to methodology and quality
deficiencies. The World Bank Enterprise Survey team had planned to publish its Zimbabwe survey data in late 2011, but at time of publication
had not yet done so.
[4]
But the World Bank occasionally departs from its standardized methodology and surveys informal and micro enterprises as well.
[5]
Doing Business Surveys and Enterprise Surveys do not fully encapsulate the business environment picture in African fragile states. Fragile
state business environments often face constraints that do not appear in business surveys, such as the criminalization of the private sector or
the infiltration of military groups into commercial activities (as a means by which to collect rents). Also, the lack of long-term sustained
investment in infrastructure places fragile and conflict-affected states at an even greater disadvantage than a typical low-income country.
[8]
IRAI scores and GDP per capita levels are largely uncorrelated (coefficient of 0.06 among African countries).
[9]
When selecting projects for approval, World Bank staff are fully cognizant of two key project attributes: the feasibility of a project’s
success, and the project’s cost. These factors can sway project decisions, regardless of alignment with business constraints or host government
priorities. For example, country directors in fragile states often approve technical assistance projects, as they are significantly less
expensive and carry less risk of failure. Sometimes these technical assistance projects will address regulatory constraints to businesses and
can help relieve those constraints. But using our methodology, these projects will appear to be smaller, as their commitment values indicate.
Our use of project count (as opposed to commitment value) attempts to illustrate this dynamic and draw out these subtleties.
[10]
The intentions or stated aims of World Bank Group strategy may not always lead to project alignment with business priorities. For example, Bank
Group staff may decline to implement an electricity project (despite the business community’s strong demand for electricity) because an
urban-based electricity generation project could exacerbate inequalities between politically powerful urban populations and rural areas. Bank
Group staff may also be unable to implement projects in desired business areas due to regulatory restrictions and constraints.
[11]
For example, political instability and crime may have a multitude of underlying causes relating to ethnicity, demographic changes, and
employment opportunities, as well as factors within governments’ direct control (such as policing, political openness, and transparency).
[12]
Eritrea is excluded from this analysis due to the poor representational quality of the Business Enterprise survey.
[13]
For projects with multiple programmatic areas, we use a sector threshold of 50 percent or more of the total project value. By illustration, the
$15.4 million Burundi Emergency Energy Project focuses 54 percent of total project funds on power-related investments. As a result, the project
would be classified as an electricity sector project.
[14]
Since individual firms can cite multiple constraints as “major,” these correlations are very high.
[15]
Up until the late 1980s, IDA regularly extended loans to national development banks and other local financial intermediaries. But an
influential report by World Bank researcher Fred Levy revealed that many of these loans had poor development outcomes and that the funds often
were not reextended from development banks to local projects. In the wake of the report and its presentation to the World Bank board of
directors, the Bank heavily reduced its lending to national development banks.
[16]
Smaller correlations between business priorities and IDA-allocated funds do not necessarily imply that IDA is uninterested in finance-related
projects and/or unwilling to implement them. Other factors are involved in the project design process, including available technology or
resources or the level of expected involvement from other World Bank Group subsidiaries (for example, IFC has recently focused more of its
projects on improving access to finance).
[17]
Data for IFC investment projects are taken from its annual reports, accounting for IFC’s final commitment value. Also included are IFC B loans
(syndicated loans that are recorded as liabilities on IFC’s books.) Data on IFC advisory projects are included only for projects of more than
$2 million, as other advisory projects are not disclosed on a project-by-project basis.
[18]
IFC, like the other World Bank Group subsidiaries, continues to actively engage in postcrisis and countercyclical spending. As a result, many
of the recent IFC commitments are geared toward rehabilitating trade. These trade finance guarantees can artificially inflate the value of IFC
investments in both fragile and non-fragile states.
[19]
Also over the past decade, IFC has invested large amounts of capital in telecommunications projects in fragile states. According to our
analysis of business enterprise surveys, lack of telecommunication capacity in fragile states is not a major concern for business owners. While
IFC arguably has made a significant contribution to the telecommunications sector in several African fragile states (Burundi, Chad, and the
Democratic Republic of Congo), it is impossible to determine whether investment would have flowed into this sector regardless of IFC
involvement. The telecommunications sector accounts for some of the most profitable projects in Sub-Saharan Africa and many of the continent’s
most encouraging success stories. Further, telecommunications sectors in other fragile states (in which IFC was not involved) still saw rapid
growth.
[20]
This methodology, outlined in chapter 1 and appendix 7, considers states to be fragile if they maintain a Country Policy and Institutional
Assessment score of below 3.2 for five consecutive years leading up to (and including) the project sign date.
[21]
For this analysis, we assume that business constraints in the most fragile environments have remained relatively stable over time (for example,
electricity, transport infrastructure, and access to finance).
Table 3.3: IDA alignment with “major constraints,” by country, selected measures [CLOSE TABLE]
Electricity
Transport
Access to finance
Firms citing as major obstacle (percent)
Per capita project value ($)
Total value of all IDA projects ($ millions)
Percentage of all IDA projects (by value)
Percentage of all IDA projects (by number)
Percentage of IDA PSD projects (by value)
Firms citing as major obstacle (percent)
Per capita project value ($)
Total value of all IDA projects ($ millions)
Percentage of all IDA projects (by value)
Percentage of all IDA projects (by number)
Percentage of IDA PSD projects (by value)
Firms citing as major obstacle (percent)
Per capita project value ($)
Total value of all IDA projects ($ millions)
Percentage of all IDA projects (by value)
Percentage of all IDA projects (by number)
Percentage of IDA PSD projects (by value)
Angola
44
0.0
0
0
0
0
27
6.1
102
18
8
50
56
1.0
17
3
8
50
Burundi
77
8.8
65
7
6
22
22
9.5
70
8
6
22
56
4.6
35
4
9
33
Chad
82
5.5
55
10
5
50
46
6.7
67
12
5
50
47
0.0
0
0
0
0
Congo,Dem. Rep.
78
0.2
12
0
2
9
32
16.3
966
25
10
45
65
12.0
710
19
6
27
Congo, Rep.
74
0.0
0
0
0
0
57
17.6
60
17
11
100
46
0.0
0
0
0
0
Côte d'Ivoire
50
18.5
358
31
9
25
45
4.3
83
7
14
38
66
0.9
17
1
9
25
Guinea
84
2.0
19
4
17
80
52
3.3
30
6
4
20
61
0.0
0
0
0
0
Guinea-Bissau
76
20.4
30
20
13
100
27
0.0
0
0
0
0
76
0.0
0
0
0
0
Liberia
61
2.9
10
1
2
10
40
48.0
164
20
16
70
38
0.0
0
0
0
0
Sudan
41
0.0
0
0
0
0
22
3.5
134
19
7
38
45
1.5
58
8
7
38
Togo
54
0.3
2
0
4
33
32
0.3
2
0
4
33
51
2.0
12
3
4
33
Correlation
0.12
–0.19
0.02
0.47
0.54
0.22
–0.15
0.00
0.32
0.52
0.27
0.28
0.17
0.19
0.04
Note: All values for projects are given in terms of International Development Association’s own commitment to the project, rather than the total
project value (that is, with co-financiers, if applicable).
Source: International Development Association and authors’ calculations.
Government priorities in fragile states
This chapter examines the alignment between fragile state governments’ private sector development (PSD) priorities and World Bank Group activities over
the past decade. As illustrated by the Paris Declaration, Accra Declaration, and various other international initiatives, donor institutions have
strived to empower country ownership and improve alignment with recipient government strategies and development objectives. Against this backdrop, how
has the World Bank Group performed with respect to PSD in African fragile states?
Methodology
Overall, we categorize governments’ PSD priorities into two general areas: broader business environment constraints and cost drivers (such as
regulatory framework and infrastructure); and key business growth sectors (such as agriculture and extractive industries). To determine individual
country priorities, we draw on several types of government documents, including national development plans (Angola’s Vision 2025 plan); poverty
reduction strategy papers; economic growth strategies (the South Sudan Growth Strategy); and government budget reports.[1], [2] Given the widespread
prevalence of conflict and relative lack of national development strategies during the 1990s, we focus on the period between 2000 and 2010. Our
analysis excludes Eritrea and Zimbabwe due to the lack of either a publicly available national development strategy (Eritrea) or significant World Bank
Group activities during the examined period (Zimbabwe).[3]
In some cases, government documents delineate an explicit PSD strategy, including the top business constraints and priority growth sectors.[4] In others, it is more
difficult to ascertain the government’s strategic focus or priorities. For example, a given poverty reduction strategy paper may include an exhaustive
list of proposed PSD-related interventions covering the range of economic sectors as well as regulatory, trade, infrastructure, finance, and supply
chain issues. In these instances, we have attempted to identify priority constraints and growth sectors that appear more central to the government’s
broader strategy.[5] Despite our
best efforts, this approach is prone to measurement error given the subjective nature of our assessments. So while our analysis provides a constructive
overview of the World Bank Group’s alignment with specific government priorities, it should be considered indicative and subject to further
consideration and adjustment.[6]
Country government priorities
Not surprisingly, there is a significant amount of consistency across African fragile state governments’ priorities for addressing PSD-related
constraints (table 4.1). The most frequently cited priorities include regulatory framework (100 percent); transport infrastructure (100 percent);
electricity infrastructure (92 percent); access to finance (83 percent); and macroeconomic stability (75 percent). In addition, half the African
fragile state governments cite the improvement of security and telecommunications infrastructure as priority areas.
Table 4.1: Country PSD constraint priorities, by
frequency
PSD constraint priorities
Frequency
Countries (percent)
Firm survey results (average percent)
Regulatory framework
12
100
32
Transport
12
100
38
Electricity
11
92
68
Finance
10
83
56
Macroeconomic stability
9
75
—
Security
6
50
35
Telecom
6
50
—
Tax policy
2
17
37
Water
1
8
—
Human capital
1
8
27
Customs
1
8
28
— is not available.
Source: Various country government reports and authors’ calculations.
Government constraint priorities illustrate a somewhat mixed picture when compared with firm-level views about the most binding constraints to business
growth.[7] First, government
priorities appear well aligned with the two constraints cited most frequently by individual firms—electricity and access to finance. By contrast, two
top government objectives—improving the regulatory framework and transport infrastructure—are cited much less frequently by surveyed firms.[8] For example, every African
fragile state includes expansion or rehabilitation of transport infrastructure as a primary component of its PSD strategy.[9] But less than 40 percent of
surveyed firms cited transportation as a “major” obstacle.
Economic sector priorities
As with PSD-related constraints, African fragile state governments overwhelmingly prioritize a few economic sectors—namely, agriculture and extractive
industries (table 4.2).[10]
Only Togo has not targeted the extractive sector as a priority growth driver. Roughly one-third of fragile state governments have specifically
prioritized the industry, manufacturing, and tourism sectors. Surprisingly, only Togo has explicitly prioritized the financial sector as a strategic
driver of private sector activity and economic growth.
Table 4.2: Country economic sector priorities, by frequency
Economic sector priorities
Frequency
Countries (percent)
Agriculture
12
100.0
Extractive industries
11
91.7
Industry
5
41.7
Manufacturing
4
33.3
Tourism
4
33.3
Services
3
25.0
Retail
2
16.7
Finance/banking
1
8.3
Utilities
1
8.3
Source: Various country government reports and authors’ calculations.
World Bank Group alignment with government priorities
IDA PSD constraint alignment.
Since 2000, the International Development Association (IDA) has supported 70 PSD-related projects in our sample countries, of which 65 have been
focused on the governments’ priority constraints. In monetary terms, these priority projects account for nearly 100 percent of total PSD-related
activities. Indeed, IDA programs are entirely focused on government priorities in 10 of 12 African fragile states—that is, there is 100 percent
alignment in those 10 countries (table 4.3). The one notable outlier is the Central African Republic, which is driven by several finance and banking
projects that fall outside the scope of the government’s core priorities. Taken together, this suggests that IDA activities are very aligned with
fragile state government objectives.
Table 4.3: IDA project alignment with government priority constraints
Priority constraint projects
Total PSD projects
Country
Value ($ millions)
Projects (number)
Percentage of projects (by value)
Percentage of projects (by number)
Value ($ millions)
Projects (number)
Angola
118.6
2
100
100
118.6
2
Burundi
213.8
8
97
89
221.3
9
Central African Republic
18.5
3
50
43
37.0
7
Chad
121.8
2
100
100
121.8
2
Congo, Dem. Rep.
2,022.0
11
100
100
2,022.0
11
Congo, Rep.
60.0
2
100
100
60.0
2
Côte d'Ivoire
460.3
8
100
100
460.3
8
Guinea
49.0
5
100
100
49.0
5
Guinea-Bissau
29.9
3
100
100
29.9
3
Liberia
177.5
10
100
100
177.5
10
Sudan
209.4
8
100
100
209.4
8
Togo
15.4
3
100
100
15.4
3
Total
3,496.1
65
99
93
3,522.2
70
Source: International Development Association and authors’ calculations.
IFC PSD alignment.
The International Finance Corporation (IFC) also exhibits a decent alignment track record between its investment operations and governments’ sectoral
priorities—though much lower than IDA’s performance.[11] More than half of IFC
investments in African fragile states (by monetary value or number of transactions) since 2000 have focused on priority economic sectors or priority
constraints (table 4.4). Four telecommunications projects located in Burundi, Chad, and the Democratic Republic of Congo account for nearly all the
nonaligned IFC investments during the specified period ($265 million of $266 million). So while aggregate alignment figures illustrate a largely
positive picture, the IFC has room for improvement.
Table 4.4: IFC investments and priority sector mapping
Priority sector/constraint investments
Total PSD investments
Country
Value ($ millions)
Investments (number)
Percentage of investments (by value)
Percentage of investments (by number)
Value ($ millions)
Investments (number)
Angola
38.7
4
100
100
38.7
4
Burundi
1.6
4
6
80
26.6
5
Central African Republic
0
0
0
0
0.1
1
Chad
40.4
7
66
88
61.6
8
Congo, Dem. Rep.
53.4
11
20
85
272.4
13
Congo, Rep.
0
0
0
0
0
0
Côte d'Ivoire
1.9
2
100
100
1.9
2
Guinea
35.0
2
100
100
35.0
2
Guinea-Bissau
0
0
0
0
0.3
1
Liberia
24.4
5
100
100
24.4
5
Sudan
5.8
2
100
100
5.8
2
Togo
141.9
3
99
60
144.0
5
Total
343.1
40
56
83
610.8
48
Source: International Finance Corporation and authors’ calculations.
MIGA PSD alignment
. Since 2000, the Multilateral Investment Guarantee Agency (MIGA) has supported only 19 guarantees in African fragile states, of which slightly more
than half are aligned with the governments’ priority economic sectors (table 4.5). Put differently, MIGA has supported one aligned guarantee per
country, on average, over the last decade. In monetary terms, slightly more than 80 percent of MIGA guarantees have been aligned with government
priorities. But a small number of transactions account for the overwhelming majority of guarantees (as with IFC).[12] If compared with the total
number of guarantees in African fragile states, MIGA’s alignment with government priorities falls to less than 60 percent. Taken together, these data
suggest that the limited MIGA activities are only modestly aligned with fragile state governments’ priorities—with significant room for improvement.
Table 4.5: MIGA PSD project and priority sector mapping
Priority sector/constraint guarantees
Total PSD guarantees
Country
Value ($ millions)
Investments (number)
Percentage of guarantees (by value)
Percentage of guarantees (by number)
Value ($ millions)
Guarantees (number)
Angola
183.7
3
100
100
183.7
3
Burundi
0.0
0
0
0
0.9
1
Central African Republic
0.0
0
0
0
0.0
0
Chad
0.0
0
0
0
0.0
0
Congo, Dem. Rep.
22.9
3
39
60
59.0
5
Congo, Rep.
0.0
0
0
0
8.7
1
Côte d'Ivoire
0.0
0
0
0
0.0
0
Guinea
68.4
2
63
67
108.4
3
Guinea-Bissau
25.9
1
98
50
26.5
2
Liberia
142.2
1
98
50
145.7
2
Sudan
0.0
0
0
0
0.0
0
Togo
7.4
1
41
50
18.1
2
Total
450.5
11
82
58
551.0
19
Source: Multilateral Investment Guarantee Agency and authors’ calculations.
Conclusion
Overall, World Bank Group activities illustrate strong alignment with fragile state government priorities for addressing private sector constraints and
supporting key economic growth sectors. In monetary aggregates, more than 90 percent of World Bank projects and investments have targeted priority
areas (figure 4.1). However, as noted above, this is largely driven by IDA’s sizable project commitments (nearly 80 percent of total World Bank Group
support) and strong alignment. By contrast, IFC and MIGA have additional room for improvement. (This is discussed in greater detail in chapter 6.)
There is considerable cross-country disparity in World Bank Group alignment. For example, IDA, IFC, and MIGA support is almost universally aligned with
government priorities in Angola and Liberia. By contrast, World Bank support exhibits only low overlap in several other African fragile states, such as
the Democratic Republic of Congo. And IFC and MIGA have not completed any transactions in a few country markets, including the Central African
Republic, the Republic of Congo, and Sudan.[13] These trends emphasize the
need for the World Bank Group—including its individual subsidiary organizations—to improve alignment performance not only at the aggregate fragile
states level, but also at the individual country level.
Notes
[1]
The exact ranking of government priorities is often impossible to determine from government documents. So we have not ranked government
priorities in any particular order.
[2]
For private sector business constraint priorities, we limit the number of country priorities to six. For key business growth sectors, we limit
the number of country priorities to between three and five. For example, Burundi’s private sector business constraint country priorities (as
found in its 2010 PRSP Evaluation Report) are, in no particular order, macroeconomic stability, regulatory framework, transport, electricity,
finance, and security. Its economic sector priorities are agriculture, fishing, manufacturing, mining, and tourism. World Bank Group project
alignment with Burundi government priorities has been assessed using these priorities. We have completed similar analyses for each of the
African fragile states in our sample.
[3]
Since Zimbabwe has been in continuous arrears to the World Bank since 2000, support from IDA, IFC, and MIGA has mainly been limited to small,
grant-based technical assistance programs.
[4]
By illustration, Liberia’s Interim PRSP (pp. 43–44) clearly outlines the government’s priorities for addressing business constraints: “The
government will begin to address critical structural constraints and impediments to private investment and economic activity”, which include:
large informal sector; access to energy; access to finance; investment code; telecommunications; land ownership and tenure; tax policy; and
administrative and regulatory issues. For the purposes of this analysis, we group the latter three issues together under a broader “regulatory
framework” category.
[5]
This includes gauging how frequently specific constraints or economic sectors are referenced as well as the depth and scope of the related
proposed interventions. To the extent possible, we supplemented this assessment with an examination of government budget priorities as well as
other development strategy documents.
[6]
A more authoritative approach would include explicit input from fragile state governments concerning their priorities for addressing private
sector constraints and supporting specific economic sectors. Information sourced directly from policymakers (such as that obtained by World
Bank Group country teams) could more accurately assess government priorities.
[7]
Firm-level data are drawn from the respective World Bank Enterprise Surveys cited earlier in the report. Results are reported as a simple
average for 10 of the 12 fragile state countries (excluding the Central African Republic and Sudan due to the lack of business enterprise
survey data). For the purposes of this comparison, “regulatory framework” is measured as the simple average of five separate business
enterprise survey categories: political instability, business licensing, labor regulation, corruption, and access to land. Two constraint
categories (security and human capital) are compared with the enterprise survey categories of “crime” and “worker skills.” The “tax policy”
constraint is compared with the simple average of two enterprise survey categories (“tax rate” and “tax administration”). Finally, the business
enterprise surveys do not include response data on three of the examined categories: macroeconomic stability, telecommunications, and water.
[8]
One reason that fewer businesses cite transport infrastructure as a major constraint could be that poor roads are a greater obstacle for
exporting businesses. These businesses would have higher costs associated with shipping cargo, and therefore would consider transport to be a
more binding constraint. This is not true of all businesses that export goods, however. Regulatory constraints may be less of a concern for
many businesses because less-complex regulations could lead to increased competition—something that might be undesirable for firms that are
already in operation.
[9]
The Liberian government’s emphasis on transportation infrastructure is examined in greater detail below.
[10]
See appendix 10 for country-specific information.
[11]
Additional analysis of the overlap between IFC advisory services and governments’ priorities about private sector constraints (such as business
climate issues) would be worthwhile. But project-level data are not publicly available.
[12]
Three projects in Côte d’Ivoire, Angola, and Guinea account for more than 83 percent of all MIGA projects in our sample of 14 countries.
[13]
Several of these countries, such as Sudan, had World Bank Group arrears during this period, which explains IFC’s lack of engagement.
What works—proven PSD successes in fragile environments
This chapter examines the effectiveness of World Bank Group projects in fragile states over time. In other words, have the International Development
Association (IDA) and the International Finance Corporation (IFC) prioritized their financing and programmatic support in high-performing sectors? As
noted previously, project performance in fragile state environments has lagged significantly compared with outcomes in other low- and middle-income
countries. So it is even more important for IDA and IFC to identify the private sector development (PSD)–related sectors and subsectors with adequate
project performance, prioritize development and investment operations accordingly, and consider innovative ways to improve project outcomes in
historically low-performing areas.
IDA alignment with what works
To identify sectors with high-performing IDA projects, we use World Bank Independent Evaluation Group (IEG) project outcome ratings during the period
between 1980 and 2006. The IEG rates individual World Bank Group project outcome performance on a range between 0 and 5 (the latter being defined as a
“highly satisfactory” outcome).[1]
IEG ratings are available for more than 4,800 IDA projects completed during the examined time period.[2] We define IDA recipient
countries as “fragile” if their average Country Policy and Institutional Assessment (CPIA) score was below 3.2 during the project implementation
period. This provides for a broader country sample, important for determining what types of IDA projects have worked in fragile environments globally
and over time. As with previous analysis, we use IDA’s sectoral classifications to the extent possible to determine the priority sector or topic for
each project.[3] Under this
methodology, there are 1,924 PSD-related projects, of which 321 are in African and non-African countries defined as fragile states (table 5.1). In
addition, our dataset includes nearly 2,900 non-PSD projects (health, education), of which 533 are in African and non-African fragile states.
Table 5.1: IDA PSD-related project evaluation data, 1980–2006
Fragile states
Nonfragile states
PSD
Non-PSD
Total
PSD
Non-PSD
Total
Number of projects
321
533
854
1,603
2,360
3,963
Percentage of total projects
38
62
100
40
60
100
Total IDA commitments ($millions)
5,083
9,152
14,235
29,755
55,929
85,684
Percentage oftotal commitments
36
64
100
35
65
100
Average project value ($ millions)
15.8
17.2
16.7
18.6
23.7
21.6
Source: World Bank Independent Evaluation Group and authors’ calculations.
IDA PSD-related project performance
Overall, IDA projects in fragile states have performed at a consistently low level over time. On average, they have received an IEG project outcome
rating of 2.5, falling between “moderately unsatisfactory” and “moderately satisfactory.” But PSD-related projects in fragile states have performed at
a slightly higher level when compared with non-PSD–related projects, with an average IEG rating of 2.60 versus 2.43. The same is true for nonfragile
states as well (3.23 versus 3.16). Within PSD-related areas, extractive industry and regulatory reform projects have produced the best outcomes,
followed by infrastructure (table 5.2). Financial sector and general PSD (that is, multisector) projects have produced the lowest outcome scores on
average. Compared with nonfragile states, the largest lagging sectors are finance and infrastructure, with average IEG project outcome ratings roughly
one-third lower than in nonfragile state environments.
Table 5.2: IDA project outcome ratings by PSD-related sector, 1980–2006
Fragile states
Nonfragile states
PSD sector
Average IEG outcome rating
Number of projects
Percentage of all PSD projects
Commitments ($ million)
Average IEG outcome rating
Number of projects
Percentage of all PSD projects
Commitments ($ million)
Infrastructure
2.6
156
49
3,155
3.4
810
51
14,352
Telecommunications
3.3
14
4
172
3.6
57
4
827
Roads
2.9
79
25
1,635
3.5
336
21
7,623
Electricity
2.4
44
14
920
3.1
310
19
4,951
Railways
2.0
5
2
134
3.1
52
3
640
Ports
1.6
14
4
294
3.7
55
3
311
Regulatory
2.7
45
14
714
3.2
229
14
6,706
Legal system
3.6
5
2
21
2.9
16
1
115
General industry
3.5
6
2
80
3.6
20
1
449
Trade
2.8
6
2
11
3.3
48
3
1,243
Economic management
2.5
19
6
312
3.2
45
3
1,957
Financial sector
2.0
9
3
290
3.1
100
6
2,943
Finance 2.2
26
8
254
3.0
177
11
3,222
Agriculture
2.4
13
4
131
3.0
80
5
1,489
Banking
1.7
3
1
21
3.2
19
1
275
Micro, small, and medium enterprise
1.9
8
2
52
2.9
77
5
1,447
Extractive
3.0
48
15
340
3.3
161
10
1,365
Oil and gas
3.2
37
12
283
3.4
111
7
1,028
Mining
2.3
11
3
58
3.0
50
3
337
General PSD
2.2
46
14
620
2.9
226
14
4,111
Total
2.6
321
100
5,083
3.2
1,603
100
29,755
Note: Several sectors have very low project counts, which can skew their average ratings. Further, the averages here do not capture the
country-specific information contained in the project evaluations. When making project decisions in fragile states, the World Bank should
consider both fragile states aggregates and country-specific evaluations.
Source: World Bank Independent Evaluation Group and authors’ calculations.
There is a wide distribution of IEG project outcome ratings within sectors and subsectors. In simple terms, IDA projects in fragile states are not
universally poor-performing (“unsatisfactory”). Instead, roughly the same share of projects have either “unsatisfactory” or “satisfactory” outcome
ratings (36 percent and 45 percent, respectively; figure 5.1).[4] Despite relatively low average
outcome ratings overall, at least half of IDA projects had “satisfactory” outcomes in the following subsectors: telecommunications, roads, general
industry regulatory reform, trade policy reform, agricultural financing, and oil and gas (see appendix 11 for details).
Over time, IDA’s prioritization of higher performing PSD sectors has been mixed. Figure 5.2 maps the percentage of IDA projects targeting PSD-related
subsectors against the average IEG outcome rating for that sector. On the positive side, IDA appears to have deprioritized those subsectors with very
low project outcome ratings (ports, banking, railways). At the same time, IDA has pursued a relatively modest number of projects in higher performing
areas, such as industry regulation reform, telecommunications, and trade policy reform. Importantly, this analysis does not control for several
potentially influential issues, such as client government demand, intertemporal differences in project performance regional factors, and determinants
of project outcomes. We explore the latter issue in some detail below, though not exhaustively. Even so, it does provide some indication of IDA’s
portfolio performance management over time.
IDA’s current alignment with what works
On the basis of historical IEG project outcome ratings, how much is IDA currently focusing on fairly strong performing PSD-related areas in
African fragile states? As with other areas, the answer is mixed and somewhat complex. As figure 5.3 illustrates, there is almost no correlation
between IDA sector prioritization (measured relative to the total PSD commitments or number of projects) and project outcome ratings.[5] Overall, roughly 84 percent of
IDA’s PSD portfolio in African fragile states lies in subsectors with “moderately unsatisfactory” project outcomes between 1980 and 2006. By contrast,
only 1 percent of IDA’s existing PSD-related portfolio is targeting subsectors with “moderately satisfactory” project outcomes. This tentative result
appears to be driven by two factors: IDA’s heavy relative focus on the slightly lower performing road and electricity subsectors; [6] and IDA’s modest (or
nonexistent) focus on relatively well-performing subsectors, such as general industry reform.
But this does not necessarily mean that IDA’s projects have a poor alignment with PSD subsectors with strong, proven results. As noted above, more than
half of road projects in fragile state environments have provided “satisfactory” outcomes—despite the subsector’s overall average rating of “moderately
unsatisfactory.” This illustrates the imperative to focus also on the micro, macro, and operational factors that influence project outcomes, explored
extensively in the literature. Several studies find that operational factors—such as project preparation, quality-at-entry, and project
supervision—have significant explanatory power in determining project outcome ratings.[7] By illustration, electricity
projects in fragile states with strong quality-at-entry ratings had “satisfactory” outcome ratings nearly 80 percent of the time.[8] So it is theoretically
possible that IDA’s existing PSD-related portfolio may be well aligned with what works in a broader context. This assumes that IDA has only pursued
projects after strong preparatory work and favorable initial conditions, and subsequently has taken steps to ensure strong supervision over time.
Additional regression analysis by the World Bank Group and other researchers examining the empirical impact of these factors in fragile states would be
a constructive contribution.
IFC alignment with what works
The IFC evaluates its investment projects using two core metrics: development outcome performance and financial performance. This section outlines the
criteria for each metric and determines whether IFC is committing its resources and projects toward relatively well-performing sectors.
Development outcome performance
The IFC uses its Development Outcome Tracking System (DOTS) to determine the development effectiveness and reach of its projects. According to IFC, the
DOTS tracks four performance benchmarks:
Financial performance.
Financial returns in excess of a project’s weighted average cost of capital.
Economic performance.
“Economic rate of return” in excess of 10 percent (for example, benefits beyond those generated to project financiers).
Environmental and social performance.
Conformity to IFC’s environmental and social performance standards, which include measures of pollution prevention and abatement, community health
and safety, and land acquisition and involuntary resettlement procedures.[9]
Private sector development impact.
Improvement of the general private sector environment, which often is measured by the number of follow-up investments by other in-sector private
companies.
The IFC also uses additional, specific development effectiveness subcriteria, such as the number of jobs created, increase in sales volume, reduction
in emissions, and return on equity.
Currently, the IFC does not make its project-by-project evaluation data available publicly, which prevents us from analyzing IFC alignment in fragile
states in a targeted manner. In light of the World Bank Group’s Open Data Initiative, steps should be taken immediately to post this IFC information on
its website in a user-friendly format.[10] Even so, the IFC’s Annual
Portfolio Performance Review provides regional and sector breakdowns of development effectiveness outcomes. According to sectorwide DOTS evaluations,
health and education projects have the highest development outcome ratings. Oil, gas, and mining projects also receive consistently high DOTS ratings.
Global manufacturing projects have the lowest percentage of highly rated projects. However, when weighted according to project commitment values (as
opposed to the number of projects), most projects in each sector receive high DOTS ratings with little discrepancy between sectors (figure 5.4). Since
these results reflect projects aggregated across all regions, income levels, and CPIA ratings, they provide limited value and insights for African and
non-African fragile states.
Financial performance
The IFC also uses project profitability to gauge operational performance. The IFC’s principal measures of financial performance include loan income,
loan returns, and equity returns.[11] Table 5.3 illustrates how
financial performance fluctuates widely across sectors and fiscal years. For example, financial services accounted for 70 percent of total IFC equity
income in fiscal year (FY) 2009 compared with only 17 percent in FY10. Conversely, oil, gas, and mining projects had an equity return of 13 percent in
FY09 and a 291 percent return in FY10—which illustrates how a few large IFC investments can drive respective sectors’ financial performance. Since
these results reflect projects aggregated across all regions, income levels, and CPIA ratings, they provide limited value and insights for African and
non-African fragile states.
Table 5.3: IFC loan and equity portfolio income, 2009–10
Loans
Equity
Total
Loan income
Percentage of total loan income
Loan return (percent)
Equity income
Percentage of total equity income
Equity return (percent)
Total return (percent)
Sector
FY09
FY10
FY09
FY10
FY09
FY10
FY09
FY10
FY09
FY10
FY09
FY10
FY09
FY10
Agriculture
33
39
2.9
3.6
0.4
6.8
–9
22
–0.9
1.2
–27.0
12.1
–6.1
8.7
Chemicals
37
44
3.3
4.0
0.9
6.4
26
74
2.6
4.0
–22.5
39.7
–3.4
12.3
Collective investment vehicles
1
3
0.1
0.3
25.3
9.4
–49
196
–4.8
10.7
–13.7
23.5
–12.8
24.4
Financial services
496
412
43.7
37.5
6.3
6.2
708
311
69.8
16.9
6.0
8.7
6.2
6.8
Industrial and consumer services
55
43
4.9
3.9
1.2
2.7
3
–1
0.3
–0.1
–24.4
–14.1
–2.8
0.4
Infrastructure
202
274
17.8
25.0
3.0
5.0
198
199
19.5
10.8
14.1
30.9
4.6
8.2
Manufacturing
205
175
18.1
15.9
2.2
4.0
56
77
5.5
4.2
0.0
16.5
2.0
5.2
Oil, gas, and mining
90
77
7.9
7.0
5.6
3.5
81
946
8.0
51.4
–12.6
291.4
1.6
53.9
Social services
15
30
1.3
2.7
6.8
10.7
1
17
0.1
0.9
–10.5
6.8
0.2
8.9
Total IFC
1,134
1,098
100.0
100.0
4.1
5.2
1,015
1,840
100.0
100.0
–1.1
32.2
3.1
10.9
Source: International Finance Corporation.
Financial performance versus annual disbursements
To determine whether IFC is committing its entire investment portfolio toward relatively high-performing sectors, we compare IFC annual disbursements
with the financial performance metrics presented above. Figure 5.5 shows the strong relationship between these two indicators in IFC’s equity and loan
portfolios. This indicates that IFC effectively aligns its investment in each sector according to that sector’s expected annual financial returns.
Again, since these results reflect projects aggregated across all regions, income levels, and CPIA ratings, they provide limited value for our
exercise. With the availability of project-level performance data, additional targeted analysis should be pursued for IFC activities in African fragile
states.
Notes
[1]
The range of the IEG rating scores is as follows: (0) highly unsatisfactory; (1) unsatisfactory; (2) moderately unsatisfactory; (3) moderately
satisfactory; (4) satisfactory; and (5) highly satisfactory.
[2]
Due to the extended time period, these IEG ratings include countries that subsequently graduated from IDA assistance, such as Ecuador, Egypt,
and Thailand—the only condition being that the average CPIA of the country over the life of the project was below the 3.2 threshold.
[3]
PSD-related categories include: infrastructure (telecommunications, transport, electricity); regulatory (legal system, trade policy, economic
management, financial sector, and general industry-related policies); finance (agriculture, banking, and micro, small, and medium enterprise);
extractive sector (oil and gas, mining); and general PSD projects. For projects with multiple programmatic areas, we utilize a sector threshold
of 50 percent or more of the total project value. See appendix 9 for additional details on our project reclassification methodology.
[4]
Despite its sliding scale, we find that the IEG rates a significant percentage of IDA project outcomes on a binary basis. Nearly 80 percent of
IDA’s PSD-related projects in fragile states are rated as either “unsatisfactory” or “satisfactory.” And IDA projects in non-fragile states
exhibit a similar tendency, with more than 70 percent of projects rated as having either “unsatisfactory” or “satisfactory” outcomes.
[5]
The availability of natural resources can constrain IDA’s ability to implement projects in certain sectors, such as oil, gas, and mining. For
instance, IDA cannot implement oil and gas projects in Côte d’Ivoire, despite the subsector’s relative historical success in fragile states.
[6]
These two subsectors account for roughly 60 percent of IDA’s PSD projects in African fragile states.
[7]
The World Bank’s own internal evaluation group has completed robust regression analyses that show the strong correlations between these
operational factors and overall project outcomes. For more information, see IEG (2011).
[8]
Of the 14 electricity projects in fragile states with a quality-at-entry score of 3 (out of a range between 0 and 3), 11 projects had
“satisfactory” outcome ratings. Appendix 12 contains correlation analysis of PSD-related project outcome ratings in African and non-African
fragile states between 1980 and 2006 with several operational performance factors, including project duration (number of years), project
preparation, quality-at-entry, supervision, compliance, and implementation.
[11]
Another core measurement of financial performance is IFC’s internal rate of return (IRR). IRR is a measure of an investment’s financial
performance over the entire holding period. The IRR takes into account both the amount and timing of disbursements and cash receipts. In the
case of an outstanding equity investment, an estimated valuation of the investment is included as an element in calculating the IRR.
Country case study—South Sudan
This chapter applies the proposed private sector development (PSD) guiding framework to the specific case study of South Sudan. First, it examines the
private sector profile and major business constraints. Next, it outlines the guiding priorities of the government of South Sudan. Then it gauges how
well donor institutions’ PSD-related projects are aligned to what matters in South Sudan and what has worked well over time.
Contextual overview
In July 2011, the Republic of South Sudan became the world’s newest nation. When Sudan’s destructive two-decades-long civil war ended in 2005, South
Sudan was left with almost no physical or institutional infrastructure. Since then, substantial rebuilding and rehabilitation of destroyed or damaged
structures has taken place. National, state, and local governments have been established along with the passage of a broad range of new legislation.
Modern banking services have been introduced, and courts, schools, and health clinics across the region have been established.
Despite this significant progress, the new nation still faces monumental challenges in fostering broad-based private sector growth and economic
opportunities for its people. Among the major economic challenges facing South Sudan: weak or nonexistent physical infrastructure (especially power and
transport); inadequate access to and cost of finance; dependence on subsistence agriculture; a poor business regulatory climate; and the overwhelming
dominance of the oil sector for national output, exports, and government revenues. At the same time, the nation is endowed with significant natural
resources beyond oil, such as timber, gold, and plentiful water for agriculture. Moreover, South Sudan will undoubtedly receive strong support from
bilateral donors and international financial institutions, which have already initiated comprehensive economic and social support programs.
Private sector overview
Despite significant challenges, the private sector in South Sudan has expanded rapidly over recent years, shown by the registration of more than 6,000
new firms since 2005.[1] Despite
the strong new business growth, the private sector in South Sudan remains constrained and is dominated by micro and small firms in the retail sector.
As of 2010, roughly 93 percent of registered firms had fewer than six employees (table 6.1). By extension, there is a nearly complete lack of medium or
large firms, with only 20 firms having 50 or more employees.
Table 6.1: Private enterprises in South Sudan, by number and distribution of employees
Number of employees
Number of firms
Percentage of firms
Sector
Number of firms
Percentage of firms
1
2,892
39.4
Wholesale and retail trade
5,116
69.8
2
2,490
34.0
Hospitality (lodging/food service)
1,037
14.1
3
864
11.8
Health and social services
361
4.9
4
341
4.7
Manufacturing
199
2.7
5
213
2.9
Information and communication
97
1.3
6–9
273
3.7
Construction
89
1.2
10–49
240
3.3
Other
434
5.9
50+
20
0.3
Total
7,333
100.0
Total
7,333
100.0
Source: SSCCSE (2010).
As noted previously, private enterprises are heavily concentrated in the wholesale and retail trade sector, accounting for 70 percent of registered
firms (see table 6.1). Another 14 percent of firms operate in hospitality-related sectors, such as lodging and food service. Less than 5 percent of
registered South Sudanese firms are in industry-related sectors, such as manufacturing, construction, or mining. In geographical terms, nearly
two-thirds of private enterprises are located in South Sudan’s three largest cities (Juba, Malakal, and Wau). Even in these urban areas, business
density remains very low, whether measured in per capita or per household terms. For example, there are only 0.014 businesses per household in Juba and
0.006 in Malakal.
Given the business profile in South Sudan, the government and its donor supporters face a dual challenge of both creating enabling conditions for
micro-entrepreneurs to grow and simultaneously preparing the environment for the establishment of larger, formal sectors such as food processing,
mining, or light manufacturing.[2] In this context, the
government must take concerted steps to reduce operating costs and associated investment risks through an improved policy framework, infrastructure
network (such as reliable electricity and transport), supply chains, access to finance, and technical and managerial skills. The next section examines
these constraints in greater detail.
Major business constraints
Our business constraint analysis draws upon several recent private sector diagnostics and surveys, including the Sudan Investment Climate Assessment,
the Juba Doing Business report, and the 2009 Population and Household Survey. The World Bank’s Investment Climate Assessment is based upon firm-level
surveys in the manufacturing, services, and informal sectors. While the survey was conducted nationally, information was collected in Juba and Malakal.
The Doing Business report, produced in partnership by the World Bank and the U.S. Agency for International Development (USAID), examines the business
environment for a typical manufacturing firm in Juba. Based upon these sources, the largest obstacles to private sector activity in South Sudan concern
access to electricity, access to and cost of finance, transportation, corruption, and customs.
Reliable electricity
Reliable access to electricity is the most commonly cited business obstacle in South Sudan. In Juba, 87 percent of the business survey respondents
cited electricity as the most significant constraint on their operations. This proportion reaches 100 percent for manufacturing firms located in
Malakal. Electricity delivery has improved recently in Juba following the installation of oil-fueled generators. But two power stations (of three) are
out of service, contributing to frequent power cuts.[3]
Most businesses in South Sudan own or share generators due to the lack of reliable power generation. These generators account for a significant share
of their businesses energy consumption—83 percent of firms based in Juba rely upon generator power, which accounts for 93 percent of their energy
consumption. Not surprisingly, generator-based electricity significantly increases businesses’ operating costs—both through fairly expensive fuel
imports and inconsistent supply. Spending capital on purchasing and operating generators often directly reduces firms’ resources for investing in fixed
assets and other productivity-enhancing factors. This undermines the ability of South Sudanese firms to compete in both regional and global markets.
However, according to the World Bank’s Investment Climate Assessment survey, companies with generators do experience fewer production interruptions and
lower associated output losses.
Access to finance
The second most frequently cited business obstacle in South Sudan is access to and cost of finance. Roughly 75 percent of firms located in Juba cited
these issues as “major” to “severe” constraints on their ability to operate and expand. Most available financial products relate to foreign exchange
transactions, bank transfers, and remittance services—with only a handful of commercial banks providing more traditional services such as loans, trade
finance, and savings accounts. Almost all bank lending is short-term, with relatively high interest rates (15–20 percent).[4] According to the Bank of
South Sudan, commercial bank exposure totaled only SDG 139 million (roughly $60 million) as of 2009 (table 6.2). This exposure is highly concentrated
in retail trade and service companies (60 percent) because of their ability to generate short-term cash flow and capture government procurement and
guarantees. Only a quarter of existing commercial bank exposure is targeted toward industry-related sectors such as manufacturing, construction, and
transport. Not surprisingly, constrained access to operating capital has contributed to the underuse of capacity in the manufacturing sector.
Table 6.2: Commercial bank exposure, by sector (SDG millions)
2007
2008
2009
Sector
SDG
$ equivalent
Percentage of total
SDG
$ equivalent
Percentage of total
SDG
$ equivalent
Percentage of total
Agriculture
0
0
0
19.3
9.2
16.2
28.0
12.2
20.1
Industry
28.0
13.6
58.3
34.5
16.4
29.0
37.0
16.1
26.6
Manufacturing
0
0
0
0
0
0
0
0
0
Mining
0
0
0
0
0
0
0
0
0
Construction
28.0
13.6
58.3
19.4
9.2
16.3
22.0
9.6
15.8
Transport
0
0
0
15.1
7.2
12.7
15.0
6.5
10.8
Storage
0
0
0
0
0
0
0
0
0
Imports
0
0
0
0.6
0.3
0.5
2.0
0.9
1.4
Exports
0
0
0
0.0
0.0
0.0
0
0
0
Local trade
6.0
2.9
12.5
57.6
27.4
48.4
66.0
28.7
47.5
Other
14.0
6.8
29.2
7.0
3.3
5.9
6.0
2.6
4.3
Total
48.0
23.3
100
119.0
56.7
100
139.0
60.4
100
Note: U.S. dollar equivalent figures are based on annual exchange rate averages of 2.06 for 2007, 2.1 for 2009, and 2.3 for 2009.
Source: Bank of South Sudan.
This trend extends to the household level as well. Due to various factors, South Sudan remains heavily underbanked.[5] Only 1 percent of South
Sudanese households had a bank account as of 2010. And only 18 percent of households borrowed or obtained money that must be repaid (table 6.3).
Table 6.3: Use of banking services among households, by state (percent)
Banking service use
Borrowing prevalence
State
Has an account
No account
Borrowed/obtained
Not borrowed/obtained
Upper Nile
2
98
33
67
Jonglei
0
100
19
81
Unity
1
99
31
69
Warrap
0
100
9
91
Northern Bahr El Ghazal
1
99
14
86
Western Bahr El Ghazal
3
97
18
82
Lakes
2
98
11
89
Western Equatoria
1
99
19
81
Central Equatoria
4
96
18
82
Eastern Equatoria
1
99
15
85
Total
1
99
18
82
Note: Borrowing prevalence indicates the borrowing rate from both banks and nonbank lending institutions. Therefore, lending prevalence greatly exceeds banking penetration.
Source: Bank of South Sudan and SSCCSE (2009).
The exit of several Islamic banks in February 2008—following the Bank of South Sudan ruling that all financial intermediation must be implemented on
conventional terms—sharpened households’ lack of access to finance. Border states such as Northern Bahr El Ghazal and Warrap were impacted the most by
this exit (table 6.4). However, several banks from neighboring countries (Ethiopia and Kenya) have been issued operating licenses in recent years, expanding
rapidly. Despite this, competition in the banking sector remains limited, with correspondingly high margins and service concentration in the larger
urban areas.
Table 6.4: Distribution of commercial banking services, by state (number of branches) [CLICK TO VIEW]
In addition to commercial banks, many microfinance institutions operate in South Sudan. But they currently service less than 1 percent of the potential
market in South Sudan and only 5 percent of available clients in the greater Juba region, offering a limited range of products.[6] As of 2010, microfinance
institutions had not started addressing the rural and agricultural sectors effectively—where most households derive their primary source of income.[7] Lending rates are comparable
with those of other developing countries, ranging between 15 percent and 35 percent.[8]
Banking sector growth and coverage going forward, for both commercial and microfinance institutions, will depend on strengthening land registry
systems,[9] improving legal and
enforcement mechanisms, enhancing bank management capacity (risk management, corporate governance), and reducing high transaction costs driven in part
by poor infrastructure (electricity, telecommunications, transport).
Transport infrastructure
As with electricity and financing, the lack of transport infrastructure acts as a binding constraint to almost all productive sectors in South Sudan.
There are approximately 4,100 kilometers of year-round gravel trunk roads and almost no rehabilitated feeder road network (see additional details
below).[10] The government
budget allocated little funding to upgrade and maintain these trunk roads, raising serious concerns about their sustainability over the medium to long
term.[11] The only rail line in
South Sudan connects Wau (Western Bahr el Ghazal state) to Muglad (West Kordofan state) in northern Sudan. Plans to extend the rail network to Juba
have not been realized to date—nor are there any rail linkages to neighboring countries.[12]
Since South Sudan imports the most product inputs from neighboring countries or from northern states, the lack of adequate road and rail networks has
the greatest relative impact in regions located far from international borders. This is particularly problematic in such states as Upper Nile, Lakes,
Warrap, and Western Equatoria. As a result, input and product costs are substantially higher than in southern cities—such as Juba—which are closer to
the borders with Kenya and Uganda (table 6.5). While transport requirements and costs may be lower in southern areas, they still remain extremely high
relative to those in neighboring countries.
Table 6.5: Price comparison of select intermediate inputs, Malakal and other cities
Product input
Price in Malakal (SDG)
Comparator city
Comparator city price (SDG)
Price differential (percent)
Iron sheet (per sheet)
30
Kosti
20
33
Water pipe (per ton)
910
Kosti
790
13
Tire (per piece; Yokohama)
600
Juba (imports from Uganda)
300
50
Sand (per bag)
2,000
Rumbek
90
96
Source: World Bank (2009).
Corruption
Corruption is yet another leading constraint to PSD in South Sudan. The weak legal framework and relatively poor administrative capacity of the
government has contributed to this problem. Overall, research suggests that corruption can severely distort competition and impose high direct costs on
firms in developing countries, particularly among small and medium enterprises.[13] Given that South Sudan is
dominated by micro and small enterprises, the potential negative impact may be substantial. But corruption appears to be a larger concern in certain
regions (Juba) and among informal firms—for example, 74 percent of surveyed firms in Juba cited it as a major constraint, while only 60 percent did in
Malakal.
Trading across borders
As South Sudan is a landlocked country, the time and cost of trading across borders has been a major negative driver of its firms’ operating costs and
international competitiveness. Indeed, there are only Afghanistan and the Central African Republic score worse on the Doing Business rankings.[14] While poor transport
infrastructure is the largest cost driver (as discussed earlier), firms also face an extremely burdensome customs process and multiple checkpoints that
add significant time delays.[15] On average, firms located
in Juba spend 34 days to obtain 11 documents required for importing, and 28 days for the 9 documents required for exporting (table 6.6).[16] According to the World
Bank, the main cause of document delays is the letter of credit requirement, which must be approved by the Bank of South Sudan.[17] And it costs firms in
Khartoum or Kampala roughly $2,900 to import products, or roughly 30 percent of the costs faced by South Sudanese firms.
Table 6.6: Time and cost to import a container, Juba and comparator cities
Time (days)
Cost ($)
Importation step
Juba
Kampala
Khartoum
Juba
Kampala
Khartoum
Document preparation
34
10
24
525
350
750
Port and terminal handling (Mombasa)
6
5
11
390
150
350
Customs clearance
3
6
7
430
390
300
Inland transportation
17
13
4
8,075
2,050
1,500
Total
60
34
46
9,420
2,940
2,900
Source: World Bank.
Government priorities
According to the South Sudan Growth Strategy, the government is pursuing a broad-based approach for reducing the country’s “absolute dependence” on oil
and establishing a diversified, inclusive, and sustainable economy.[18] A central component of the
Growth Strategy is adopting policies designed to stimulate growth in low-skill, labor-intensive sectors.
Business constraints
. For business environment constraints, the government has prioritized improvements in five key areas: transport infrastructure, rule of law,
taxation policies, access to finance, and macroeconomic stability.[19]
Economic sector priorities.
For economic sectors, the government has heavily prioritized agriculture given the country’s plentiful arable land and rainfall endowments as well
as the overwhelming percentage of the national labor force engaged in agriculture. To increase agricultural productivity and market opportunities,
the government has pursued a three-track approach: increasing information dissemination (capacity-building), distributing inputs (seeds,
fertilizer, irrigation), and supporting market integration and access through physical infrastructure improvements (feeder roads). The government
also recognizes the growth potential within the services and light manufacturing sectors, but it plans to support them as secondary priorities.
Existing donor programs
As of 2010, donors’ private sector–related project portfolio totaled almost $730 million (table 6.7).[20] Actual donor expenditures
totaled roughly $212 million for PSD in 2009, or roughly a quarter of total outlays for all donor projects. Slightly more than half of this
total was allocated to the construction of roads throughout South Sudan. Agriculture programs—dominated by capacity-building and distribution of inputs
(for example, seeds)—are the second-largest sector by project portfolio (roughly $196 million).
Table 6.7: Donor funding for private sector–related projects, 2010
Sector
Number of projects
Project portfolio ($ millions)
Average project size ($ millions)
Percentage of total
Agriculture
28
195.9
7.0
27
Infrastructure
11
386.5
35.1
53
Electricity
1
13.2
13.2
2
Transport
10
373.3
37.3
51
Regulatory
15
134.9
89.9
18
Economic policy and financial management
7
41.3
5.9
6
Labor
2
29.4
14.7
4
Legal system
6
30.3
5.0
4
Finance
1
12.6
12.6
2
Total
55
729.9
13.3
100
Source: Government of South Sudan (2010b) and authors’ calculations.
Donor alignment with business constraints
Overall, donor programs are not aligned with many of South Sudan’s greatest business environment obstacles—particularly electricity and access to
finance (figure 6.1). Despite these being the two largest business constraints, donors supported only one electricity project and one
microfinance-related program as of 2010.[21] Taken together, these two
projects total less than 4 percent of all private sector–related projects ($26 million of roughly $730 million; see table 6.7).[22] Going forward, donor
funding for power generation and banking programs could have a significant positive impact on business activity in South Sudan. However, donor programs
are focusing on several important private sector obstacles, such as transport infrastructure and economic and regulatory institutions. As noted
previously, the expansion of South Sudan’s nearly nonexistent road network is one positive area of donor engagement.
Ideally, donor institutions would take a division-of-labor approach both among themselves and with the recipient country government. But that does not
appear to be the case in South Sudan for the aforementioned neglected constraints to private sector growth. Between 2006 and 2010, the government
directed only 1 percent of its total budget expenditures toward expanding access to reliable electricity.[23] By contrast, it provided
roughly 8.4 percent of budget expenditures for transport construction and rehabilitation (SDG 1.8 billion). Put differently, both the government and
donor institutions are crowding into several important sectors while almost completely ignoring several major constraints to more urban-based business
activity.
Donor alignment with government priorities
In contrast to business constraints, donors are very well aligned with the South Sudanese government’s priorities. Overall, roughly 90 percent of
PSD-related projects are focused on the government’s priority business constraints and economic sector (agriculture). The alignment ratio rises to 95
percent if measured as a percentage of total PSD-related project commitments (table 6.8). The one outlier is the nearly complete lack of donor
assistance to improve access to financing. As noted previously, donors have supported only one microfinance project in South Sudan. This suggests that
donors should explore ways of helping South Sudanese farmers and business owners to better access affordable expansion and operating capital.
Table 6.8: Donor alignment with government priorities
Donor alignment
Priority PSD projects
Business constraints
Percentage of all projects (by value)
Percentage of all projects (by number)
Total value ($ millions)
Number of projects
Business constraints
63
44
457.5
24
Transport
51
18
373.3
10
Rule of law
4
11
30.3
6
Economic policy management
6
13
41.3
7
Access to finance
2
2
12.6
1
Agriculture
27
51
195.9
28
Total
90
95
653.3
52
Source: Government of South Sudan and authors’ calculations.
Donor alignment with what works
Next, we examine donor alignment with PSD-related sectors and subsectors that exhibited higher project outcome ratings in African and non-African
fragile states over time.[24]
Given the impracticality of gauging historical project performance across the 15 different donor organizations with active PSD-related programs in
South Sudan, we use the World Bank’s Independent Evaluation Group project outcome rating figures as a proxy (see chapter 5). As figure 6.2 illustrates,
existing donor projects exhibit mixed alignment results with higher performing PSD-related sectors. Except for two regulatory subsectors (legal system
reform and labor policy), the percentage of donor projects targeting specific PSD-related areas is higher in subsectors with better average project
outcome ratings. But donors’ heavy focus on road transport and agriculture sectors—accounting for 80 percent of all PSD-related projects—may be
considered excessive based solely on their historical outcome performance in fragile state environments.
Conclusion
Overall, donors exhibit strong alignment with one of the proposed guiding PSD framework pillars (government priorities) and modest alignment with what
has worked in other fragile state environments over time. Alignment with firm views about major constraints is mixed at best—stemming largely from the
disconnect between what South Sudanese firms and the government believe are the most pressing PSD constraints. This apparent conflict illustrates the
operational and strategic complexities of balancing rural development–based growth strategies with the needs and priorities of largely urban firms that
are represented in World Bank Enterprise Surveys. The World Bank Group can respond to this phenomenon by better reflecting the views of rural
businesses (including smallholder farmers) in their survey diagnostics, particularly for African countries with sizable employment shares in the
agriculture sector.
Regardless of this issue, there is a clear need for donors to give greater priority to PSD-related programs to improve access to and cost of finance,
for both South Sudanese farmers and other economic sectors. But with finance projects’ poor performance in fragile states over time, careful
consideration should be given to ensuring an improved track record in South Sudan. Moreover, donors should give additional consideration to whether a
heavier emphasis on electricity infrastructure would be justified, both in the context of addressing firms’ views and of broader economic and social
development imperatives.
[5]
The most commonly cited factor is South Sudan’s long civil war, which devastated formal institutions, market linkages, and traditional
relationships in the private sector. Other related factors include: limited bank presence and competition, extensive usage of barter-based
trading (low money usage), weak or nonexistent credit bureaus, and lack of borrower collateral. Several of these issues are examined in
subsequent sections.
[7]
Nearly 80 percent of South Sudanese households rely on crop farming and animal husbandry for their main source of income. SSCCSE, 2010 Statistical Update, p. 45.
[8]
Ibid. By comparison, microfinance institution lending rates average roughly 30 percent in Kenya.
[9]
The Land Act of 2009 permits land title holders to use their title as collateral for loans and financial institutions to foreclose on the
associated land title in the event of default. But poor institutional capacity and systems for land registry has continued to deter
collateralized lending. In February 2010, the South Sudan Land Commission announced a new five-year strategic plan to address many of these
deficiencies, such as improving land mapping, survey activities, and computerization of the land registry.
[10]
Between 2004 and 2010, the World Food Programme (WFP), USAID, Ministry of Transport and Roads, and other donor organizations constructed these
4,100 kilometers of trunk roads (2,600 by WFP and 1,500 by the ministry). In March 2011, the WFP announced an $80 million program to construct
approximately 500 kilometers of feeder roads, which will link existing trunk roads and improve access to food assistance beneficiaries and
agricultural production areas (WFP 2011).
[11]
For example, operating expenses (including road maintenance) accounted for only 1.3 percent of the Ministry of Transport and Roads budget in
2010. See Government of South Sudan (2010a).
[12]
As of 2010, Reuters reported that plans to build a “Sudan East Africa Railway” through Juba and into Uganda were still in the discussion phase
(Reuters 2010).
[17]
This is required every time a firm imports or exports products and involves the submission of six separate documents to the Bank of South
Sudan. On average, this step takes more than 20 days to complete.
[20]
Additional donor programs have been initiated or proposed since the publication of the Government of South Sudan’s Donor Book 2010. For
example, the IFC proposed a modest new program in early 2011 focused on generating at least 15 new high-quality investments in non-oil sectors,
especially agribusiness; increasing new business registrations from 8,000 to 13,000; decentralizing the business registration to locations in
at least three states; and using alternative dispute resolution in at least 200 business disputes. For more information, see www.ifc.org for
all available project documents.
[21]
USAID’s Sudan Infrastructure Services Project (Electrification Program)will provide $13 million to support the construction of
electricity infrastructure in Kapoeta and Maridi and the training of Electricity Corporation personnel. The 894-kilowatt power plant was
inaugurated in February 2011. See Ruati (2011). USAID’s Generating Economic Development through Microfinance in Southern Sudan will provide
$12.6 million to improve microfinance institution’s managerial capacity and to provide loan capital for the expansion of microfinance
facilities and geographic coverage. See Government of South Sudan (2010b).
[22]
Of course, donor projects across sectors will vary in terms of size and cost. As such, relative funding volume is an imperfect measure for
comparing donor priorities.
[23]
Government of South Sudan (2010b) and authors’ calculations.
[24]
As in chapter 5, this analysis is based on average IEG project outcome ratings by sector and subsector.
Table 6.4: Distribution of commercial banking services, by state (number of branches) [CLOSE TABLE]
Bank of South Sudan
Nile Commercial
Ivory Bank
Buffalo Commercial
Agricultural Bank
Kenya Commercial
Equity Bank
Commercial Bank of Ethiopia
Total
Δ
State
2010
2008
2010
2008
2010
2008
2010
2008
2010
2008
2010
2008
2010
2008
2010
2008
2010
Upper Nile
1
3
2
2
2
2
2
—
7
7
0
Jonglei
1
1
1
—
1
2
1
Unity
1
1
1
1
—
1
3
2
Warrap
1
—
1
0
–1
Northern Bahr El Ghazal
1
1
1
1
1
—
3
2
–1
Western Bahr El Ghazal
1
2
1
1
1
1
1
1
—
4
5
1
Lakes
1
1
1
1
—
2
2
0
Western Equatoria
1
1
1
—
1
2
1
Central Equatoria
2
4
3
2
2
2
1
1
1
4
1
1
—
3
9
18
9
Eastern Equatoria
1
1
—
1
1
0
Total
4
16
12
6
7
0
3
5
4
2
8
1
1
0
3
30
42
12
# of ATMs
10
1
11
—
Conclusion
The World Bank Group and other development institutions have committed to further prioritize programmatic operations in fragile states. The strategic
imperative for this focus is particularly warranted given the projected IDA graduation by more than half of its existing client countries by 2025. And
the World Bank Group’s existing efforts to devise a new Group-wide strategy for fragile states present an opportune time to reexamine one key aspect of
its operations—promoting private sector development. This report examines three key private sector–related factors in African fragile states: what
businesses cite as the most binding constraints to private sector growth; what government priorities are for business climate improvements or strategic
economic sectors; and what types of projects have been more effective over time. Subsequently, we assess the alignment of World Bank Group operations
within these three areas over the past decade. Overall, we find that project alignment varies widely across the World Bank Group’s three largest
subsidiaries—the International Development Association (IDA), International Finance Corporation (IFC), and Multilateral Investment Guarantee Agency
(MIGA).
IDA exhibits very strong alignment with government priorities and reasonably good prioritization in sectors with higher project outcome
ratings.
But it has a more mixed performance with respect to focusing on what businesses cite as the most binding private sector–related constraints. IDA
has pursued comparatively few projects focusing on the most binding constraints, such as electricity and access to finance.
By contrast, IFC and MIGA projects are only modestly aligned with the private sector’s most binding constraints or fragile state government
priorities.
Instead, projects have been heavily concentrated in low-risk sectors, such as the extractive sector. Taken together, IFC activities over time
suggest that the organization lacks a comprehensive, systematic strategy in African fragile states[1]
Moving forward
Despite several bright spots, our analysis suggests that strategic changes in the World Bank Group’s operations are needed—particularly for IFC and
MIGA. Given this, we propose a new methodology by which they could prioritize and structure assistance and investment programs in fragile states. Our
conceptual model brings together three simple, yet fundamental, components for policy design—what is needed, what is wanted, and what works.
What is needed
. To generate growth, policymakers must create a conducive environment for business owners and managers of small, medium, and large firms.
Understanding the business community’s concrete and most binding constraints is the crucial first step toward good policy design.
What is wanted.
Policymakers in fragile states operate in very difficult environments. Understanding their perspective and private sector objectives is important,
especially for policymakers in multilateral institutions.
What works
. We must use the lessons learned from past projects and policy interventions. Understanding what has worked in very difficult environments will be
useful to the design of new policies, programs, and projects—particularly when these findings are referenced against public and private sector
constraints and priorities.
When viewed together, these three analytical components can help the World Bank Group and other development organizations prioritize private
sector–related programs in fragile states. Ideally, donor institutions would pursue projects in sectors or areas where all three components intersect
(what the private sector needs, what the government wants, and what donors do effectively). But there will be situations or environments in which
multilateral organizations may wish to pursue projects or investments that do not meet this condition.
The challenge will be ensuring flexible operational and institutional structures to implement these objectives. Broadly speaking, three main areas need
to be addressed: improving managerial capacity to enable a bolder approach to fragile states; significantly changing human resources strategies to
attract and retain staff who are willing to take risks and understand the conditions of operating in fragile states; and improving the incentives of
existing staff so that they are more willing to take on riskier projects. Each of these areas is enormously challenging, but must receive concerted
efforts in order for a fragile states–specific agenda to be implemented.
Note
[1]
As chapter 5 notes, evaluation results vary widely by country and sector. IDA, IFC, and MIGA might consider country priorities, business
constraints, and evaluation results on a country-level basis. Further, evaluation results by sector might be considered in relative terms compared with other sectors. For example, if single country evaluation results are low across the board (as, for
example, in the Democratic Republic of Congo), road projects with an average score of just 2.5 might be prioritized over oil, gas, and mining
projects, which have an average score of 1.5.
AfDB (African Development Bank).
2009. FAPA Annual Report 2008–2009. Tunis.
———.
2011. Infrastructure and Growth in Zimbabwe: An Action Plan for Sustained Strong Economic Growth. Tunis.
AllAfrica.
2009. “Desperate Water Shortage in Somaliland.” August 4. http://allafrica.com/stories/200908040796.html.
Atil, Melody.
2009. Expanding the Provision and Impact of Microfinance in Southern Sudan. Washington, DC: World Bank.
Bradbury, Mark.
2008. Becoming Somaliland. Bloomington, IN: Indiana University Press.
Commander and Nikoloski.
2010.
Commission on Growth and Development.
2008. The Growth Report: Strategies for Sustained Growth and Inclusive Development. Washington, DC: World Bank.
Confederation of Zimbabwe Industries.
2010. “Manufacturing Survey 2010.” Harare.
DfID (U.K. Department for International Development).
2010. Multilateral Aid Review 2010: International Finance Corporation. London.
Economic Intelligence Unit.
2010. “Risk Briefing Zimbabwe.” Accessed from EIU Online Database of Country Risk Briefings, December 1, 2010.
The Economist.
1999. “Somaliland: A Nomad’s Life Is Hard.” August 5. www.economist.com/node/230314.
———.
2001. “The Nation Nobody Knows.” 2001. April 12. www.economist.com/node/569115.
Emerson, Patrick M.
2006. “Corruption, Competition and Democracy.” Journal of Development Economics 81 (1): 193–212.
Eubank, Nicholas.
2010. “Peace-Building without External Assistance: Lessons from Somaliland.” CGD Working Papers 198, Center for Global Development, Washington,
DC.
———. Forthcoming. “Taxation, Political Accountability, and Foreign Aid: Lessons from Somaliland.”
Journal of Development Studies
.
Everest-Phillips, Max.
2008. “Business Tax as State-Building in Developing Countries: Applying Governance Principles in Private Sector Development.” International Journal of Regulation and Governance 8 (2): 123–154.
Forni, Mario, and Sergio Paba.
2002. “Spillovers and the Growth of Local Industries.” Journal of Industrial Economics 50 (2): 151–171.
Gelb, Alan.
2010 “How Can Donors Create Incentives for Results and Flexibility for Fragile States? A Proposal for IDA.” CGD Working Paper 227, Center for
Global Development, Washington, DC.
Gelb, Alan, and Gene Tidrick.
2000. “Growth and Job Creation in Africa.” In Economic Policy in Labor Surplus Economies —Strategies for Growth and Job Creation in Southern Africa. Report on the Proceedings of a
Southern African Conference, Gaborone, May 3–5.
Government of South Sudan.
2010a. Approved Budget 2010. Juba.
———.
2010b. Donor Book 2010. Juba. www.goss-online.org/magnoliaPublic/en/ministries/Finance/ mainColumnParagraphs/0/content_files/file7/2010%20
Donor%20Book_FINAL.pdf.
———.
2010c. “The Opportunities and Challenges of Delivering Rapid and Inclusive Growth in Southern Sudan.” Juba.
Harris, Geoff T.
1999. Recovery from Armed Conflict in Developing Countries. London and New York: Routledge.
Heritage Foundation.
2011. 2011 Index of Economic Freedom. Washington, DC and New York: Heritage Foundation and Dow Jones & Company.
International Crisis Group.
2003. Somaliland: Democratisation and Its Discontents. Nairobi/Brussels. www.crisisgroup.org/
en/regions/africa/horn-of-africa/somalia/066-somaliland -democratisation-and-its-discontents.aspx
IEG (Independent Evaluation Group).
2011. “Appendix D: Determinants of Project Performance.” In Evaluative Lessons from World Bank Group Experience: Growth and Productivity in Agriculture and Agribusiness, 126–141. Washington, DC:
World Bank. http://siteresources.worldbank.org/ INTGPAA/Resources/AppendixD.pdf.
IFC (International Finance Corporation).
2010a. DfID Multilateral Aid Review 2010. Washington, DC.
ILO (International Labour Organization).
2011. Global Employment Trends 2011. Geneva: International Labour Office.
Imara Africa Securities.
2010. “2nd Annual Imara Zimbabwe Investor Conference Post Conference Insights.” June 21, Harare.
IMF (International Monetary Fund).
2007. “Liberia: Interim Poverty Reduction Strategy Paper.” IMF Country Report 07/60, Washington, DC.
———.
2010. “Zimbabwe: 2010 Article IV Consultation.” IMF Country Report 10/186, Washington, DC.
JSL Times.
2011. “Somaliland—Interest Free but Not yet Shari’ah-Compliant Economy.” July 6. www.jsltimes.com/somaliland
-interest-free-but-not-yet-shari%E2%80%99ah-compliant-economy.
Kurokawa, Kiyoto, Fletcher Tembo, and Dirk Willem te Velde.
2008. “Donor Support to Private Sector Development in Sub-Saharan Africa: Understanding the Japanese Ovop Programme.” ODI Working Paper 290,
Overseas Development Institute, London.
Makochekanwa, Albert, and Marko Kwaramba. “Dwindling Access to Basic Services in Zimbabwe.” Prepared for Center for Global Development’s
Fragile States
book.
McKinsey & Company.
2010. McKinsey on Africa: A Continent on the Move. London.
McKinsey Global Institute.
2010. Lions on the Move: The Progress and Potential of African Economies. London: McKinsey & Company.
Moss, Todd, and Benjamin Leo.
2011. “IDA at 65: Heading Toward Retirement or a Fragile Lease on Life?” CGD Working Paper 246, Center for Global Development, Washington, DC.
Moss, Todd, and Stewart Patrick.
2005. “The Day After Comrade Bob: Applying Post-Conflict Reconstruction Lessons to Zimbabwe.” CGD Working Paper 72, Center for Global Development,
Washington, DC.
Perry, Guillermo.
2011. Growing Business or Development Priority? Multilateral Development Banks’ Direct Support to Private Firms. Washington, DC: Center for
Global Development.
Ramachandran, Vijaya, and Manju Kedia Shah. “Business Environment Constraints to Private Sector Development in Africa: Evidence from
Enterprise Surveys.”
African Development Report 2011
. Tunis: African Development Bank.
Ramachandran, Vijaya, Alan Gelb, and Manju Kedia Shah.
2009. Africa’s Private Sector: What’s Wrong with the Business Environment and What to Do About It. Washington, DC: Center for Global
Development.
Republic of Zimbabwe.
2011. “Zimbabwe Medium Term Plan, 2011–2015.” Harare. www.agbiz.co.za/LinkClick.aspx? fileticket=GbVmM2kyaeg%3D&tabid=337.
Reuters.
2010. “New Railway Links North and South Sudan.” March 12. http://af.reuters.com/article/topNews/ idAFJOE62B01Y20100312.
Ruati, Richard.
2011. “USAID inaugurates power plant in Kapoeta,
E. Equatoria.” Sudan Tribune, February 4. www.sudantribune.com/USAID-inaugurates-power-plant-in,37878.
SSCCSE (Southern Sudan Centre for Census, Statistics and Evaluation).
2009. National Baseline Household Survey 2009. Juba.
———.
2010. Statistical Yearbook for Southern Sudan 2010. Juba.
Somaliland Ministry of Planning and Coordination.
2010. Somaliland in Figures. Hargeisa. http://somalilandlaw.com/ Somaliland_in_Figures_20010.pdf.
Timmer, Peter.
2006. “How Countries Get Rich.” CGD Brief, February, Center for Global Development, Washington, DC.
UN-HABITAT (United Nations Human Settlements Programme).
2008. “Berbera: First Steps towards Strategic Urban Planning.” Nairobi. www.somalilandlaw.com/Berbera_ Urban_Planning.pdf.
WFP (World Food Programme).
2011. Feeder Road Construction in Support of WFP Operations in Southern Sudan. Rome.
World Bank.
2009. Sudan—The Road Towards Sustainable and Broad-Based Growth. Washington, DC.
———.
2010a. Doing Business in Zimbabwe 2011. Washington, DC.
———.
2010b. Investing Across Borders. Washington, DC.
———.
2010c. “Open Data Measures Progress.” April 22. http:// data.worldbank.org/news/open-data-measures-progress.
World Bank Group Development Committee.
2011. “Operationalizing the 2011 World Development Report: Conflict, Security, and Development.” Washington, DC.