Recommended

WORKING PAPERS
Blog Post
Researchers: Mauricio Romero, Justin Sandefur, Wayne Aaron Sandholtz
Country: Liberia
Sample: 3,499 students in 185 schools
The results presented here are an early analysis of the PSL program’s first-year data and represent our best effort given the limited timeframe in which policy decisions are being made. An academic advisory committee of experienced researchers has provided feedback, but these results are preliminary and have not yet been extensively peer-reviewed.
After one year, public schools managed by private operators raised student learning by 60 percent compared to standard public schools. But costs were high, performance varied across operators, and contracts authorized the largest operator to push excess pupils and under-performing teachers into other government schools.
“Partnership Schools” are free, public schools managed by private operators
- Liberia’s education system lags behind most of the world in both access and quality. Net primary enrollment was only 38 percent in 2015, and in 2013, among adult women who finished elementary school, only 25 percent could read a complete sentence.[1]
- Under the new Partnership Schools for Liberia (PSL) program, the Government of Liberia delegated management of 93 public schools to eight operators: BRAC, Bridge International Academies, Youth Movement for Collective Action,[2] More than Me, Omega Schools, Rising Academies, Stella Maris, and Street Child.
- PSL schools remained public schools: teachers in PSL schools remained on government payroll; schools remained property of the government and free to students; and contractors were prohibited from screening students based on ability or other characteristics.
- In addition to new management, the PSL program also brought extra resources. The government runs ordinary public schools on a budget of approximately $50 (USD) per pupil, ranking 145th among 161 countries for which recent World Bank data is available. PSL operators received an additional $50 per pupil from a pool of philanthropic funds managed by Ark, an education charity; the total of $100 was deemed a realistic medium-term goal for public expenditure on primary education nationwide (and would represent a jump to 134th place). While teachers are in short supply in Liberia’s public schools, the Ministry of Education made special staffing arrangements for PSL, providing more than two additional teachers per school.[3]
- The evaluation randomly assigned existing government schools to become PSL schools. Liberia’s Ministry of Education commissioned a rigorous, independent evaluation of PSL’s effectiveness. Because assignment of schools to the PSL or comparison groups was random, differences between the two groups can be attributed to the program. Schools were randomized after operators agreed on a school list, and students in the sample were selected from the enrollment logs of the school year before operators arrived. Therefore the results are not biased by operators selecting schools or rejecting students.
On average, partnership schools improved teaching and increased learning by the equivalent of about 0.6 extra years of school
- Students in partnership schools scored 0.18 standard deviations higher in English and 0.18 standard deviations higher in mathematics compared to students in regular public schools. This is the equivalent of 0.56 extra years of schooling for English and 0.66 extra years of schooling for math.
- The program increased teachers’ quality of instruction. Teachers in PSL schools were 20 percentage points more likely to be in school during a random spot check (from a base of 40 percent in comparison schools) and 16 percentage points more likely to be engaged in instruction during class time (from a base of 32 percent in comparison schools).
- Students in partnership schools spent roughly twice as long learning each week, when taking into account reduced absenteeism, increased time on task, and longer school days in PSL schools.
- Parents and students in PSL schools were happier with their schools. Students in PSL schools were more likely to think that school is fun, and parents were more likely to be satisfied with the education that their children were receiving.
Figure 1: PSL increased learning by 60 percent [5], [6]
Costs were high, in terms of government staffing and private subsidies
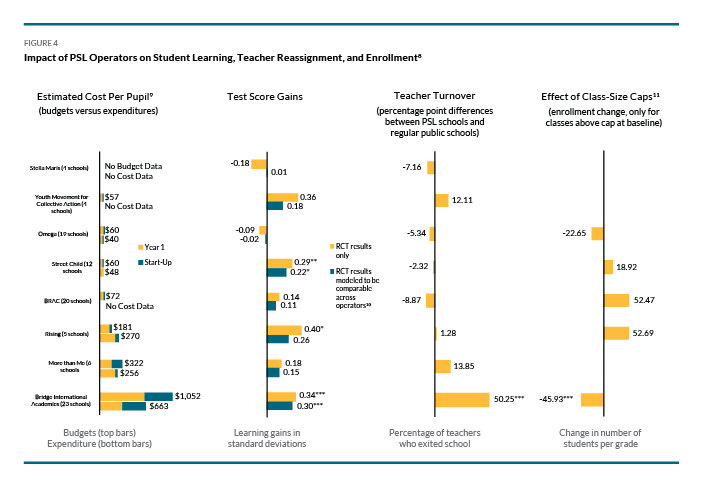
- Budget estimates for some operators were high in the first year, even after allowing for start-up costs. These planned budget estimates include fixed costs, implying that unit costs may fall if the program expands. Costs beyond the $50 subsidy were borne by operators or their donors. Year 1 estimates ranged from a low of approximately $57 per pupil for the Youth Movement for Collective Action to a high of approximately $1,052 per pupil for Bridge International Academies, on top of the Ministry’s normal expenditure of around $50 per pupil.[4] While learning gains varied widely across operators, higher learning gains do not necessarily correlate with higher budgets (see Figure 4).
- The government assigned 37 percent more teachers to PSL schools than non-PSL schools, including first pick of better-trained, new graduates. This cost was borne by the Ministry, not Ark or the operators. In the short term, the staffing advantages given to PSL appear unsustainable at a larger scale unless there is a significant increase in the supply of trained teachers.
Figure 2: PSL increased the likelihood of students and teachers…[6]
Contracts authorized the largest operator to push excess pupils and under-performing teachers into other government schools
- Overall, enrollment levels did not change. But there are signs that some children were turned away from their school when PSL arrived. PSL contracts made provisions for operators to cap class sizes.[7] Most students were in classes that started below PSL’s class-size caps before the program arrived, and these classes saw increases in enrollment and student retention. But about 30% of students were in classes above PSL’s caps, and in those cases enrollment fell by 20 students per grade (see Figure 3), and student retention dropped by 13 percentage points. Most of these students were absorbed by nearby traditional public schools. These declines were mostly restricted to Bridge International Academies.
- The same operator also dismissed half of existing public teachers in its schools. In theory, these teachers are still paid by the government, and may be working in other public schools or collecting pay without working. Although weeding out bad teachers is important, a reshuffling of teachers is unlikely to raise average performance in the system as a whole.
Figure 3: The effect of class-size caps on enrollment[8]
Conclusions
- There is solid evidence of positive effects for Liberian children during the first year of PSL. Students at PSL schools learned more, received more instruction, and were happier at school than students at traditional public schools. Teachers in PSL schools were more likely to be at school, on-task, and engaged in instruction.
- But the program has yet to demonstrate it can work in average Liberian schools, with sustainable budgets and staffing levels, and without negative side-effects on other schools. In the first year, the program was implemented (and evaluated) within a list of eligible schools agreed by operators, which were better staffed, had better infrastructure, and were closer to roads than average Liberian schools.
- Clear, uniform procurement rules might better align operators’ incentives with the public interest. Six of the eight operators were contracted through an open, competitive bidding process. One operator (Stella Maris) didn’t complete contracting, did little work, and produced low learning gains. Another (Bridge International Academies) was selected outside the competitive process, produced strong learning gains, but removed the majority of teachers and displaced some students. Revised contracts and competitive selection of operators based on performance, broadly defined, might mitigate these issues.
- Future research could explore how the program can be improved before further expansion. The remaining two years of the three-year pilot provide an opportunity to test refinements to the program rules, while simultaneously building up the government’s capacity to hold operators accountable and bringing down costs.
[1] The World Bank. “School enrollment, primary (% net),” World Development Indicators, accessed August 28, http://data.worldbank.org/indicator/SE.PRM.NENR?locations=LR.
Liberia Institute of Statistics and Geo-Information Services. Liberia demographic and health survey 2013. Liberia Institute of Statistics and Geo-Information Services.
[2] Formerly “The Liberian Youth Network.”
[3] Because they were not subject to the same contracts, neither Bridge International Academies nor Stella Maris received the extra $50 per pupil.
[4] Several caveats apply to the cost data used. At the time of writing, the most comparable cost estimates we have across operators, in a uniform template, are their original budgets, rather than actual expenditures. Five operators also submitted additional (self-reported) data to the evaluation team on actual expenditures, in various formats. More Than Me reports total expenditure per child in the first year was $255.55 (recurring: $220.55, start up cost: $34.95); Bridge International Academies reports total expenditure per child in the first year was $662.74 (recurring: $321.15, start up cost: $341.59); Street Child reports a total expenditure per child in the first year of $48.48; Omega reports total expenditure per child in the first year was $39.75 (recurring: $39.10, start up cost: $0.65); and Rising Academies reports total expenditure per child in the first year was $270 (recurring: $229.50, start up cost: $40.50).
[5] In Figure 1, the blue bar represents the average difference in test scores from one grade to the next in comparison schools. The green bar also includes the impact of the program.
[6] All results in Figures 1 & 2 are p < 0.01. Small p values indicate statistical significance: that the observed effect of PSL is not likely to have occurred by chance.
[7] For Bridge International Academies, the cap was 45-55 students per class; for all other operators, the cap was 65 students per class.
[8] *= p < 0.10, ** = p < 0.05, and *** = p < 0.01. Small p values indicate statistical significance: that the observed effect of PSL is not likely to have occurred by chance. Statisticians generally agree that p values less than 0.05 indicate a true effect size different from zero.
[9] Operators reported their original (pre-spending) per-pupil budgets (top bars). Five operators also submitted additional (self-reported) data to the evaluation team on actual expenditures, in various formats (bottom bars). These costs reflect both costs that operators say are startup costs and the operators’ year 1 costs. See Footnote 4 on page 2 of this brief, regarding several caveats that apply to the budget and cost data used in this figure.
[10] These treatment estimates adjust for baseline differences in schools. The estimates also include a Bayesian adjustment, which averages the overall effect and the operator’s individual effect, weighted according to the operator’s number of schools.
[11] Some operators had no schools with baseline class sizes above the class caps.
Rights & Permissions
You may use and disseminate CGD’s publications under these conditions.


