The Commitment to Development Index ranks 27 of the world’s richest countries on their policies that affect more than five billion people living in poorer nations. Moving beyond comparing how much foreign aid each country gives, the CDI quantifies a range of rich-country policies that affect poor people:

- Quantity and quality of foreign aid
- Openness to trade
- Policies that encourage investment and financial transparency
- Openness to migration
- Environmental policies
- Promoting international security
- Support for technology creation and transfer
The Index gives credit for generous and high-quality aid, incentives for foreign direct investment and financial transparency, open immigration policies, robust support for technological research and development, and contributions to global security and the environment. Scores are reduced for barriers to imports from developing countries, selling arms to poor and undemocratic nations, barriers to sharing technology, and policies that harm shared environmental resources.
The Bottom Line
For the third year in a row, Denmark tops the Commitment to Development Index in 2014. Denmark is also the only country which is at or above the average on all seven components. The runners up are Sweden, Finland, the United Kingdom, and Norway. These five countries do well on the index because of their consistently high performance across all policies.
Denmark tops the Commitment to Development Index for the 3rd year, scoring at or above average on all components
Among the G-7 countries—those that matter most by dint of their economic power—only the United Kingdom places in the top 5. France ranks 9th with average performance across the components, and Germany follows in 12th place, ranking below average on finance and security. The United States is above average in trade, but below average in every other component. Japan and South Korea languish at the bottom of the table, with small aid programs for their sizes, tight borders to the entry of goods and people, and limited involvement in peacekeeping. They are joined near the bottom by Switzerland which ranks last on finance and second last on trade. The Visegrád Group of countries (Czech Republic, Hungary, Poland and Slovakia) rank at or below average in most components but their rapid progress in reducing carbon emissions is recognized in the environment dimension.
Why does the CDI matter?
Why does the CDI matter? Because in an integrated world, the behavior of rich countries and powerful institutions can profoundly affect the lives of people in poor countries. The policies encouraged by the CDI benefit the populations of all countries—for example, by protecting the global commons, encouraging more trade and investment and increasing global security. They also benefit wealthy countries indirectly, because poverty and weak institutions in developing countries can breed public health crises, security threats, and economic crises that know no borders.
The behavior of rich countries and powerful institutions can profoundly affect the lives of people in poor countries
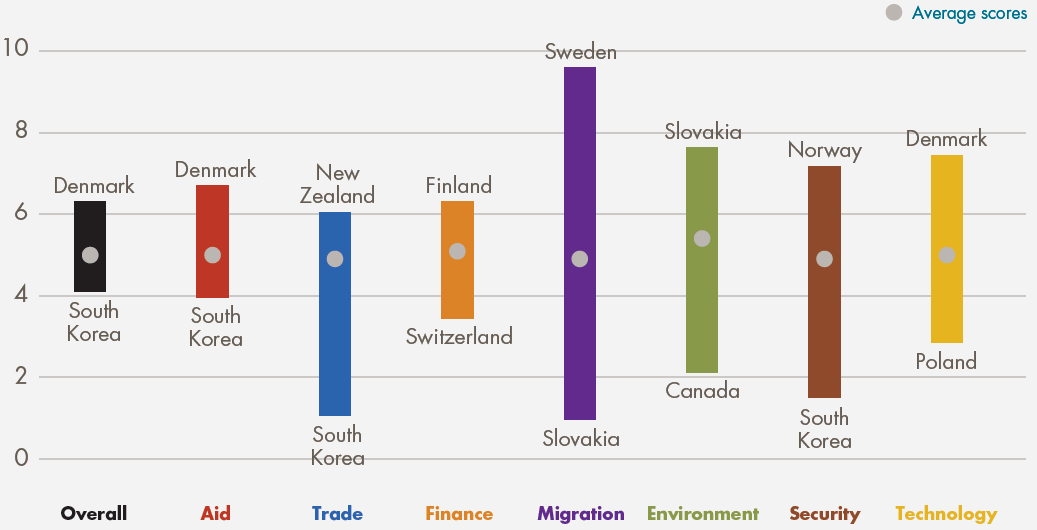
Best and Worst Performers
In 2014 Denmark has the best overall score because of very good and consistent performance across the components. Denmark also ranks first on aid and technology. South Korea has the worst overall score, despite its top score on technology, with last-place finishes on aid, trade, and security. Denmark ranks best on aid because it provides 0.83 percent of its GDP in foreign assistance and its aid is also of a very high quality.
South Korea ranks worst because it has a small aid budget relative to its economy and relatively poor-quality aid relative to the rest of the CDI countries. New Zealand performs best on trade, imposing among the lowest tariffs on developing countries’ imports and few legal restrictions on purchasing services from other countries. Last ranked South Korea imposes some of the highest tariffs and imposes vast legal restrictions on services from elsewhere. Finland does best on finance because of very good financial transparency and support to investment in developing countries. Switzerland comes last, mainly because it lacks financial transparency and does not have a national agency to offer political risk insurance.
All countries perform poorly on one or more indicators and could do much more to spread prosperity.
Sweden takes first place on migration, accepting the most migrants for its size and bearing a large share of refugee burden, unlike the last-ranked Slovakia which is relatively closed to migrants from developing countries. Slovakia is in first place on environment because of high gasoline taxes and low greenhouse gas emissions. Canada is not party to the Kyoto Protocol and has high fossil-fuel production, high greenhouse gas emissions, and low gas taxes, putting it at the bottom. South Korea finishes at the bottom also on security because contributes relatively little to international peacekeeping, does not publish arms exports data, and has not ratified major international security treaties. Top-ranked Norway is rewarded for its high contribution to peacekeeping, minimal arms exports, and participation in security treaties.
By providing high levels of government support to research and development Denmark ranks top also on technology, whereas Poland ranks last, spending only 0.35 percent of GDP on R&D (as opposed to Denmark’s 1.05 percent). All countries perform poorly on one or more indicators and could do much more to spread prosperity.
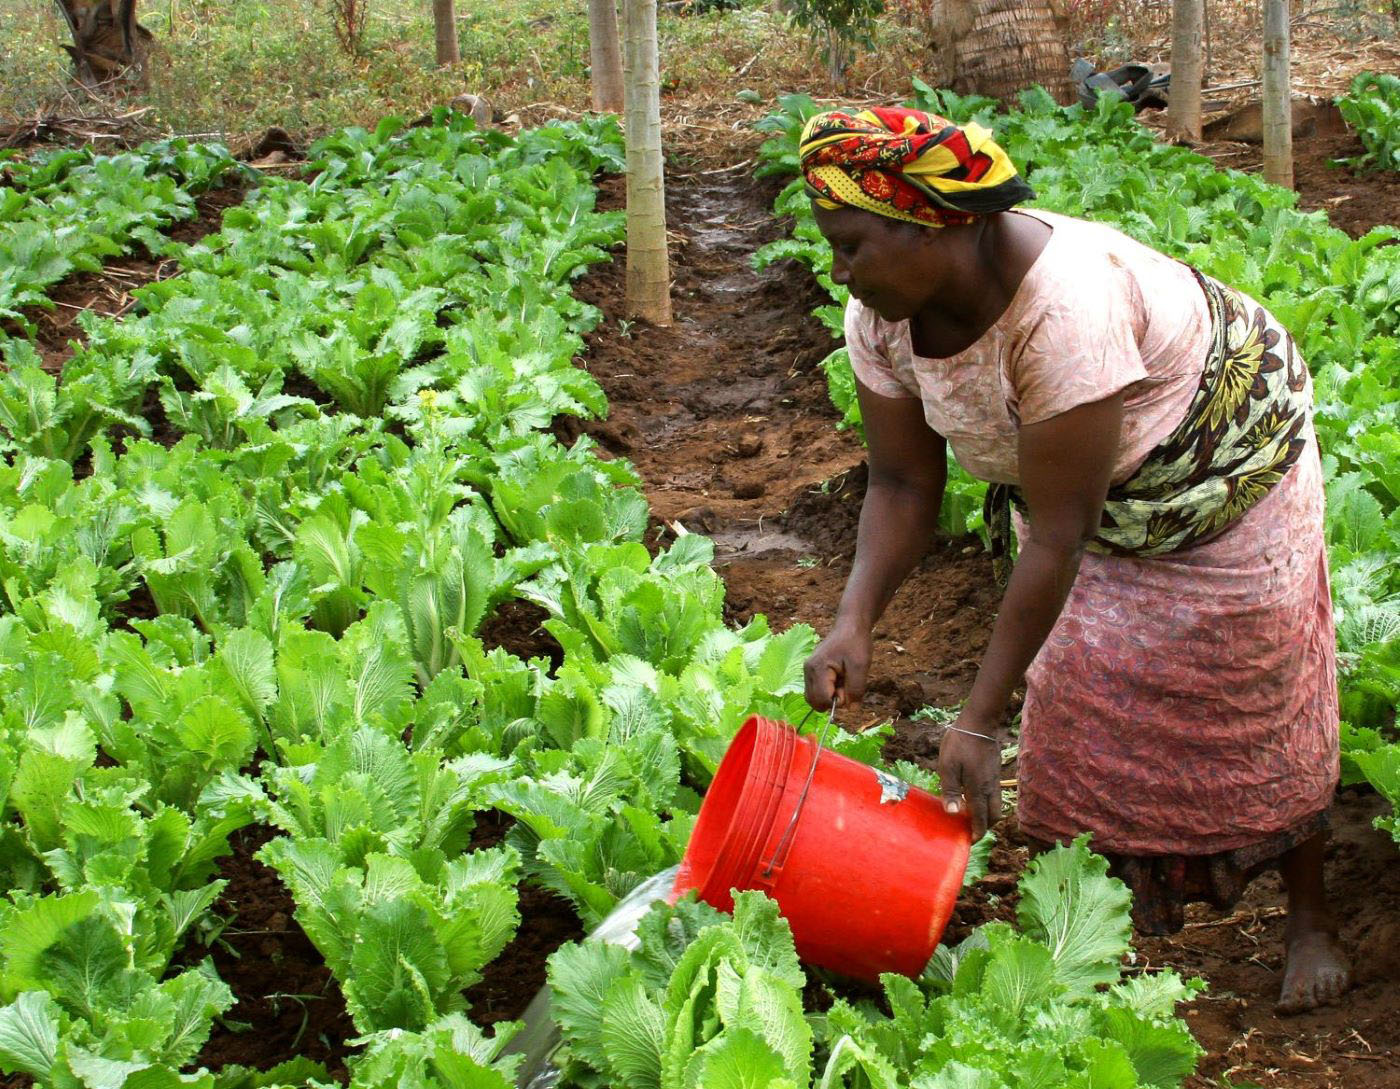
Aid
It’s important how much aid countries give, but how well they give it matters too.
Foreign aid is the first policy that comes to mind when people in rich countries think of helping poorer countries, and despite the importance of “beyond aid” policies, development assistance remains an important source of finance for many of the poorest countries. Most comparisons between donors are based only on how much aid each gives: in the CDI, quantity is only half of the picture, because quality is also taken into account. The CDI uses the Quality of Official Development Assistance (QuODA) to assess the quality of donor’s aid programs. QuODA offers a comprehensive assessment of each donor’s development assistance by analyzing 31 indicators focusing on development impact, fostering institutions, reducing burden, and promoting transparency. The aid quality score for each country reflects the quality of its bilateral aid institutions, and the quality of the multilateral institutions through which it spends its aid.
Luxembourg takes first place on aid quantity expressed as a share of gross national income (GNI). In 2012 Luxembourg allocated 1 percent of its GNI to development assistance, Sweden and Norway closely followed with 0.97 and 0.93 percent respectively. Although the United States was the largest donor in absolute terms, allocating $US 30.7 billion for aid, this represents only 0.19 percent of the US national income. Compared to other CDI countries, Poland and Slovakia were the least generous aid donors, contributing only 0.09 percent of their gross national incomes. For aid quality, Ireland ranks top, followed by , Denmark and United Kingdom. Luxembourg drops to seventh place on the index overall because of the poor quality of its aid, despite having the highest aid volume. Ireland has the best bilateral program, whereas according to the QuODA measures, Canada channels its multilateral assistance through the most effective multilateral agencies. Italy and Belgium have the poorest quality of their bilateral aid, while New Zealand and Greece tend to channel aid through lower quality multilateral agencies. Denmark ranks best on aid because it consistently performs above average in aid quality, as well as being relatively generous. On the opposite end of the ranking is South Korea, which contributed only 0.14 percent of GNI to ODA and scores relatively poorly on aid quality.
Trade
The system of rules that shape world trade has developed since World War II through a series of major international negotiating “rounds.” Because rich countries call most of the shots in this intensely political process, some goods that poor countries are best at producing—including crops—still face high trade barriers in rich countries. When rich countries tax food imports and subsidize their own farmers’ production, they cause overproduction and dumping on world markets, which lowers world prices and hurts poor-country farmers. Industrial tariffs also tend to hurt the poor, with low rates for raw commodities and high rates for labor-intensive, processed goods. Because the ability to sell in rich-country markets is crucial for developing countries, the CDI trade component ranks wealthy countries according to how open they are to imports from developing countries. It also tracks the degree to which countries have streamlined their importation processes to reduce delays and red tape and whether or not they have legal restrictions on purchasing services from foreigners.
Rich countries call the shots in trade negotiations; some poor countries lose out.
New Zealand and Australia take the top places on trade because they impose the lowest tariffs on imports from developing countries, followed closely by the United States. In general, EU nations share common trade and agriculture policies and therefore score similarly on trade. Netherlands ranks top in the Service Trade Restrictions Index, whereas Poland has the most restrictions on purchasing foreign services. Denmark and the United States require the least documentation to import goods, while imports to France require the least amount of time and imports to Finland have the lowest costs. On the opposite end is the Czech Republic which requires the most documents and time (along with Australia, Hungary, and Slovakia). Although Japan and South Korea limit subsidies to their farmers, they maintain the highest tariff rates on rice, and Korea imposes by far the highest tariffs on grains, seeds, and nuts. These trade barriers are the reason that that these two countries finish last on trade, followed closely by Norway and Switzerland, which have high tariffs on meat, dairy products, and grains.
Finance
Foreign investment can drive growth and jobs in poor countries but also instability, corruption, and exploitation.
Foreign investment can be a significant driver of growth and jobs in poor countries. It can also lead to instability, corruption, and exploitation. The CDI gives credit to investment-promotion policies that are good for development. For example, do governments offer insurance against political risks to encourage domestic companies to invest abroad? Do they support international efforts to ensure transparency in extractive industries? While some rich-country policies may encourage positive foreign investment, others may facilitate illicit activities in developing countries, including corruption, tax evasion, and trafficking in guns, drugs, and people. Using data from the Financial Secrecy Index (FSI), the CDI recognizes countries that have regulations in place to promote transparency in financial transactions within their jurisdiction.
Finland, the United Kingdom, and Sweden lead the finance component because of their transparent financial sectors, support to investment in developing countries, and membership in the Extractive Industries Transparency Initiative (EITI). Switzerland places at the bottom as one of only three CDI countries without a national agency to offer political risk insurance (Ireland and New Zealand are the others). Switzerland also lacks regulations to promote financial transparency of companies and banks, as does Luxembourg, which has a poor financial transparency record and does little to identify investment opportunities in developing countries. Although Canada ranks at the top in support for investment, its relative lack of financial transparency brings down its overall score. Ireland and Greece are the poorest performers in investment support because they restrict pension-fund investments in developing countries, but they rank relatively well in financial transparency. Among the Visegrád countries, which do the least to stem bribery and corrupt investment practices, Poland stands out with its much better FSI ranking.
Migration
About 200 million people around the world—1 in 33—do not live in the country where they were born. Workers who have migrated from poor to rich countries send billions of dollars back to their families each year, a flow that surpasses foreign aid. Some immigrants from developing countries, especially students, acquire new knowledge and skills and bring them home—engineers and physicians as well as entrepreneurs who, for example, start computer businesses. But what about “brain drain”? Emigration has been blamed for emptying African clinics of nurses, who can earn far more in London or New York hospitals. But careful studies find no evidence that these skilled people hurt their home country by leaving it. African clinics and hospitals have bigger problems than a lack of personnel, and personnel shortages themselves result from many forces—such as low pay and poor working conditions—untouched by international migration policies. The CDI rewards countries for accepting migrants from developing countries, for openness to students from poor countries, and for sharing the burden of refugees and asylum seekers.
Migrants from poor to rich countries send billions back to their families each year, a flow surpassing foreign aid.
Sweden takes first place, mainly for bearing the largest share of refugee burden; Norway follows in second place for accepting the most migrants for its size. New Zealand and Australia also score well for accepting migrants and foreign students but lose points for bearing a low share of the refugee burden. Greece and South Korea host the largest shares of foreign students from poor countries. But Greece accepts fewer than 10,000 migrants a year from developing countries, a number equal to only 0.08 percent of its own population. The Visegrád countries rank last, with borders that are relatively closed to unskilled laborers, refugees, and students from developing countries.
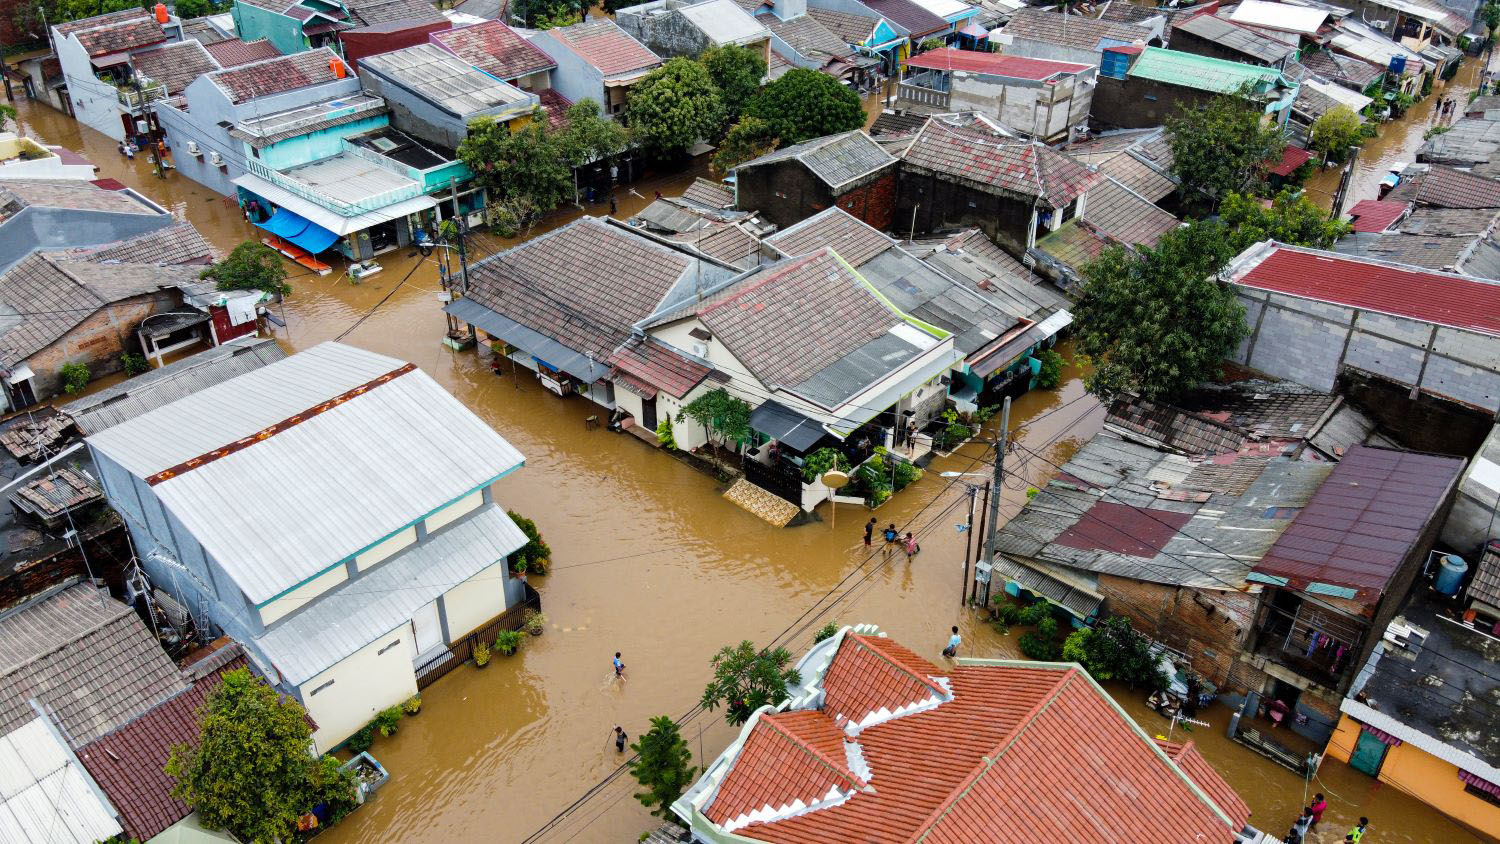
Environment
Climate change is regressive—awful for the rich, but catastrophic for the poor.
A healthy environment is sometimes dismissed as a luxury for the rich, but it is a necessity for all. Poor nations have weaker infrastructures and fewer social services than rich countries, making the results of climate change all the more damaging. While rich countries are the primary cause of anthropogenic climate change, the costs are largely borne by poor people. Many global fish stocks are overexploited and demand for fish remains high in rich countries. Much of the world’s poor depend on healthy ecosystems and biodiversity. Although tropical timber imports have been decreasing in recent years, rich countries need to step up their efforts in biodiversity protection and conservation. The environment component examines how rich countries are tackling their disproportionate exploitation of the global commons. Are they reining in greenhouse gas emissions and fossil-fuel production? Do they subsidize fleets that deplete fisheries off the coasts of Senegal and India? Do they control imports of illegally cut tropical timber?
Slovakia remains at the top of environment standings. Its gasoline taxes are among the highest in the CDI countries, and its greenhouse gas emissions are among the lowest. Sweden takes the second place this year partly because it has the lowest greenhouse gas emissions. Unlike many Western European countries that have been pursuing green technologies for some time, the Visegrád countries score well on emissions in part because of significant recent improvements in the post-communist era. Although Norway has low greenhouse gas emissions per capita, it produces the largest amount of fossil fuel per person, followed by Australia, Canada, and the United States. Australia also ranks poorly (second last) as the biggest emitter of greenhouse gases per capita, while Japan is the largest importer of tropical timber, which together with its small change in emissions and low gasoline tax puts it only one place ahead of Australia. The United States and Canada are the only CDI countries which are not party to the Kyoto Protocol, the most serious international effort yet to deal with climate change. Consistently poor performance across the indicators, including poor compliance with reporting of biodiversity treaties, puts Canada at the bottom.
Security
Choices made in rich nations can enhance or degrade the security of people in developing countries. They make or keep the peace in countries recently torn by conflict and protect vital international trade routes. They also supply developing countries with tanks and jets, which may underpin conflict.
Rich countries have the power to enhance or degrade the security of people in developing countries.
The CDI looks at four aspects of the security-development nexus. It tallies the financial and personnel contributions to peacekeeping operations and forcible humanitarian interventions, although it counts only operations approved by an international body such as the UN Security Council or NATO, and does not include Iraq or Afghanistan. It also rewards countries for basing naval fleets where they can secure sea lanes, and for participating in international security regimes that promote nonproliferation, disarmament, and international rule of law—such as the Comprehensive Test Ban Treaty (CTBT), the Ottawa Convention on land mines, and the International Criminal Court (ICC). Finally, the CDI penalizes some exports of arms, especially to nations that are undemocratic and which spend heavily on the military. Putting weapons in the hands of despots can increase repression at home and the temptation to launch military adventures abroad. In developing nations, buying weapons diverts money that might be better spent on teachers or transport systems.
Norway, Denmark, and New Zealand lead the rankings on security for their significant contributions to internationally sanctioned peacekeeping and humanitarian interventions and for ratifying major arms control treaties and the Rome Statute which created the ICC. Australia, France, the United States, and United Kingdom have also contributed to international peacekeeping—but are (apart from Australia) penalized for exporting a large amount of arms to poor and undemocratic countries, as are the Czech Republic and Sweden. Australia and South Korea do not make arms exports data publically available. Add to that the lowest contributions to peacekeeping operations and failure to ratify the Mine Ban treaty and Convention on Cluster Munitions, and South Korea is at the bottom of the security component. New Zealand and Japan earn perfect scores on arms exports to developing countries (they have none), but Japan lags on other parts of this indicator because of its low international military profile. The United States is penalized for not ratifying the Ottawa Convention and loses additional points as the only CDI country which is not party to the Comprehensive Nuclear Test Ban Treaty or ICC.
Technology
Technology and knowledge are key drivers of human and economic development. The internet, mobile phones, vaccines, and high-yielding grains were all invented by rich-country researchers and exported to poorer ones, where they have improved—and saved—many lives. Of course, new technologies do harm as well as good: consider motor vehicles, which symbolize gridlock and pollution as much as freedom in dense and growing cities such as Bangkok and Nairobi.
Technology and knowledge are key drivers of human and economic development. Pro-poor policies promote dissemination.
Accessing knowledge is one way in which poor countries catch up to wealthy, more industrialized ones, and donor countries can contribute to technological development and diffusion by funding research and development (R&D). The CDI rewards polices that support the creation and dissemination of innovations of value to developing countries. It rewards government subsidies for research and development, whether delivered through spending or tax breaks, but discounts military R&D by half. Countries are marked down for policies on intellectual property rights that can inhibit the international flow of innovations. These take the form of patent laws and trade agreements that advance the interests of those who produce innovations too much at the expense of those who use them. US trade negotiators, for example, have pushed for developing countries to agree never to force the immediate licensing of a patent even when it would serve a compelling public interest, such as an HIV/AIDS drug which could be used more if produced by low-cost local manufacturers.
Denmark, South Korea and Portugal do best on technology, thanks mainly to government expenditure on R&D worth around 1 percent of their national income. Although the Finnish government contributes to R&D with the highest share among the CDI countries, its tax subsidy rate is among the lowest. By contrast, Spain has the second-highest tax subsidy rate for business R&D, but spends less overall on R&D as a share of GDP. Poland, Hungary, and Greece spend the lowest shares of GDP on R&D (less than 0.4 percent). European Union member countries lose points for promoting compulsory licensing bans and pushing for the incorporation of “TRIPS-Plus” measures—which restrict the flow of innovations to developing countries—into bilateral trade agreements. European regulations of intellectual property rights have become much stricter in the last decade, limiting the spread of technologies.

For More
Visit cgdev.org/cdi for the complete 2014 edition of the Commitment to Development Index. There you can explore the numbers with our interactive graphing tool, view additional publications and background papers, and dive deeper into the CDI methodology by downloading our data and code.
About the CDI
The Commitment to Development Index has been compiled each year since 2003 by the Center for Global Development (CGD), an independent think tank that works to reduce global poverty and inequality through rigorous research and active engagement with the policy community. CGD Europe director and senior fellow Owen Barder directs the Index, building on the previous work of CGD former senior fellow David Roodman. Petra Krylova is the CDI coordinator. Collaborators have included William R. Cline on trade; Theodore H. Moran and Petr Janský on finance; Jeanne Batalova, Kimberly A. Hamilton, and Elizabeth Grieco on migration; Amy Cassara and Daniel Prager on environment; Michael E. O’Hanlon, Adriana Lins de Albuquerque, Mark Stoker, and Jason Alderwick on security; and Keith Maskus and Walter Park on technology. The Index is supported by the CDI Consortium.
Rights & Permissions
You may use and disseminate CGD’s publications under these conditions.