Commitment to Development Index 2013

The Commitment to Development Index ranks 27 of the world’s richest countries on policies that affect the more than five billion people living in poorer nations. The CDI goes beyond measures of foreign aid to quantify performance in seven areas:

  • Quantity and quality of foreign aid
  • Openness to exports
  • Policies that encourage investment and financial transparency
  • Openness to migration
  • Environmental policies
  • Promotion of international security
  • Support for technology creation and transfer

Why does the CDI matter? Because in an integrated world, the behavior of rich countries and powerful institutions can profoundly affect the lives of people in poor countries and because poverty and weak institutions in developing countries can breed public health crises, security threats, and economic crises that know no borders. Committing to policies that promote development and well-being is a global imperative: no human being should be denied the chance to live free of poverty and oppression and to enjoy a basic standard of education and health. The CDI countries all promote respect for human life and dignity; the Index looks at whether the policies of rich countries match these aspirations.

This document works best on modern browsers with JavaScript enabled. Consider upgrading, or refresh the page.
#
Share this:
#
Share this:
#
Share this:
#
Share this:
#
Share this:
#
Share this:
#
Share this:
#
Share this:
#
Share this:
#
Share this:
#
Share this:
#
Share this:
#
Share this:
#
Share this:
#
Share this:
#
Share this:
#
Share this:
#
Share this:
#
Share this:
#
Share this:
#
Share this:
#
Share this:
#
Share this:
#
Share this:
#
Share this:
#
Share this:
#
Share this:

For more on each CDI country, visit the country reports page.

Visit the full CDI (x) close

CDI Map

The Bottom Line

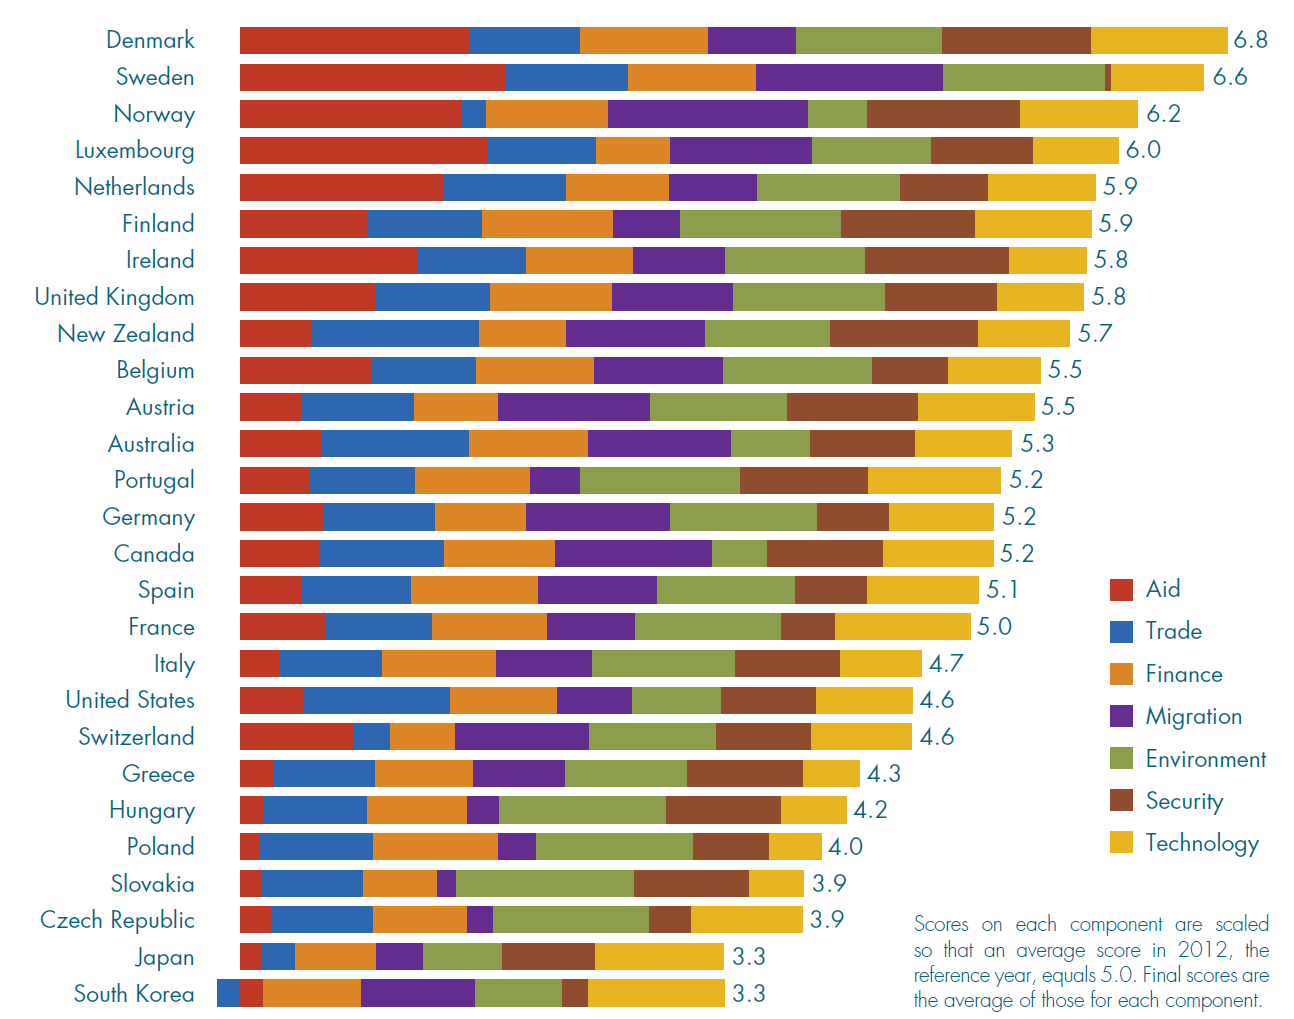
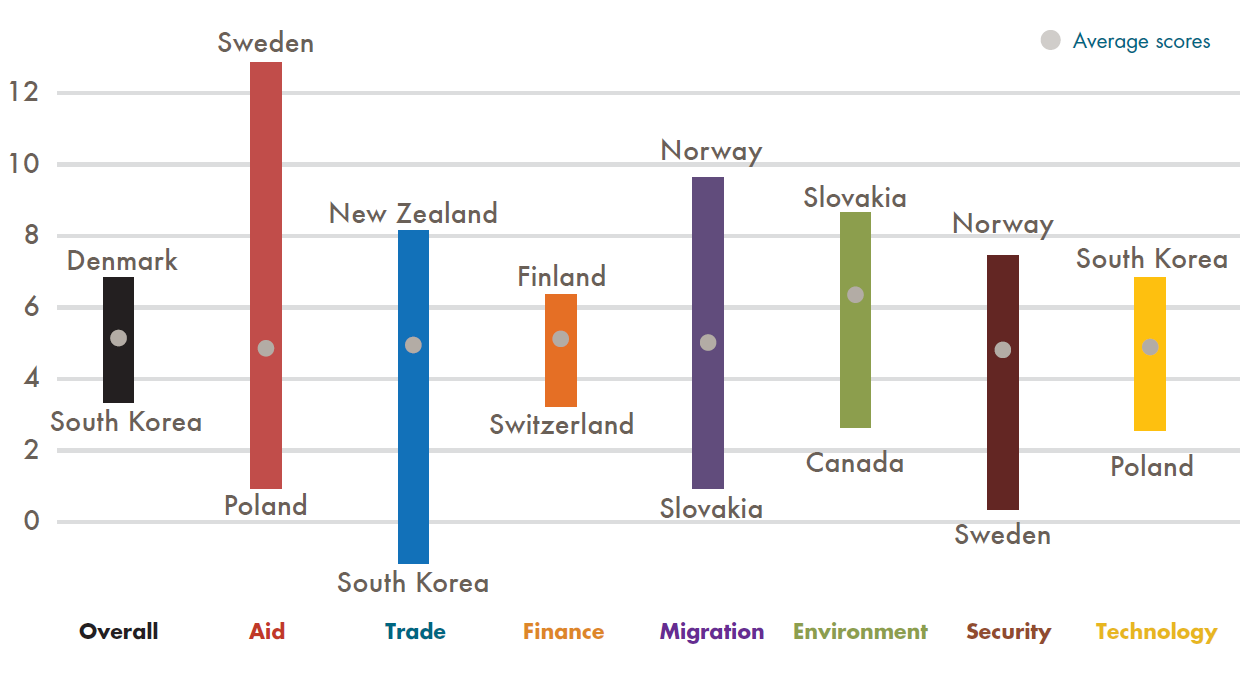
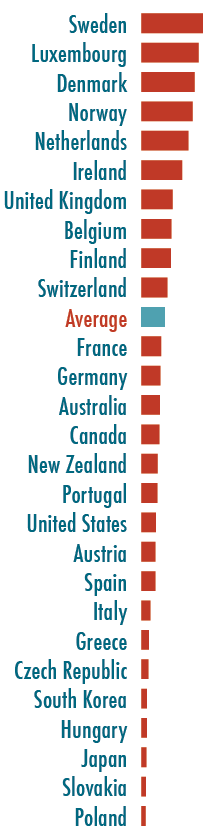
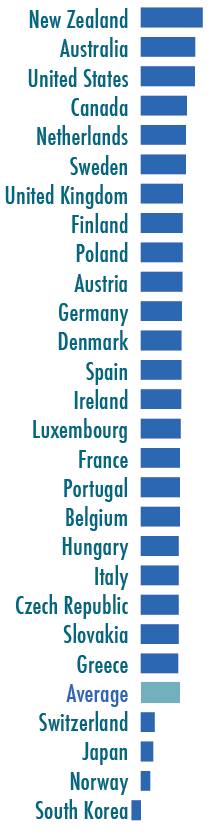
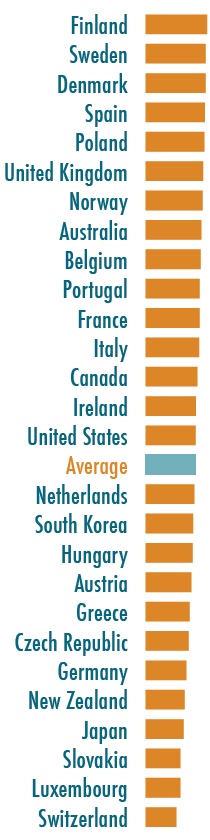
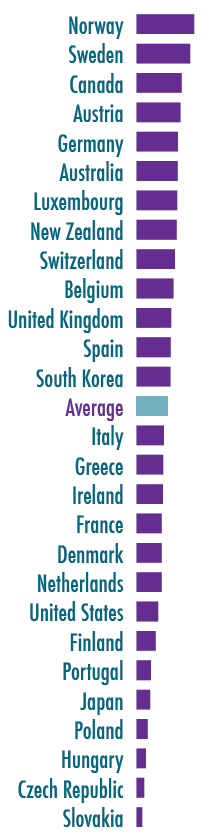
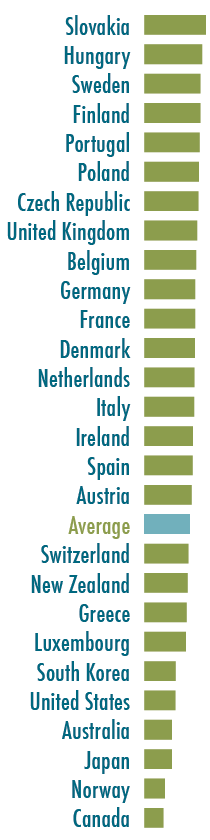
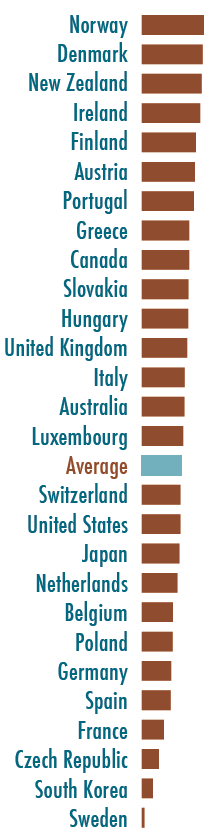
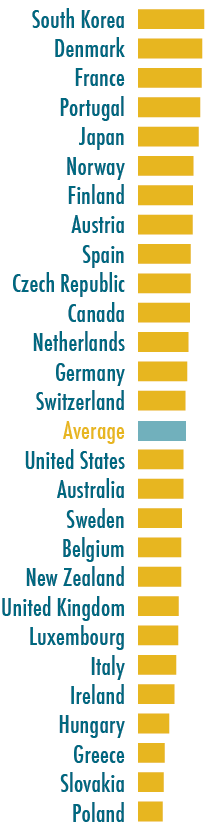
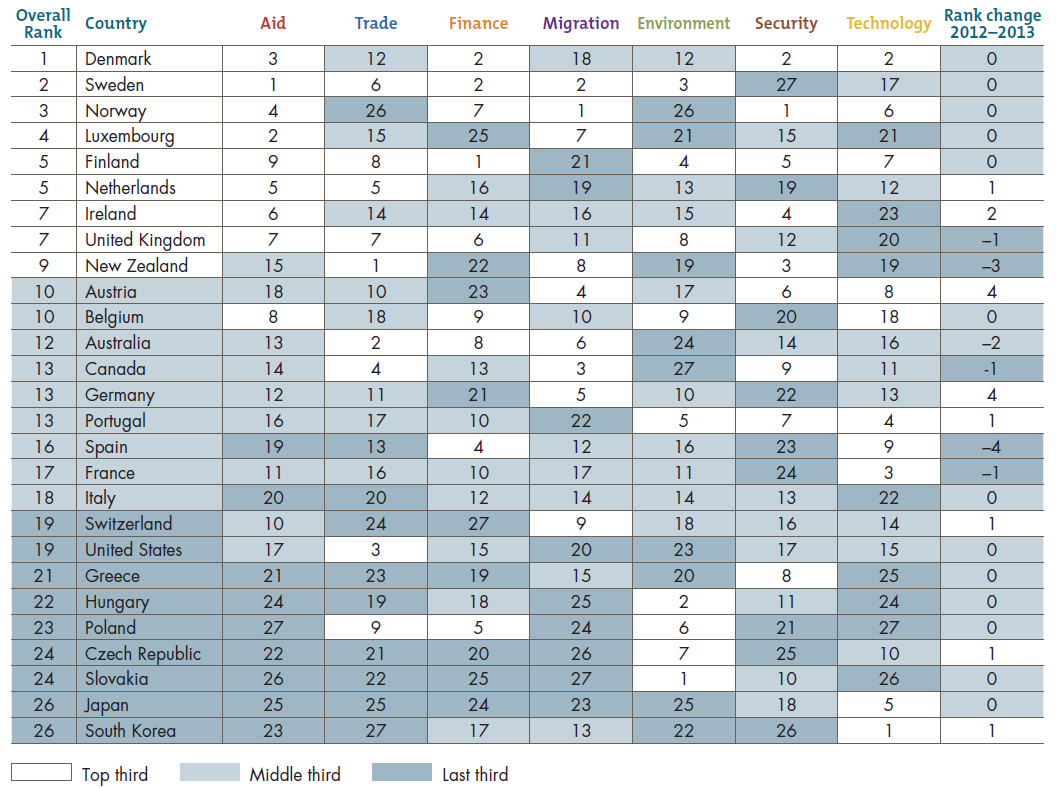
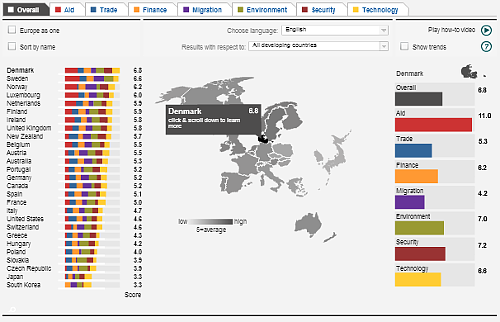
For the second year in a row, Denmark ranks first on the CDI because of its high aid quantity and quality, transparency in its financial sector, and commitment to security in developing countries, and because it spends a significant portion of GDP on developing new technologies. Close behind are Sweden, Norway, and Luxembourg, all top-ranked aid donors with strong migration records. Norway ranks number one in two CDI components—migration and security. New Zealand and Austria place in the top half with very different profiles: both generally score low on aid, but New Zealand is strong on trade and security while Austria is particularly strong on migration. Among the G–7 countries—those that matter most by dint of their economic power—only the United Kingdom places in the top 10. The United States scores below average in all but the trade component. Japan and South Korea finish last with small aid programs for their sizes, tight borders to the entry of goods and people, and limited involvement in peacekeeping. They are joined near the bottom by Hungary, the Czech Republic, Poland, and Slovakia, which rank at or below average in all components except for environment, where they occupy top spots. Still, even the first-place Danes are only average in three of the seven policy areas, but unlike all other CDI countries they have no below-average score.

Overall scores

Share this:

Best and Worst Performers

In 2013 Denmark has the best overall score because of very good and consistent performance across the components, even though it does not rank fi rst in any of them. Japan and South Korea take the last places, ranking average or below in all but the technology component.

Sweden ranks best on aid because it provides 0.97 percent of its GDP in foreign assistance, does not tie aid, and resists overloading recipients with too many small projects. Poland ranks worst because it has a small budget relative to its economy, does not report tying (so all its aid is considered tied), and provides aid to not-so-poor and rather undemocratic countries. New Zealand performs best on trade, imposing among the lowest tariffs on developing countries’ imports and few legal restrictions on purchasing services from other countries. South Korea has the unwelcome distinction of a negative score on trade, because it imposes among the highest tariffs and imposes vast legal restrictions on services from elsewhere. Finland does best on finance because of very good financial transparency and support to investment in developing countries. Switzerland comes last, mainly because it lacks financial transparency and does not have a national agency to offer political risk insurance. Norway takes first place on migration, accepting the most migrants for its size and bearing a large share of refugee burden, unlike the last-ranked Slovakia, which is relatively closed to migrants from developing countries. By contrast, Slovakia is in first place on environment because of high gasoline taxes and low greenhouse gas emissions. Canada is not party to the Kyoto Protocol and has high fossil-fuel production, high greenhouse gas emissions, and low gas taxes, putting it at the bottom.

Countries with very similar ranks in most other components—Norway and Sweden—finish on opposite ends in security. Last-ranked Sweden is proportionally the largest arms exporter to developing countries and does not help protect sea lanes. Top-ranked Norway is rewarded for its high contribution to peacekeeping, minimal arms exports, and participation in security treaties. South Korea, which finishes last overall in the CDI, makes its highest contribution to development through technology, owing to high government support for research and development. Poland ranks last on that component, spending only 0.3 percent of GDP on R&D (as opposed to South Korea’s 1 percent). In short, all countries could do much more to spread prosperity.

Best and worst performers

Share this:

Aid

Aid graph

Most comparisons of aid donors track only how much each gives. For the CDI, quantity is merely a starting point in a review that also assesses aid quality. The CDI discounts “tied” aid that must be spent on products from the donor nation and raises project costs by 15– 30 percent. The CDI also looks at where aid goes, recognizing that aid is more effective in poor and relatively well-governed nations. Aid to Afghanistan, where the rule of law is weak, is counted at 1¢ on the dollar, while aid to Ghana, where poverty is high and governance relatively good, is counted at 99¢ on the dollar. The CDI also discounts aid that overloads recipient governments with too many small projects, burdening officials with hosting and reporting obligations. Finally, the Index recognizes governments that let taxpayers write off charitable contributions, since some of those contributions go to nonprofits working in developing countries.

The top performers all give a lot of aid as a share of GDP (Norway 0.99 percent, Sweden 0.98 percent, and Luxembourg 0.97 percent). But quality matters too. Norway, Australia, and the United Kingdom report that none of their aid is tied. Portugal, Japan, and Ireland score best on selectivity for providing aid mainly to poor and well-governed countries. Ireland ranks ninth on aid as a share of GDP, but it ranks sixth overall because of high selectivity and minimal tying. The United States, Ireland, and Canada promote policies that support private charitable giving, but the United States also ties nearly 50 percent of its aid and supports corrupt or undemocratic governments in Iraq, Jordan, Afghanistan, and elsewhere; this negatively affects the quality of its aid and therefore its final aid score. The Visegrád countries—the Czech Republic, Hungary, Slovakia, and Poland—provide only small amounts of aid as a share of their GDP, and they do not report whether their aid is tied (except for the Czech Republic at 65 percent). They also do not report charitable giving. Japan and South Korea provide only small amounts of aid (0.13 percent and 0.12 percent), and have many small projects that overburden the recipients.

Trade

Trade graph

The rules that govern world trade have developed since World War II through a series of major international negotiating “rounds.” Because rich countries call most of the shots in this intensely political process, some crops and other goods that poor countries are best at producing face high trade barriers in rich countries. Rich-country taxes on food imports and farm subsidies lead to overproduction and dumping on world markets, which lowers world prices and hurts poor-country farmers. (CDI countries spend some $91 billion per year subsidizing their own farmers, a substantial fraction of the $142 billion they spend on aid.) High industrial tariffs on labor-intensive processed goods also tend to hurt the poor. Because the ability to sell in rich-country markets is crucial for developing countries, the CDI ranks wealthy countries according to how open they are to imports from developing countries. It also looks at how much countries have reduced delays and red tape on imports and whether or not they have legal restrictions on purchasing services from other countries.

New Zealand does best on trade because of its low agricultural subsidies and low tariffs on imports from developing countries. It also ranks top in the Service Trade Restrictions Index (followed by Poland and the Netherlands). Australia, the United States, and Canada limit agricultural subsidies and impose low tariff barriers and administrative impediments to imports. Imports to the United States and Denmark require the least documentation while imports to France, South Korea, and Sweden take the least amount of time. In general, EU nations share common trade and agriculture policies and therefore score almost exactly the same. Japan’s rice tariffs have shrunk in recent years relative to the rising world price of rice, but they are still high, equivalent to a 512 percent sales or value-added tax on imports. South Korea, Norway, Japan, and Switzerland are the worst performers because they impose high tariffs. Norway and Switzerland have high tariffs on meat, dairy products, and grains from poor countries; Korea and Japan maintain the highest tariffs on rice, and Korea imposes by far the highest tariffs on grains, seeds, and nuts.

Finance

finance graph

Foreign investment can be a significant driver of growth and jobs in poor countries. Many of East Asia’s fastest-growing countries—Malaysia, Singapore, and Thailand—benefited from such investment. But foreign investment can also lead to instability, corruption, and exploitation. The CDI gives credit to investment-promotion policies that are good for development. Do governments offer insurance against political risks to encourage domestic companies to invest abroad? Do they support international efforts to ensure transparency in extractive industries? While some rich-country policies may encourage positive foreign investment, others may facilitate illicit activities in developing countries, including corruption, tax evasion, and trafficking in guns, drugs, and people. Using data from the Financial Secrecy Index (FSI), the CDI recognizes countries that have regulations to promote transparency in financial transactions within their jurisdiction.

Finland, Sweden, Denmark, Spain, and Poland are top ranking in the finance component because of their transparent financial sectors, support to investment in developing countries, and membership in the Extractive Industries Transparency Initiative (EITI). Switzerland is at the bottom as one of only three CDI countries without a national agency to offer political risk insurance (Ireland and New Zealand are the others). Switzerland also lacks regulations to promote financial transparency of companies and banks, as does Luxembourg, which has a poor financial transparency record and does little to identify investment opportunities in developing countries. Although Canada ranks at the top in support for investment, its relative lack of financial transparency brings down its overall score. Ireland and Greece are the worst performers in investment support because they restrict pension-fund investments in developing countries, but they rank relatively well in financial transparency. Among the Visegrád countries, which do the least to stem bribery and corrupt investment practices, Poland stands out with a much better FSI ranking.

Migration

migration graph

About 200 million people—1 in 33—do not live in the country where they were born. Workers who have migrated from poor to rich countries send billions of dollars back to their families each year, a flow that surpasses foreign aid. Some immigrants from developing countries, especially students, acquire new knowledge and skills and bring them home. But what about brain drain? Emigration has been blamed for emptying African clinics of nurses, who can earn far more in London hospitals. But in careful studies, CGD senior fellow Michael Clemens finds no evidence that skilled people hurt their home country by leaving it. African clinics and hospitals have bigger problems than a lack of personnel, and personnel shortages themselves result from many forces, such as low pay and poor working conditions, untouched by international migration policies. The CDI gives credit for migration of skilled and especially unskilled people using data on the gross inflow of migrants from developing countries. The CDI also uses indicators of openness to students from poor countries and aid for refugees and asylum seekers.

Norway takes first place for accepting the most migrants for its size and bearing the second largest share of refugee burden (Sweden bears the most). New Zealand and Australia also score well for accepting migrants and foreign students but lose points for low sharing of the refugee burden. Greece and South Korea host the largest shares of foreign students from poor countries. But Greece accepts fewer than 10,000 migrants a year from developing countries, a number equal to only 0.08 percent of its own population. The Visegrád countries rank last, with borders that are relatively closed to unskilled laborers, refugees, and students from developing countries.

Environment

environment graph

A healthy environment is necessary for everyone. Poor nations have weaker infrastructures and fewer social services than rich countries, making the results of climate change all the more damaging for them. While rich countries are most responsible for anthropogenic climate change, it’s largely the poor who pay the costs. The environment component examines how rich countries are tackling their disproportionate exploitation of the global commons. Are they reining in greenhouse gas emissions and fossil-fuel production? Do they subsidize fleets that deplete fisheries off the coasts of Senegal and India? Do they control imports of illegally cut tropical timber?

Slovakia and Hungary remain at the top of environment standings with the highest gasoline taxes of CDI countries and greenhouse gas emissions among the lowest. Unlike many Western European countries that have been pursuing environment-conscious technologies for decades, the Visegrád countries score well on emissions in part because of significant improvements in the postcommunist era. Finland and Sweden have low emissions because they do not produce fossil fuels. Although Norway has low greenhouse gas emissions rate per capita, it produces the largest amount of fossil fuel per person, followed by Australia, Canada, and the United States. Australia also ranks poorly as the biggest emitter of greenhouse gases per capita, while the United States and Canada are the only CDI countries that are not party to the Kyoto Protocol, the most serious international effort yet to deal with climate change. That gap, along with high greenhouse gas emissions and low gas taxes, puts Canada at the bottom.

Security

security graph

Rich nations have the power to enhance or degrade the security of people in developing countries. They make or keep the peace in countries recently torn by conflict and protect vital international trade routes. But they also supply developing countries with weapons that may underpin conflict. The CDI looks at four aspects of the security-development nexus. It tallies the financial and personnel contributions to peacekeeping operations and forcible humanitarian interventions, although it counts only operations approved by an international body such as the UN Security Council or NATO. It also rewards countries that base naval fleets where they can secure sea lanes and that participate in international security regimes that promote nonproliferation, disarmament, and international rule of law—such as the Comprehensive Nuclear Test Ban Treaty (CTBT), the Ottawa Convention on land mines, and the International Criminal Court (ICC). Finally, the CDI penalizes some exports of arms, especially to nations that are undemocratic and spend heavily on the military. Putting weapons in the hands of despots can increase repression at home and military adventures abroad. In developing nations, buying weapons diverts money that might be better spent on teachers or transport systems.

Norway, Denmark, and New Zealand take the top spots for their significant contributions to internationally sanctioned peacekeeping and humanitarian interventions and for ratifying major arms control treaties and the Rome Statute, which created the International Criminal Court. Australia, France, the United States, and United Kingdom have also contributed to international peacekeeping but (apart from Australia) export a large amount of arms to poor and undemocratic countries, as do the Czech Republic and Sweden. Sweden, which reports the highest level of arms exports to poor and undemocratic governments and does not participate in protecting global sea lanes, takes last place in security. Australia and South Korea score badly because they do not publish data on arms exports. New Zealand and Japan earn perfect scores on arms exports to developing countries (they have none), but Japan lags in other aspects because of its low international military profile. The United States is penalized for not ratifying the Ottawa Convention and loses additional points as the only CDI country that is not party to the CTBT or ICC.

Technology

technology graph

The Internet, mobile phones, vaccines, and high-yield grains were all invented in rich countries and exported to poorer ones, where they have improved and saved many lives. Of course, new technologies can do harm too: consider motor vehicles, which symbolize gridlock and pollution as much as freedom in dense cities such as Bangkok and Nairobi. The CDI rewards polices that support the creation and dissemination of innovations valuable to developing countries. It rewards tax breaks and spending for research and development (R&D), but discounts military R&D by half. Countries are marked down for policies on intellectual property rights that can inhibit the international flow of innovations. These include patent laws that advance the interests of those who produce innovations too much at the expense of those who use them. US trade negotiators, for example, have pushed for developing countries to agree never to force the immediate licensing of a patent even when it would serve a compelling public interest, such as an HIV/AIDS drug which could be used more if produced by low-cost local manufacturers.

South Korea, Denmark, and France finish at the top with government R&D expenditure on around 1 percent of their national income. Although Finland’s proportional contribution to R&D is the highest of all CDI countries, its tax subsidy rate is among the lowest. By contrast, Spain has the second-highest tax subsidy rate for business R&D but spends less on R&D as a share of GDP. Poland, Slovakia, Greece, and Hungary spend the lowest shares of GDP on R&D (less than 0.4 percent). Many European countries (particularly Sweden and Germany) lose points for promoting compulsory licensing bans and pushing for the incorporation of “TRIPS-Plus” measures that restrict the flow of innovations to developing countries into bilateral free-trade agreements.

Rankings

CDI 2013 Rankings Table

For More

Visit cgdev.org/cdi for the complete 2013 edition of the Commitment to Development Index. There you can explore the numbers with our interactive graphing tool, view additional publications and background papers, and dive deeper into the CDI methodology by downloading our data and code.

CDI Map

About the CDI

The Commitment to Development Index has been compiled each year since 2003 by the Center for Global Development (CGD), an independent think tank that works to reduce global poverty and inequality through rigorous research and active engagement with the policy community. CGD Europe director and senior fellow Owen Barder directs the Index, building on the previous work of former CGD senior fellow David Roodman. Petra Krylova is the CDI coordinator. Collaborators have included William R. Cline on trade; Theodore H. Moran and Petr Janský on finance; Jeanne Batalova, Kimberly A. Hamilton, and Elizabeth Grieco on migration; Amy Cassara and Daniel Prager on environment; Michael E. O’Hanlon, Adriana Lins de Albuquerque, Mark Stoker, and Jason Alderwick on security; and Keith Maskus and Walter Park on technology. The Index is supported by the CDI Consortium.