

Quantifying the Quality of Health Aid: Health QuODA
Amanda Glassman and Denizhan Duran
May 2012
Health is one of the largest and most complex sectors of foreign aid: in recent years, about 15 cents of every aid dollar went to global health. While health is often cited as one of the few undisputed aid success stories, there is little quantitative analysis of the quality of health aid, and some studies suggest that health aid does not necessarily improve health outcomes.
This brief summarizes and updates results of the Quality of Official Development Assistance (QuODA) index applied to health aid and compares these results to the overall QuODA assessment. Through quantifying performance on aid effectiveness, we hope to motivate improvements in health aid effectiveness and contribute to the definition of better, more empirically based measures of health aid quality.
Aid Effectiveness in Health: Why Does It Matter?
In recent years, health aid has grown larger, more complex, and more fragmented. According to the Institute for Health Metrics and Evaluation, health aid increased dramatically from $5.66 billion 1990 to $27.73 billion in 2011: 30 donors gave aid to 137 countries through 100 agencies in 2009 and 2010.
These factors, along with looming reductions in donor aid spending, all point to the exceptional importance of assuring that aid to the health sector is used as efficiently as possible. Further, growing funding commitments to multilaterals such as the GAVI Alliance and the Global Fund are becoming increasingly contingent on delivering performance and demonstrating value for money.
Core principles of improved aid effectiveness are defined by the OECD’s Paris Declaration, which was agreed upon in 2005 by over 100 donor and partner countries and further endorsed in Accra in 2008. However, there has been no effort to quantify performance at the sector level.
What Is Health QuODA?
QuODA is an index developed by Nancy Birdsall and Homi Kharas that measures aid quality of donor countries and aid agencies via 31 indicators reported to the OECD’s Creditor Reporting System (CRS) database and the Survey on Monitoring the Paris Declaration. Indicators are grouped across four dimensions that roughly track the Paris Declaration’s areas of emphasis as well as the literature on aid effectiveness: maximizing efficiency, fostering institutions, reducing burden and transparency and learning. [1]
In applying the QuODA methodology to health, we use the same four dimensions and a subset of the 23 indicators applicable to the health sector to rank donor countries and agencies across the four dimensions. We use the original QuODA measures whenever possible, omitting those that are unavailable at the sector level and adding others particularly relevant to health. We then compare our results with the overall QuODA, look at changes from 2008 to 2009, and provide a glimpse of results from 2010.
Box 1: The Four Dimensions of Health QuODA and Their Indicators
Maximizing Efficiency
- Share of allocation to poor countries
- Share of allocation to countries with high disease burden*
- Share of allocation to well-governed countries
- High strict country programmable aid share*
- Focus/specialization by recipient country
- Support of select global public good facilities
- Share of untied aid
Fostering Institutions
- Share of allocation to countries with national health plans*
- Support to essential health metrics*
Reducing Burden
- Significance of aid relationships
- Fragmentation across donor agencies
- Median Project Size
- Member of IHP+*
- Share of aid through multilateral channels*
Transparency and Learning
- Member of IATI
- Implementation of IATI data reporting standards
- Member of 3iE*
- Recording of project title and descriptions
- Detail of project description
- Reporting of aid delivery channel
- Completeness of project-level commitment data
- Quality of main agency evaluation policy
- Aid to partners with good M&E frameworks
* New indicator added for health QuODA, or modified compared to original QuODA
Key Findings: Best Performers and Trends
Ranking 30 donors across four dimensions in 2008 and 2009, we find the following key points:
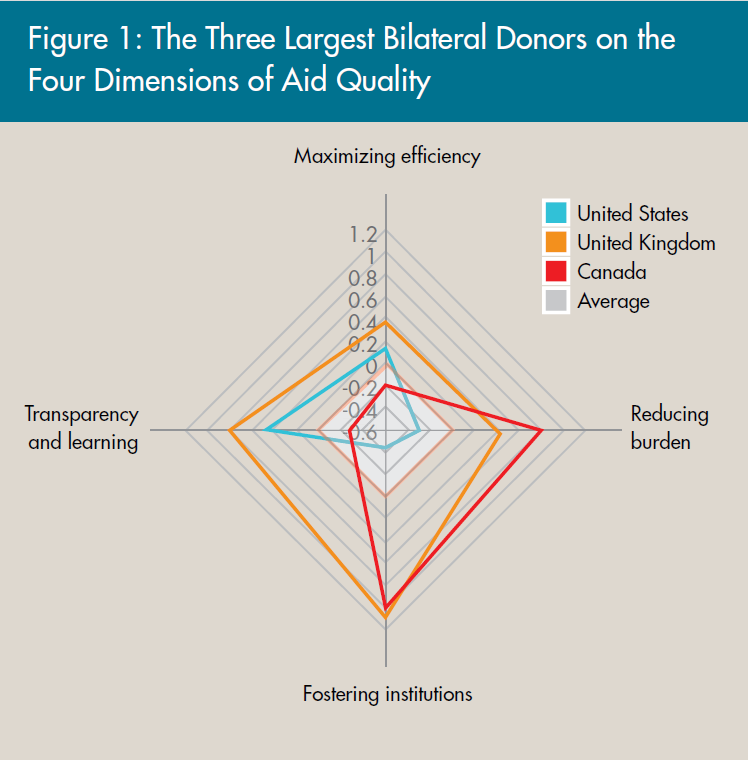
- Donors have different comparative advantages : Few donors are in the top or bottom 10 across every category, and most donors score poorly on one or more of the dimensions (see table 1 for 2009 rankings). Only the United Kingdom and the Global Fund to Fight AIDS, Tuberculosis and Malaria are consistent top performers in every category. It is encouraging to see the largest bilateral donors perform above average in most dimensions (see figure 1). Greater analysis of comparative advantage may suggest aid investment strategies that play to donors’ strengths.
- On average, multilaterals fare better than bilaterals: Multilateral donors fare better than bilateral donors in every dimension. Multilateral aid is untied, less fragmented, tracks need, and reduces the administrative burden on recipients. The Global Fund ranks as the best multilateral, positioned first in reducing the administrative burden on recipients through less fragmentation and establishing significant aid relationships.
- Donors differ in their allocation of health aid, yet there is no overall pattern: Health aid disbursements are directed less to poor countries and well-governed countries compared to overall aid and are less transparent on average when compared to overall aid. However, health aid is also less tied, more concentrated in a few countries, and less fragmented, and it has more significant aid relationships.
- The largest donor, the United States, does better on health than on overall aid and is getting better on most dimensions: The United States ranks better in every dimension of health QuODA than original QuODA, yet it is still below average in two dimensions and ranks among the bottom three donors in the reducing burden dimension. The rhetorical move toward more consolidation under the Global Health Initiative’s umbrella is not reflected in actual performance on fragmentation; from 2008 to 2010, the number of U.S. government agencies delivering health aid in recipient countries stayed the same.
- There is mixed progress from 2008 to 2010 [2] : Allocation according to disease burden improved from 2008 to 2010. Health aid also became less fragmented over the years. Despite these significant improvements, some indicators have seen a decline from 2008 to 2010. Overall, less aid has been allocated through multilateral channels, and the significance of aid relationships has declined. There were modest improvements from 2008 to 2009 in some areas, such as support to global public good facilities, untied aid, and allocation to countries with health plans, as well as reporting key project details to the CRS database.
Table 1. Ranking of Donors by Aid Quality Dimension, 2009
| Donor | Maximizing efficiency | Fostering institutions | Reducing burden | Transparency and learning |
| African Development Fund | 3 | 16 | 10 | 19 |
| Australia | 25 | 10 | 2 | 9 |
| Austria | 29 | 11 | 29 | 16 |
| Belgium | 13 | 8 | 19 | 30 |
| Canada | 20 | 5 | 3 | 14 |
| Denmark | 2 | 9 | 22 | 7 |
| European Commission | 21 | 6 | 4 | 5 |
| Finland | 17 | 3 | 11 | 11 |
| France | 26 | 27 | 20 | 28 |
| GAVI | 14 | 21 | 9 | 20 |
| Germany | 22 | 20 | 24 | 12 |
| Global Fund | 11 | 7 | 1 | 15 |
| Greece | 30 | 13 | 30 | 27 |
| IDA | 5 | 17 | 8 | 10 |
| IDB Special | 18 | 1 | 15 | 24 |
| Ireland | 4 | 15 | 25 | 2 |
| Italy | 19 | 25 | 21 | 23 |
| Japan | 27 | 26 | 14 | 17 |
| Korea | 28 | 30 | 28 | 25 |
| Luxembourg | 7 | 23 | 16 | 29 |
| Netherlands | 1 | 28 | 7 | 4 |
| New Zealand | 15 | 24 | 5 | 18 |
| Norway | 6 | 2 | 17 | 8 |
| Portugal | 16 | 14 | 18 | 26 |
| Spain | 24 | 29 | 13 | 21 |
| Sweden | 9 | 22 | 12 | 6 |
| Switzerland | 10 | 12 | 26 | 22 |
| UN (Select Agencies) * | 23 | 19 | 23 | 13 |
| United Kingdom | 8 | 4 | 6 | 1 |
| United States | 12 | 18 | 27 | 3 |
Policy Implications
Our analysis shows that donors have significant scope for improvement. It also points to the need for much better measurement of goals that donors and recipients frequently profess. Below are a few takeaways:
- Even imperfect aid effectiveness indicators suggest there is plenty of room to improve donor performance: While acknowledging the limitations of the analysis, our results across different indicators show that every donor has tremendous room for progress in areas where improvements would be unambiguously good for recipients, such as allocating according to disease burden and decreasing the administrative burden on recipients. Systematic tracking of these or improved quantitative indicators can create virtuous incentives for donors to improve the quality of health aid.
- Measures under the fostering institutions dimension are inadequate: Good institutions are thought to produce better development outcomes. However, there is little empirical research on the relationship between institutions and outcomes in the health sector in low- and middle-income countries, and even fewer resources on what “good” donor support to institutions would be.
- More and better aid effectiveness data are needed: There are significant gaps in sector-level reporting to the CRS, especially in terms of purpose codes (how information reported to the OECD is coded by use) and key determinants of aid effectiveness such as predictability, coordination, alignment with partner country priorities, and the extent of budget support. What was left out of this index may be as relevant as what was included.
- A shift from discussing aid effectiveness to development effectiveness is needed: The international policy discussion is appropriately shifting from tracking inputs to measuring results. The aid and aid effectiveness measures we apply in QuODA health, however, are not empirically linked to health impact; establishing this link will only be possible with more data and impact evaluations, which in turn could help channel more resources into projects that are likely to work.
Further detail on the results, as well as the data underlying our policy analysis, can be found in the following working paper: Denizhan Duran and Amanda Glassman. 2012. “An Index of the Quality of Official Development Assistance in Health.” CGD Working Paper 287. Washington, D.C.: Center for Global Development. http://www.cgdev.org/content/publications/detail/1425926
This brief is based on Denizhan Duran and Amanda Glassman, “An Index of the Quality of Official Development Assistance in Health,” CGD Working Paper 287 (Center for Global Development, 2012), http://www.cgdev.org/content/publications/detail/1425926. CGD is grateful for contributions from the UK Department for International Development in support of this work.
[1] More on QuODA can be found at www.cgdev.org/quoda.
[2] 2010 calculations rely on the first edition of the CRS 2010 database, which will likely be finalized by June. We will update our analysis and rankings once the database is finalized.
|
CENTER FOR GLOBAL DEVELOPMENT
1800 Massachusetts Avenue NW, Third Floor
Washington DC 20036
Tel 202.416.4000 | Fax 202.416.4050
|
|