Recommended

POLICY PAPERS
This note is based on an article published in Tax Notes (Volume 6: Number 9 August 27, 2018)
“The Missing Profits of Nations,” by Thomas Tørsløv, Ludvig Wier, and Gabriel Zucman (TWZ from here on), is a recent high-profile study seeking to assess profit shifting by multinational corporations. It is an impressive piece of data wrangling, and the authors admirably and usefully provide a detailed appendix and data files to allow the reader to explore and reproduce the results.
Some of the interpretations and conclusions they draw, however, are less convincing, and headlines such as “40 percent of multinational profits are shifted” are at risk of being misinterpreted as indicating potential revenue gains that are higher than their findings suggest.
Putting multinational corporate taxes into perspective
TWZ start by mapping the geography of multinational corporate activity; where profits are reported, where tax is paid, and how this is divided between local and foreign companies. Where the data is patchy they impute values (and in some places there are a lot of gaps and educated guesswork, so we should be cautious with the numbers). The resulting map of multinational corporate activity, albeit imperfect, provides a useful concrete starting point for considering international corporate tax issues. This contrasts with other methodologies which can generate large estimates of lost revenues without any reference to underlying volumes of investment. It should be noted that the data is from 2015—before the international “Base Erosion and Profit Shifting” (BEPS) actions were implemented, and recent US tax reforms. The researchers have promised to update the figures when new data are available, and this should provide a valuable addition to studies on international tax.
One thing which is clear from TWZ’s data is that the amount of public revenue that governments get from taxing multinational subsidiaries is not huge in comparison to overall public spending.
The study breaks down GDP into component streams, as the graph below shows.
Figure 1. Decomposing global economic value added

Based on Torslov, Wier and Zucman, 2018
About 54 percent of global GDP is generated by companies; the rest by governments, households, and noncorporate businesses. TWZ estimate that 86 percent of this corporate value-added is generated by domestic companies (this includes both purely domestic companies and multinationals-at-home such as Apple’s operations in the US or Siemens in Germany). The value-added by the operations of multinational subsidiaries outside of their home country accounts for 7 percent of global GDP (including employee compensation, social security payments, pension contribution, interest, and depreciation as well as profits). The foreign profits of these multinational subsidiaries account for just 3 percent of global GDP. Corporate income tax (CIT) payments by foreign multinational are the thin black bar at the top of the final column, accounting for around 0.4 percent of GDP, or a bit more than 1 percent of government tax revenues overall.
The question about revenue losses from base erosion and profit shifting is about whether this bar should be a bit thicker.
Of course, a few tenths of a percentage point of global GDP is still a large amount of money, and the efficiency and fairness of the international corporate tax system matters. But multinational corporate income tax is often perceived to be much more significant in relation to public spending overall than it really is (for example, the idea that poor countries lose “more than they get in aid” to profit shifting). The headline statement that multinationals shift 40 percent of profits only relates to TWZ’s estimates of foreign profits of multinationals. They find that 86 percent of corporate profits relate to multinationals-at-home (or purely domestic companies).
To give an idea of the absolute scale of these figures in different countries, the graphs below show how TWZ break down national GDP for three countries across the spectrum of high income, upper middle income, and lower middle income: France, Mexico, and India.
In France formal sector businesses produce almost $20K of added value for each person in the country and around $13K of this is distributed as employee compensation. Overall the government is able to collect and spend some $16.K in taxes and social contributions for each person in the country. TWZ estimate that multinational subsidiaries are responsible for $879 of added value per citizen, which includes interest, depreciation, retained profits, dividends to shareholders, and corporate income tax. The corporate tax related to these subsidiaries amounts to around $130 per French person. Not nothing, but not the basis of the extensive French state (it covers a little under three days’ worth of public spending per person).
In Mexico the value produced on a per capita basis by formal sector firms is around a quarter of that in France. Corporate income tax paid by foreign subsidiaries is around $60 per person (just over a week’s public spending).
In India the gross surplus of foreign firms amounts to only $15 per citizen per year, and they make a corporate tax contribution of around a dollar (slightly less than two days of public spending).
Figure 2. Decomposing economic value added in France, Mexico, and India

In other words, corporate income tax paid by foreign multinationals is a small proportion of overall revenues in a rich country like France. In a poor country like India, the amount is both relatively small and absolutely tiny, reflecting the lower level of foreign investment per person. However, as research by Anna Milanez shows, companies play a much larger role in paying and collecting taxes across the other “tax handles” such as sales and employment (in OECD countries businesses on average pay or collect $9 of other taxes for every $1 of corporate income tax they pay).
All of this suggests that discussion of corporate taxation should not lose sight of the need for broad taxation and of economic growth, and the growth of formal sector firms to support it.
How much profit is shifted? How much revenue is lost?
The main original aim of the study was to estimate “artificial profit shifting” to a group of jurisdictions the authors define as tax havens. These include Belgium, Cyprus, Ireland, Luxembourg, Malta, Netherlands, Switzerland, Hong Kong, Singapore, Puerto Rico, and the UK crown dependencies and overseas territories, as well as other small states that are commonly included on tax haven lists.
The main approach for identifying profit shifting is to estimate how much corporate profit is made by multinational subsidiaries and local companies in each country and then to compare the ratio of profits-to-payroll between the local and foreign sector. They find that in all of the countries they define as tax havens (as well as a few major economies) companies in the foreign-controlled sector generate significantly higher profits-to-payroll costs than companies in the local sector, while in most economies the opposite is true. They interpret this difference as a direct measure of profit shifting.
The authors use the assumption that in the absence of profit shifting, foreign corporations and local firms would generate the same level of profits for a given wage bill. Based on this they calculate that 40 percent of the profits of multinational subsidiaries abroad are artificially shifted to tax havens (this is around 6 percent of corporate profits overall), and that this shows up as profits in Ireland, Singapore, Switzerland, the Netherlands, Luxembourg, and Hong Kong (where employment by multinational enterprises is substantial), with smaller amounts showing up in small island tax havens, where multinational corporations employ only handfuls of people.
Figure 3. Where are excess profits? TWZ estimates (USD billions, top 20 locations)
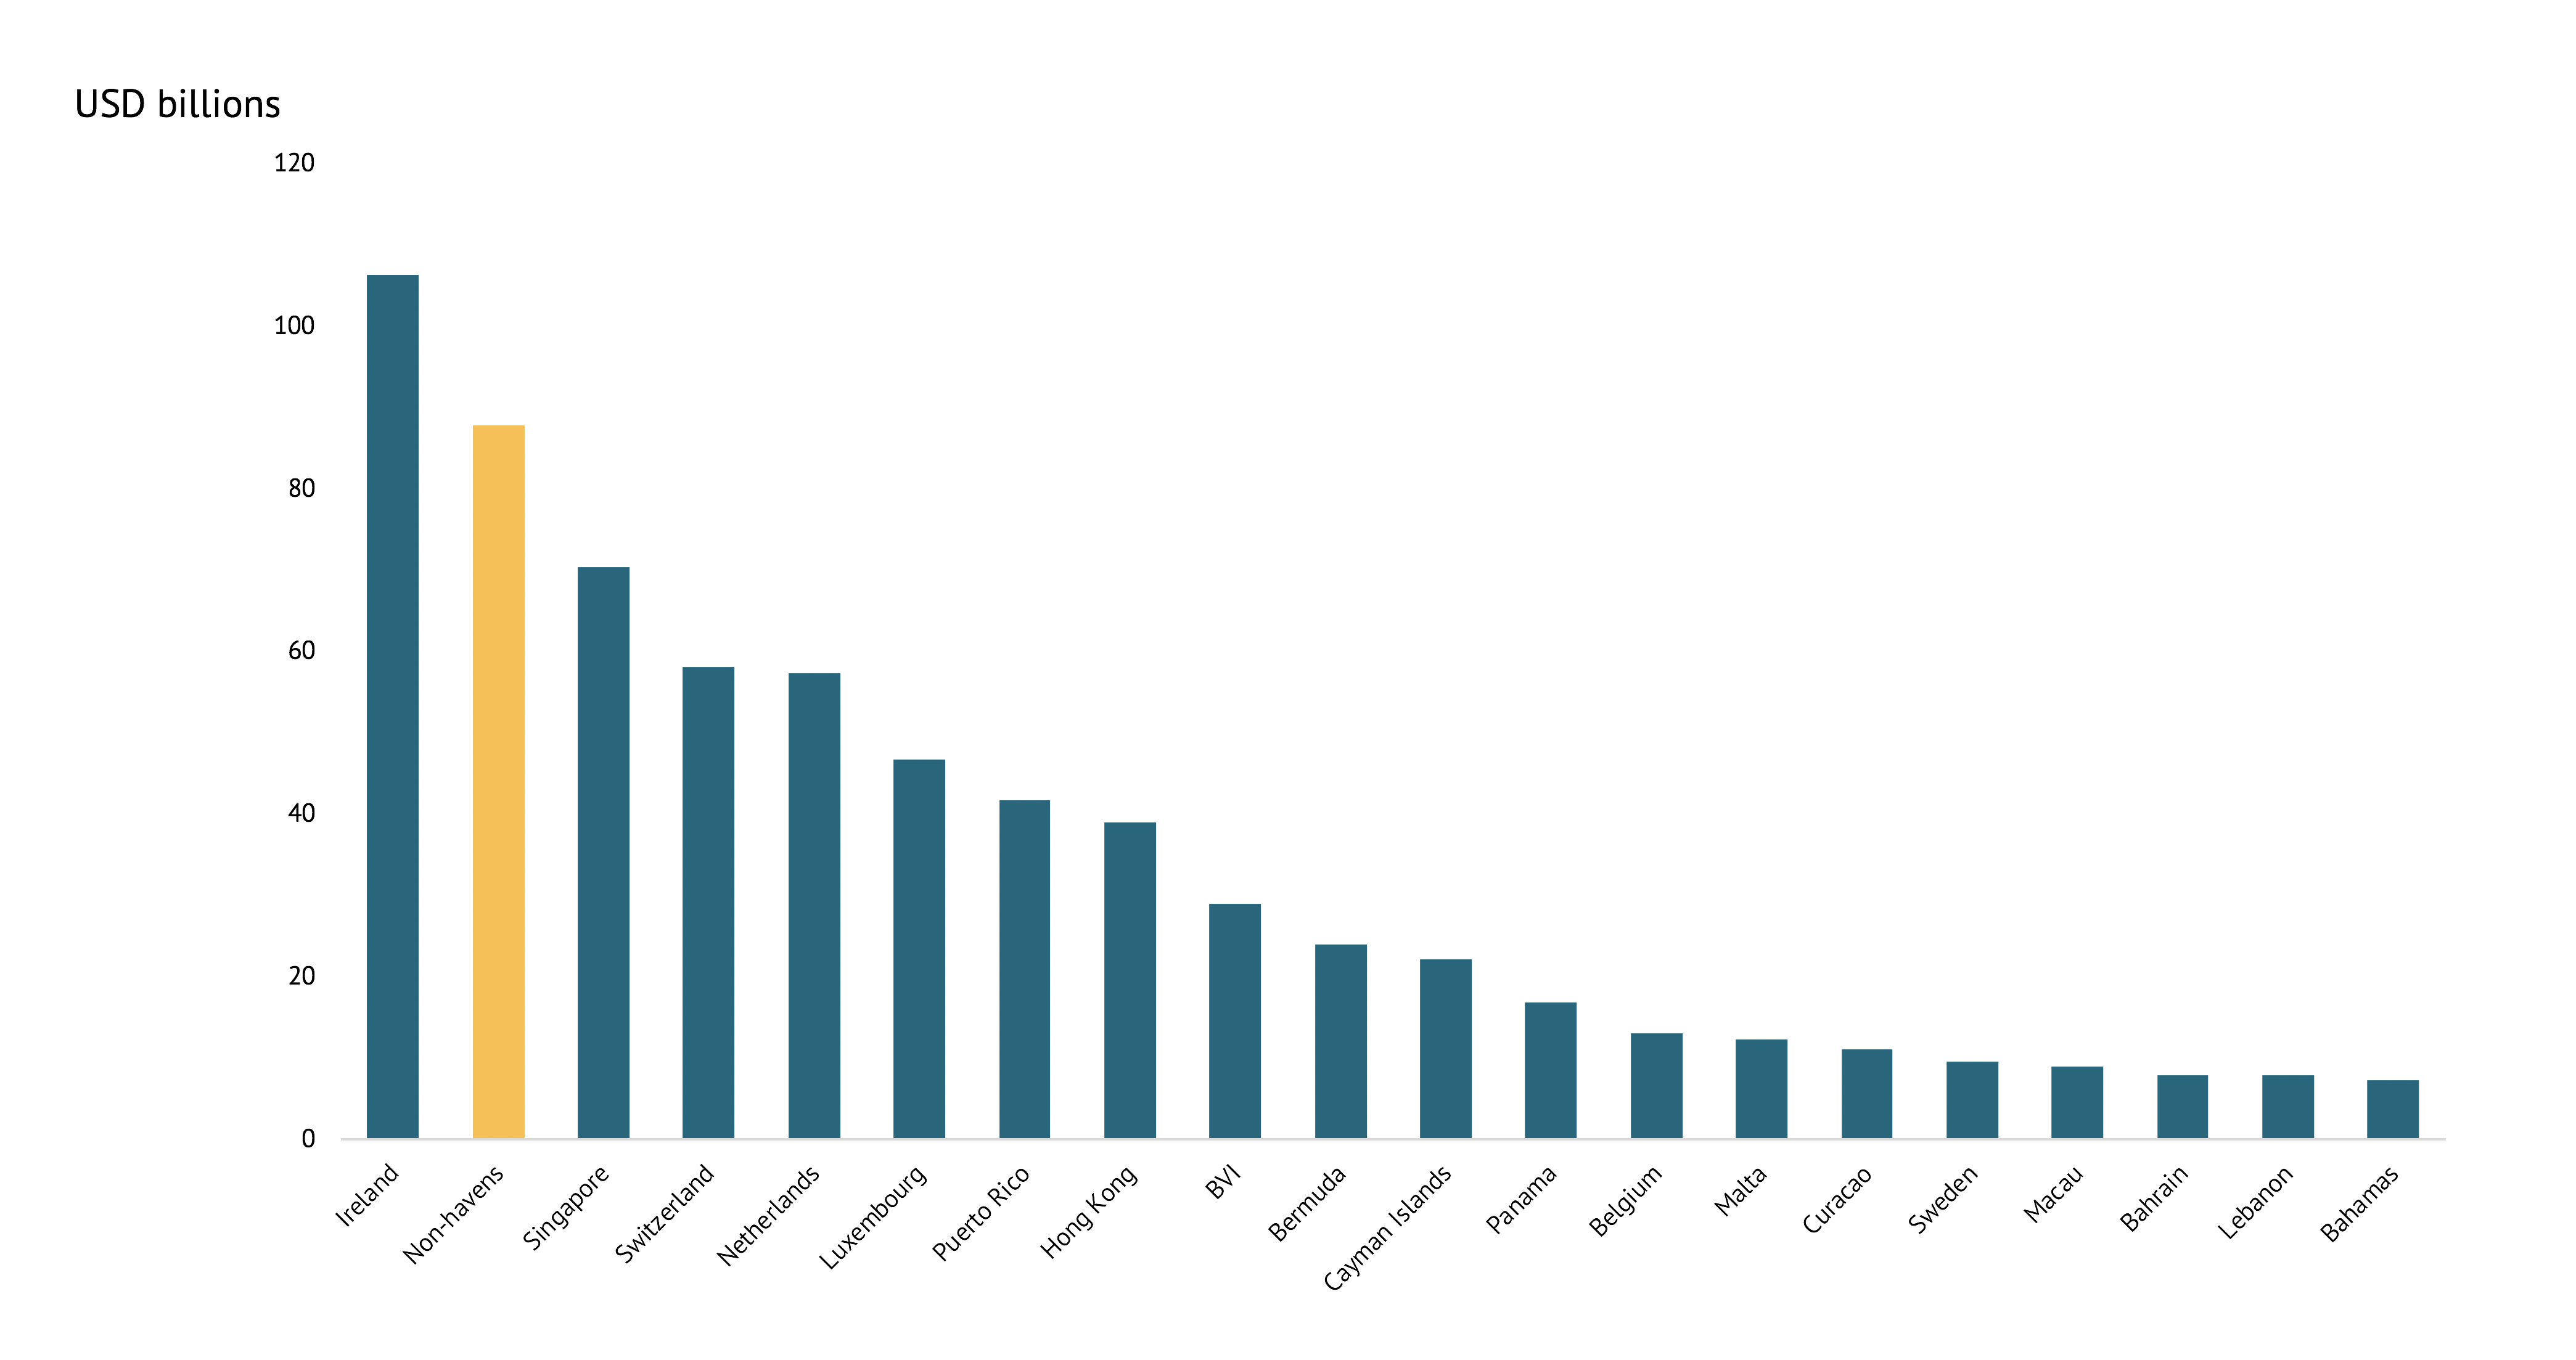
Based on Torslov, Wier and Zucman, 2018
The question of what these “excess” profits represent bears some further examination.
In their methodological appendix, TWZ describe them as representing artificial profit shifting. However, in practice there is no natural basis for allocating the profit of multinational corporations between different countries. For example, when a product is sold based on technology developed in one country, a brand developed in another, production in several others, and sales somewhere else, there is not one allocation of profits between jurisdictions that is naturally “right” and all others are “artificial.” Rather, there are a set of rules for allocating profits, a question of whether companies are sticking to these rules and countries enforcing them, and separately a question of whether we might argue for a different set of rules.
The current rules, based on the arms-length principle, call for profits to be allocated on the basis of comparable market-based transactions; thus a group’s retail operations might be expected to make a similar margin to a stand-alone retailer, buying and distribution might make the same margin as stand-alone wholesale trader, internal financing should make the same margin as financial services from an bank or insurer. In each case the ratio of payroll costs to profitability is likely to be different, depending on the labour intensity of the particular business activity.
For example, the clothing company Inditex (owner of the Zara chain) employs around 700 designers and around 100,000 retail staff (full time equivalents). Using the arms-length principle, the company would record larger profits in Spain (where most of the designers are) than in countries with mainly retail operations such as the UK and Germany. TWZ’s methodology does not consider such as difference in profit-to-payroll as artificial, since they don’t designate Spain as a tax haven, however they would consider profits attached to buyers based in Switzerland or brand managers in the Netherlands as artificial. Businesses are increasingly able to provide services across borders using digital platform, data, and algorithms; finance is an important business function which uses relatively few staff. It is not obviously artificial if profits accrue in the jurisdiction where these high profit-to-payroll activities take place; the question is how much profit should accrue there?
TWZ considers the volume of “excessive high-risk payments” (royalties, insurance, ICT, financial and management services) each of their designated tax haven country receives. These payments are judged to be excessive if they are out of proportion to the size of the overall economy, compared to larger economies. There is a close relationship between the volume of these excessive payments and the excessive profits based on the profits-to-payroll ratio.
Figure 4. “Excessive high-risk payments” and inward “shifted profits” ($m)

TWZ interpret this pattern as indicating tax losses in the country where products and services are ultimately consumed (i.e., Apple should be declaring more profit in Europe on its European sales). However, since the current tax system is not designed to deliver this allocation, it should not be surprising that this is not the result that is observed; it might equally be argued that more profit should be declared in California, where the technology is developed.
TWZ’s metric more clearly could be described as an estimate of the profits associated with intangible assets and finance that are managed in low-tax jurisdictions. This may or may not be artificially inflated (i.e., not compliant with the arms-length principle). The distinction matters because it determines whether revenues might be recoverable through stronger enforcement of current rules or whether the “lost revenues” identified reflect compliance with current tax rules.
Some of the apparently low-taxed or zero-taxed profits that show up in the study will already be subject to tax elsewhere through taxes and anti-avoidance mechanisms that go beyond transfer pricing. The study does not mention mechanisms such as withholding taxes (on interest, royalties, and service fees), tax treaties that allow for taxation of service imports under “permanent establishment” rules, and controlled foreign company regulations that bring foreign companies into the domestic tax system, and the effects of these anti-avoidance measures would not be picked up in its calculations. Withholding taxes can be particularly important mechanisms for developing countries as they do not require the capacity to undertake transfer pricing audits. Several of the jurisdictions that make up a high proportion of the “rest,” such as BVI, Bermuda, and Cayman Islands, do not have double tax treaties, so payments from non-tax havens would be subject to withholding taxes.
The headline finding from the study is that (prior to the BEPS reforms) excess foreign profits in tax havens were more than $600 billion (around 0.8 percent of GDP), with around 10 percent of corporate tax revenue ($180-200) lost due to profit shifting (or around 1 percent of government tax revenues overall, or 0.25 percent of GDP). This is based on statutory tax rates. If the calculation is done using effective tax rates the tax loss falls to 6 percent (or 0.5 percent of government tax revenues overall).
Given the caveats above about the extent to which excess profits represent defensible arms-length returns to real business activities, and the extent to which they include profits already taxed through CFC rules or withholding tax, these figures (around $180-200 billion globally) might be considered a high-end estimate, with recoverable revenues as some fraction.
The authors note that their estimate is right in the same ballpark as the OECD’s BEPS estimate that countries were losing 4-10 percent of corporate tax revenues, and that it is substantially smaller than the estimate by the IMF team of Ernesto Crivelli, Ruud de Mooij and Michael Keen and its reworking by Alex Cobham and Petr Jansky.
Figure 5. TWZ estimated tax revenue losses are enormously smaller than Crivelli et al./Cobham and Jansky (USD bns)

A key difference between this study and the methodology used by Crivelli et al. and Cobham and Jansky is that TWZ use data about the economies of each country and the existing scale of corporate profits. Crivelli et al. estimate a general relationship between GDP and tax rates and revenue losses, which generates startling figures such as Chad losing corporate tax revenues worth 8 percent of GDP, and Zambia 5 percent.
Crivelli et al./Cobham and Jansky’s figures for lost revenues suggest some 2.5 trillion USD in shifted profits. However, TWZ’s data on the overall level of profits recorded across all of the “tax havens” (several of which are also major economies in their own right) is less than half this, suggesting that these earlier studies are likely to be large overestimates (or that there are several trillion dollars of annual profits still unaccounted for).
What does the TWZ study show and not show?
TWZ’s data confirm what the BEPS project and subsequent work on taxing the digitalised economy were set up to address: that multinational companies have been able to structure their operations so that intangible assets and finance are managed in low-tax jurisdictions. They also find that the profits accrued in these places relate to interest, royalties, and fees rather than strategic transfer pricing (or mispricing) of goods and commodities.
Their data also confirms that the issue particularly relates to US companies (which are responsible for around half of the total estimated profit shifting overall, including the vast majority in Ireland).
Figure 6. Excess profits in Ireland by country of ownership of foreign subsidiary

However, the data itself does not answer the several-billion-dollar questions: should we think of this as revenues being lost by the countries where the intangible assets were created, or by the countries where the services based on them are consumed? Does the current situation reflect the design of the tax system, or companies abusing it? (and what better approach should be taken?) The question of how to “tax the digital economy” is the focus of international attention at the OECD as well as proposals at the EU.
It will certainly be interesting to see how these statistics develop over time, following the BEPS reforms and major changes to the US tax systems. But they should not be interpreted as uncovering a massive new source of revenue for developing countries.
Rights & Permissions
You may use and disseminate CGD’s publications under these conditions.