The inaugural UN World Data Forum, which wrapped up yesterday, saw the launch of the Cape Town Global Action Plan for Sustainable Development Data—a framework for governments, international organizations, and others to generate quality and timely data to measure progress towards the Sustainable Development Goals (SDGs). The Plan includes a number of actions around data disaggregation. We’re glad to see them, because the current level of disaggregation for SDG indicators is deeply inadequate.
The disaggregation of data undergirds the United Nations’ commitment to “leave no one behind.” In the 2030 Agenda for Sustainable Development, the UN recognized that measuring progress across all populations requires reliable disaggregated data. The Inter-Agency and Expert Group on Sustainable Development Goal Indicators requires disaggregation of SDG indicators, where relevant, by income, sex, age, race, ethnicity, migratory status, disability, geographic location, and other characteristics. (Phew!) All of this will undoubtedly require increased investments in data collection worldwide; current estimates stand at $1 billion per year.
For SDG indicators, disaggregation matters
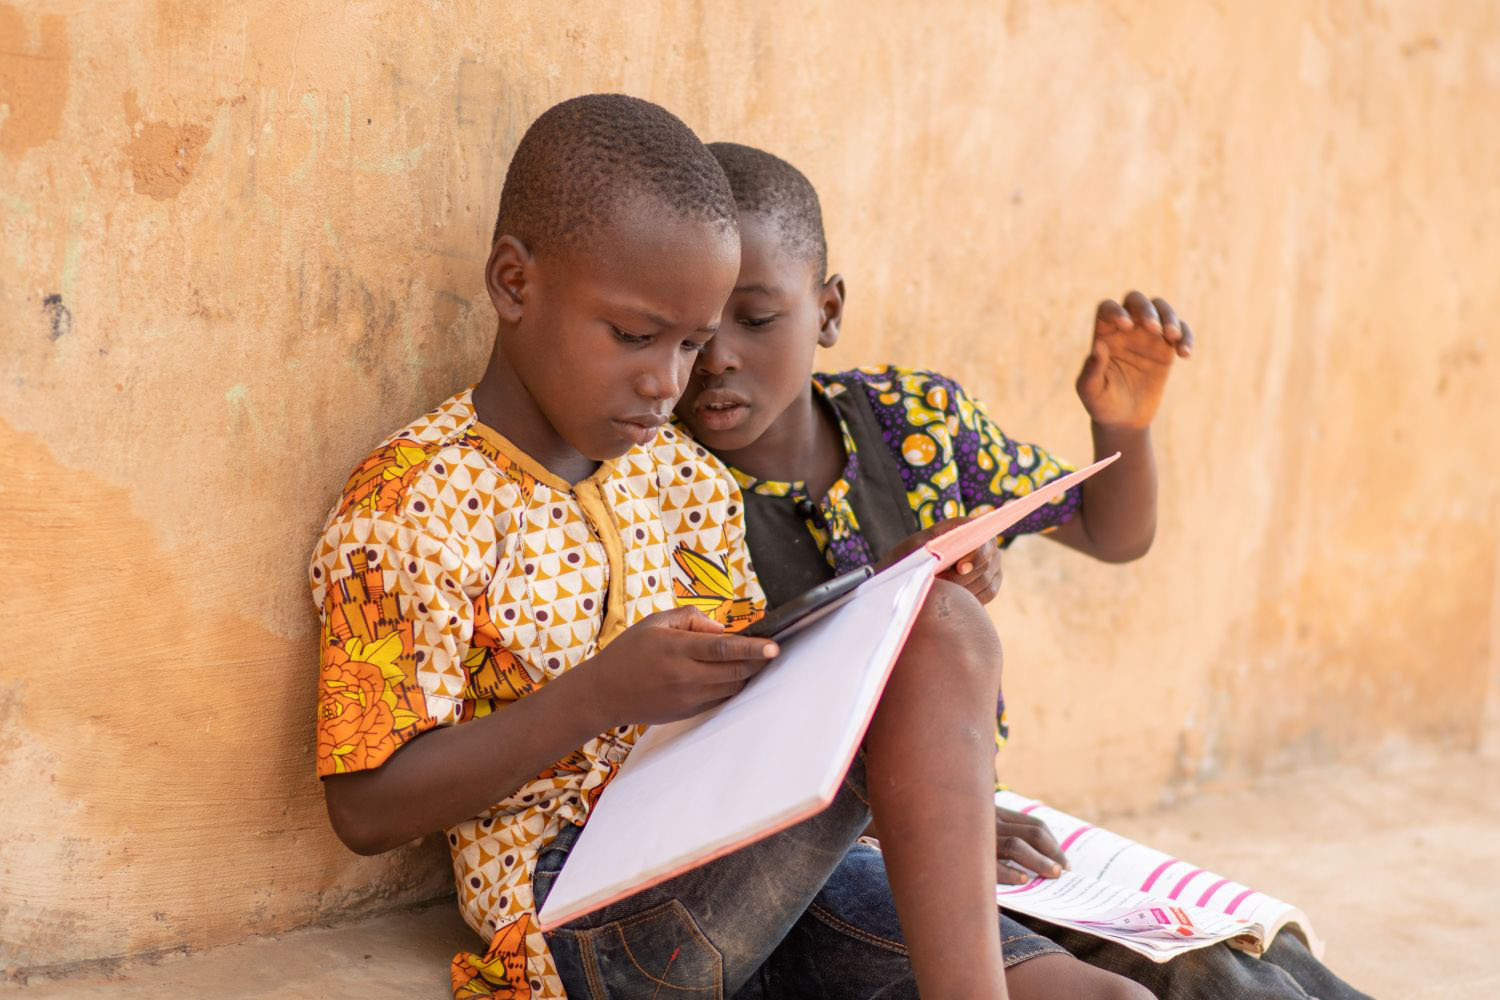
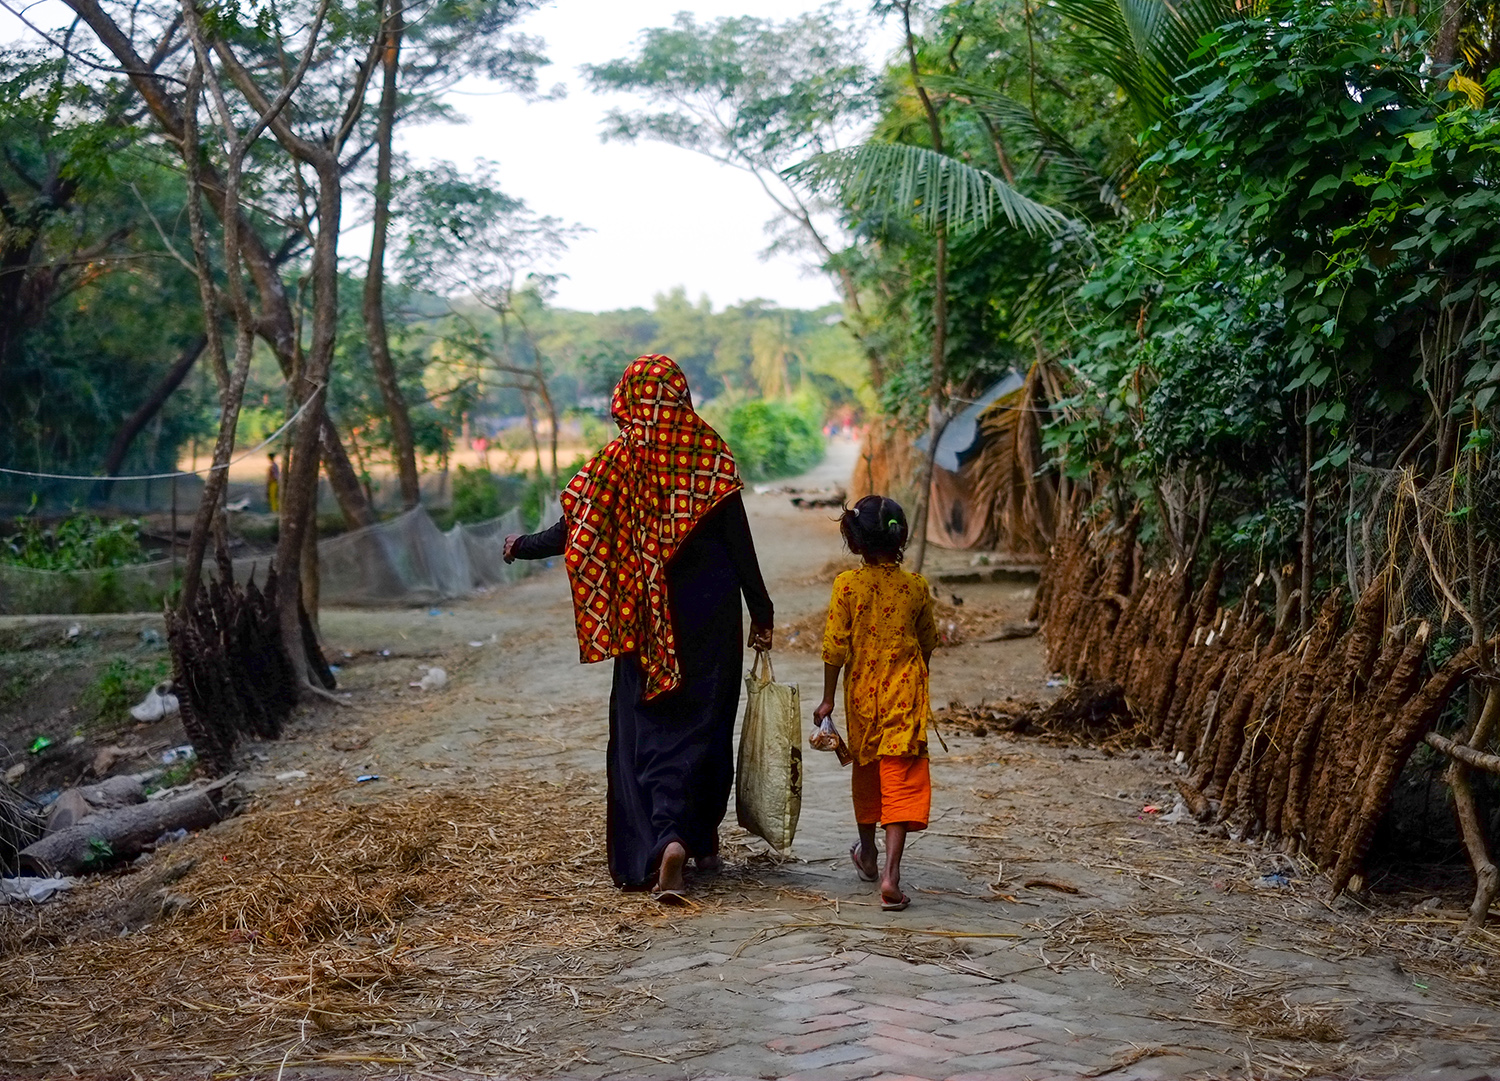
With such an enormous price tag on data collection, why does disaggregation matter? If “leave no one behind” is to be more than a catchy slogan, those of us tracking SDG progress need to pay special attention to the most vulnerable—women, youth, the elderly, and rural and migrant populations, among other disadvantaged groups. And paying attention to the most vulnerable requires data that zooms in on these groups in finer detail. National-level statistics only show aggregate improvements in poverty reduction, school enrollment, and access to clean water, for example. These aggregate statistics may mask much slower progress (or even decline) for populations that are harder to reach.
Along these lines, disaggregated data is key to effective policymaking. The Roadmap for Women’s Economic Empowerment (and CGD’s recent update to it, Revisiting What Works: Women, Economic Empowerment and Smart Design) make a compelling case for this point: what works for one demographic (like poor rural women) is unlikely to work for another (like adolescent girls). Because people face different constraints depending on their income, age, gender, location, and other factors, different groups will require tailored interventions that fit their circumstances. Disaggregated data not only allows us to keep tabs on who’s being left behind, but also helps us determine what is most effective in helping them catch up.
How are key indicators currently disaggregated?
Some of the work of disaggregating data is already underway, but there’s still a long way to go. The United Nations Statistics Division created a database of SDG indicators, a laudable step on the very long road to measuring countries’ progress towards the SDGs. There’s a lot to like in this database—it collects the SDG indicators in one place, with additional information on sources and the type of data. That said, most of the data seems to consist of a single data point for a single country. For some indicators (especially those that use national accounts data), this is enough. However, several key indicators will need to be disaggregated to be useful in tracking progress towards the SDGs.
Continuing our mission of scoping out and identifying gaps in data availability for the SDGs, we’ve taken a snapshot of indicators under key targets (most identified in an earlier CGD blog post by Casey Dunning and Molly Elgin-Cossart) and the indicators associated with them to gauge the extent to which disaggregated data is currently available.
Here’s what we found:
|
|
|
|
|
|
|
|
|
|
|
|
|
|
| 1.1 | By 2030, eradicate extreme poverty for all people everywhere, currently measured as people living on less than $1.25 a day | 1.1.1 | Proportion of population below the international poverty line, by sex, age, employment status and geographical location (urban/rural) | No | - | - | - | - | - | - | - | - |
| 1.1.1 | Proportion of employed population below the international poverty line of US$1.90 per day (the working poor) | Yes | - | ✔ | ✔ | - | - | - | - | - | ||
| 2.1 | By 2030, end hunger and ensure access by all people, in particular the poor and people in vulnerable situations, including infants, to safe, nutritious and sufficient food all year round | 2.1.1 | Prevalence of undernourishment | No | - | - | - | - | - | - | - | - |
| 2.1.2 | Prevalence of moderate or severe food insecurity in the population, based on the Food Insecurity Experience Scale (FIES) | Yes | - | ✔ | - | - | - | - | - | ✔ | ||
| 2.2 | By 2030, end all forms of malnutrition, including achieving, by 2025, the internationally agreed targets on stunting and wasting in children under 5 years of age, and address the nutritional needs of adolescent girls, pregnant and lactating women and older persons | 2.2.1 | Prevalence of stunting (height for age <-2 standard deviation from the median of the World Health Organization (WHO) Child Growth Standards) among children under 5 years of age | No | - | - | - | - | - | - | - | - |
| 2.2.2 | Prevalence of malnutrition (weight for height >+2 or <-2 standard deviation from the median of the WHO Child Growth Standards) among children under 5 years of age, by type (wasting and overweight) | No | - | - | - | - | - | - | - | - | ||
| 3.1 | By 2030, reduce the global maternal mortality ratio to less than 70 per 100,000 live births | 3.1.1 | Maternal mortality ratio | No | - | - | - | - | - | - | - | - |
| 3.1.2 | Proportion of births attended by skilled health personnel | No | - | - | - | - | - | - | - | - | ||
| 3.2 | By 2030, end preventable deaths of newborns and children under 5 years of age, with all countries aiming to reduce neonatal mortality to at least as low as 12 per 1,000 live births and under-5 mortality to at least as low as 25 per 1,000 live births | 3.2.1 | Under-five mortality rate | No | - | - | - | - | - | - | - | - |
| 3.2.2 | Neonatal mortality rate | No | - | - | - | - | - | - | - | - | ||
| 4.1 | By 2030, ensure that all girls and boys complete free, equitable and quality primary and secondary education leading to relevant and effective learning outcomes | 4.1.1 | Proportion of children and young people: (a) in grades 2/3; (b) at the end of primary; and (c) at the end of lower secondary achieving at least a minimum proficiency level in (i) reading and (ii) mathematics, by sex | Yes | - | ✔ | - | - | - | - | - | - |
| 4.2.1 | Proportion of children under 5 years of age who are developmentally on track in health, learning and psychosocial well-being, by sex | No | - | - | - | - | - | - | - | - | ||
| 6.1 | By 2030, achieve universal and equitable access to safe and affordable drinking water for all | 6.1.1 | Proportion of population using safely managed drinking water services | Yes | - | - | - | - | - | - | - | ✔ |
| 6.2 | By 2030, achieve access to adequate and equitable sanitation and hygiene for all and end open defecation, paying special attention to the needs of women and girls and those in vulnerable situations | 6.2.1 | Proportion of population using safely managed sanitation services, including a hand-washing facility with soap and water | Yes | - | - | - | - | - | - | - | ✔ |
| 7.1 | By 2030, ensure universal access to affordable, reliable and modern energy services | 7.1.1 | Proportion of population with access to electricity | No | - | - | - | - | - | - | - | - |
| 7.1.2 | Proportion of population with primary reliance on clean fuels and technology | No | - | - | - | - | - | - | - | - | ||
| 8.5 | By 2030, achieve full and productive employment and decent work for all women and men, including for young people and persons with disabilities, and equal pay for work of equal value | 8.5.2 | Unemployment rate, by sex, age and persons with disabilities | Yes | - | ✔ | ✔ | - | - | - | - | - |
| 11.1 | By 2030, ensure access for all to adequate, safe and affordable housing and basic services and upgrade slums | 11.1.1 | Proportion of urban population living in slums, informal settlements or inadequate housing | No | - | - | - | - | - | - | - | - |
| 16.9 | By 2030, provide legal identity for all, including birth registration | 16.9.1 | Proportion of children under 5 years of age whose births have been registered with a civil authority, by age | No | - | - | - | - | - | - | - | - |
Note: The database includes both SDG indicator series and additional indicator series. We included additional indicators series if no SDG indicator series were available. We also included multiple series for an indicator if there were discrepancies in the disaggregation level.
Overall, it’s clear that there’s a lot of work left to do. On indicators measuring poverty, undernourishment, access to safe drinking water, and access to electricity (among others) no disaggregated data is available. And even the better-performing indicators (2.1.2, food security; 8.5.2, unemployment rate) at most have data disaggregated across two metrics. None of the indicators we selected—meant to be representative of the bare minimum of “leaving no one behind”—has data that is disaggregated by income, race, ethnicity, migratory status, or disability status.
But the picture isn’t entirely bleak. There are a number of indicators with additional disaggregation available in source data, like 16.9.1 (proportion of children under 5 years of age whose births have been registered with a civil authority, by age). The UNICEF global database for this indicator disaggregates by location (urban/rural), gender, and income. Others, like 2.2.2 (prevalence of malnutrition), are sourced from household surveys like the Demographic and Health Surveys, which allow indicators to be calculated for more specific groups, like rural women, for sharper analysis.
Three steps to move data disaggregation forward
So what’s next if we want to make sure disaggregation efforts get a jumpstart where needed, while also avoiding wasting resources on less useful forms of disaggregation?
-
Prioritize. Given the hefty price tag on data collection and the fact that only 42 percent of indicators have an established methodology and accessible data, the global community needs to decide where it should invest its resources first. One model of prioritization comes from Data2X, which identified 20 “ready to measure” indicators that fit a set of criteria: focusing on women and girls relative to men and boys, measuring outcomes, measuring individual events, tracking progress in access to modern services and resources, and having an established methodology. The specific criteria depend on the goal at hand, but Data2X provides a model for criteria that can be applied to other goals.
-
But don’t cut corners. Key indicators such as the ones we’ve chosen above should be disaggregated across all metrics wherever possible (and logical). If we’re serious about leaving no one behind, we need to know how these (and maybe even additional) characteristics impact any given individual’s likelihood of being healthy and educated, accessing basic services, and living above the poverty line.
- Clarify key terms and definitions. The definitions used to disaggregate data also need to be clarified. For example, does disaggregation by geographic location refer to rural/urban lines? Or should we be examining outcomes according to region or sub-region? Similar questions arise elsewhere: when disaggregating by income level, should populations be separated into quintiles, or by different income brackets? Perhaps most importantly, there is little guidance on the Inter-Agency and Expert Group’s directive that disaggregation should occur “where relevant.” Who decides where disaggregation is “relevant,” and what factors should they weigh in making that decision? Greater clarity on these questions will help ensure that resources are allocated effectively.
DISCLAIMER & PERMISSIONS
CGD's publications reflect the views of the authors, drawing on prior research and experience in their areas of expertise. CGD is a nonpartisan, independent organization and does not take institutional positions. You may use and disseminate CGD's publications under these conditions.