Recommended
WORKING PAPER
The Decline of Education Quality in the Developing World
Tl;dr: We’ve updated our 2022 working paper with Laura Moscoviz on long run trends in education quality with several new surveys from around the world. Notably, a new survey round for India (NFHS-5) casts doubt on earlier data (NFHS-3). Dropping the suspect data, India’s current learning levels are unchanged (under 40 percent literacy for young adults who finished five years or school), but the starting point—especially for women—drops lower. The trend is still downward, but gentler than we previously thought.
The overall picture remains one of stagnation, at best
To recap, here’s the basic gap we tried to fill in our 2022 paper.
Globally, more kids are able to go to school than ever before in history, but we don’t really know what’s happened to the quality of the education they’re getting in terms of learning outcomes. For most developing countries, we have very little data on learning before the 2000s. That makes it hard to address some really basic factual questions about education policy. For instance:
- Were Vietnamese schools always good, or did some modern reform catapult them to the top of international rankings? (Pretty good since the ‘60s at least)
- What about the huge learning gaps between East and West Africa? Is that a recent phenomenon? (Again, no, Kenya and Tanzania have always outpaced Ghana and Nigeria, though the latter has fallen even further behind.)
- Do Indian schools today impart more or less learning than they did half a century ago, when they were limited to a more elite set? (Somewhat less, but more on that below!)
To answer those questions, we drew on literacy tests of adults who were born, and hence went to school, across several decades. Contemporary surveys of older people provide a window into the past.
The logic of our approach—which demographers and many other social scientists will recognize as a standard age-period-cohort model—is very simple. If, say, younger women show higher literacy than older women with the same years of schooling, we can tentatively conclude that either education quality is improving or people lose literacy as they age. If we have at least two surveys in different years, we can start to differentiate between those two possibilities, by looking at how literacy changes for women born in the same year over time. And if we have three or more surveys, we can start to build confidence that the trends aren’t just driven by one weird survey round.
The results of this exercise for 87 countries are pretty bleak. The general picture is one of stagnation and, in some big countries, decline. Read the full paper for more, but we want to focus here the biggest change in the 2023 update.
New data suggest India’s schools have indeed gotten worse, but maybe were never as good as we thought
Recently, The Economist published a chart featuring the steep drop in education quality that we estimated for India in our 2022 draft. The article was actually about Vietnam, but it provoked some heated commentary on Indian twitter, and an email from economist Jean Dreze— someone who knows Indian survey data better than almost anyone—noting that he’d read the paper, and thought the India results looked somewhat suspicious.
A stunning graph that should have made India sit up, but all eyes were on the moon at that time… pic.twitter.com/aKGU4w09AF
— Road Scholarz (@roadscholarz) September 4, 2023
We originally relied on two survey rounds for India: the third and fourth rounds of the National Family Health Survey (NFHS) from 2005 and 2015, respectively (earlier rounds only included self-reported literacy, not a literacy test). Fortunately, there is now new data to help settle the matter. Since we published that working paper, India has released data from NFHS-5, conducted in 2019.
The new data provide new reasons to doubt some of the old data. And ironically, that changes our findings not for the most recent years, but for the more distant past.
It’s useful to pinpoint what is changing across surveys. There has been some concern about the integrity of the NFHS-5 overall, and the shift in the sampling frame between rounds 3 and 4. But in some ways, all three rounds of NFHS we’re using look extremely consistent. Here, for instance, is the measure of schooling we use in the paper: the percentage of women who attained five or more years of schooling, by birth cohort. The surveys agree to an amazing degree of precision.
Figure 1. All survey rounds are remarkably consistent about the share of Indian women born in a given year who achieved 5 or more years of schooling
The bad news is that if we do the same thing for literacy, the picture is a lot messier. The literacy rate for women with four to five years of schooling, born in a given year, jumps around a lot across survey rounds.
Figure 2. But literacy rates for Indian women born in a given year, who achieved 4 to 5 years of schooling, look quite different across survey rounds
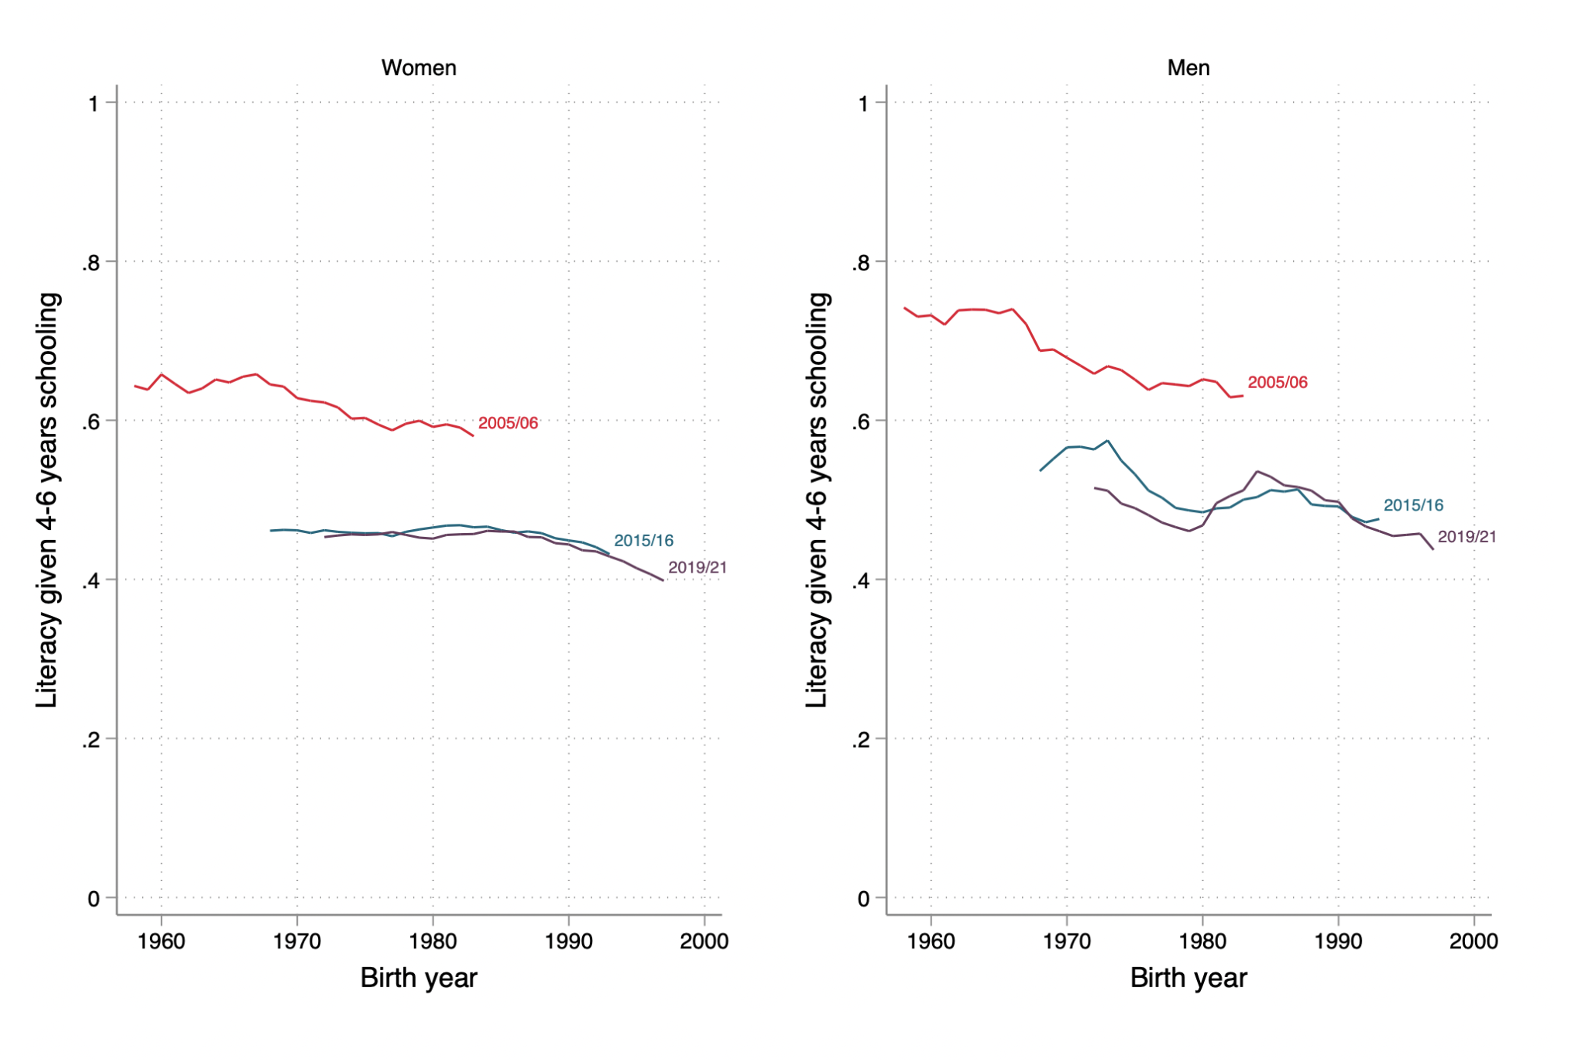
In principle, age effects can explain the big drop in literacy between 2005 (NFHS-3) and 2015 (NFHS-4). If people lose literacy as they age, the lines should indeed shift between survey rounds, showing lower literacy for, say, a woman born in 1970 when measured in 2005 and again a decade later. But if literacy declines so quickly with age in India, why did it stop in 2015? Suddenly everyone’s mental faculties appear immune to aging and the lines stop shifting. In that sense, the new 2019 data from NFHS-5 makes it hard to cling to the hypothesis that the earlier shifts were genuine age effects.
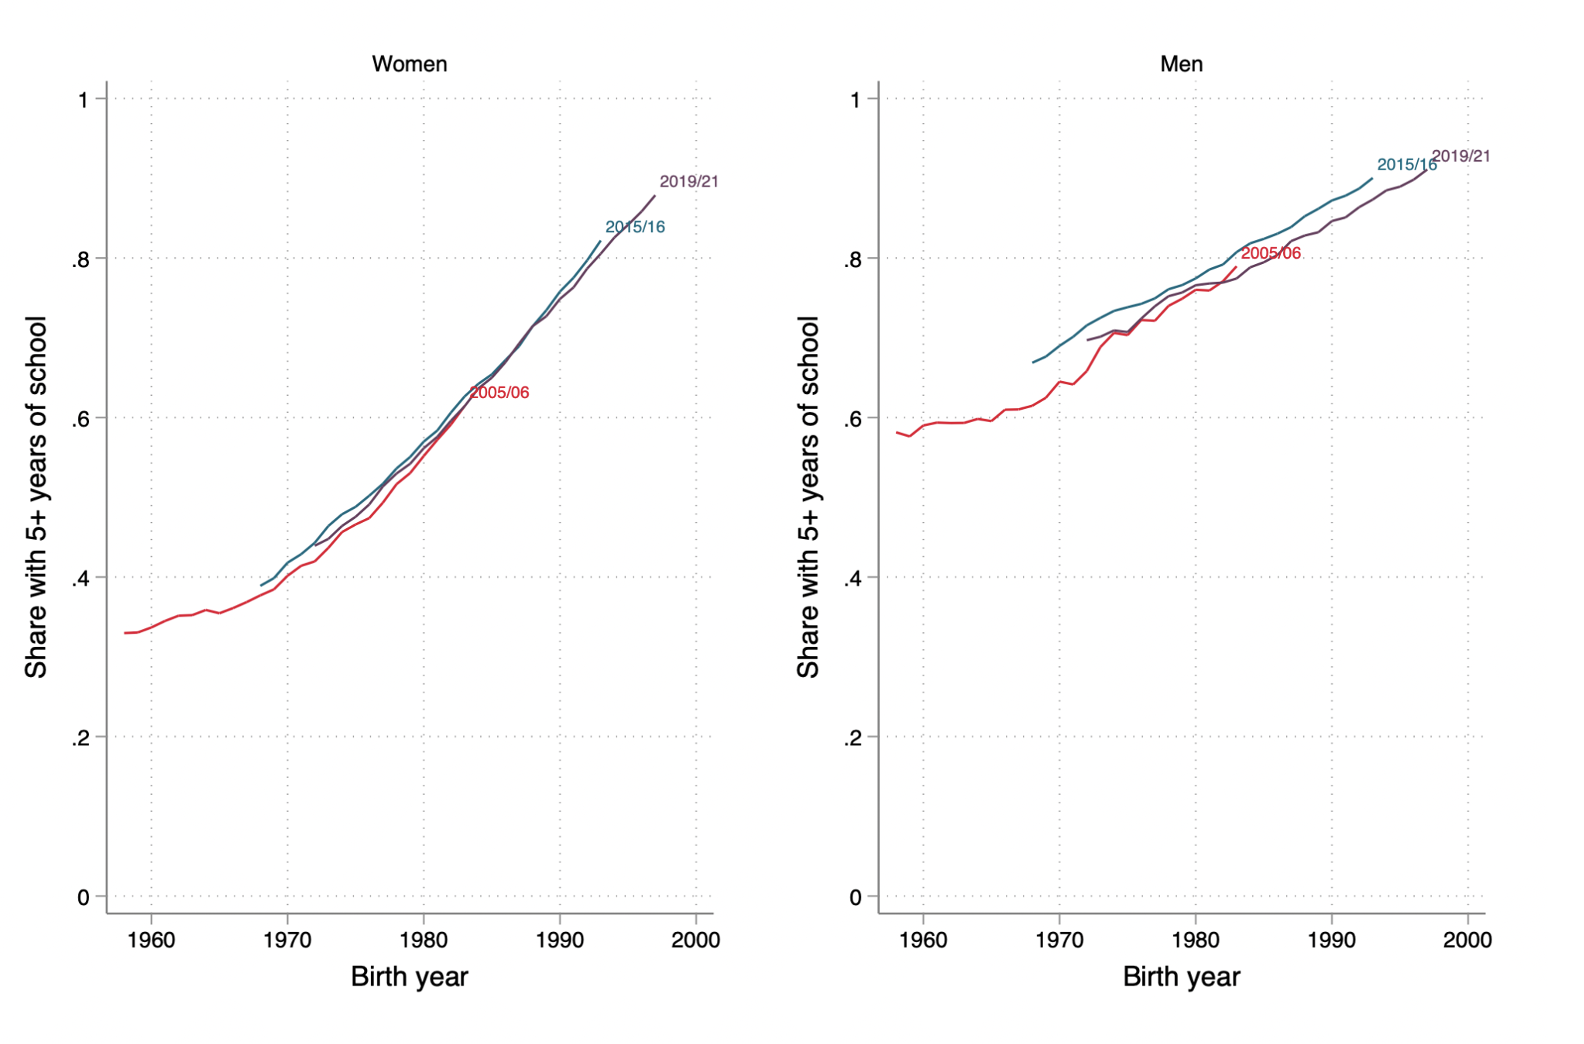
Now let’s turn to our final estimates of long-term trends, where we’re holding both age and schooling constant, and seeing how literacy compares across birth cohorts. (This is our definition of “education quality” in the paper.)
If we exclude the 2005 NFHS-3 data from the analysis, our estimates of the long-run decline of education quality in India look quite a bit different now, especially for women. The lines end up at the same point—i.e., low literacy conditional on five years of schooling today—but start from a much lower point in the late 1960s.
Figure 3. Long-run trends of literacy conditional on schooling in India change quite a bit if the 2005/6 survey round is omitted
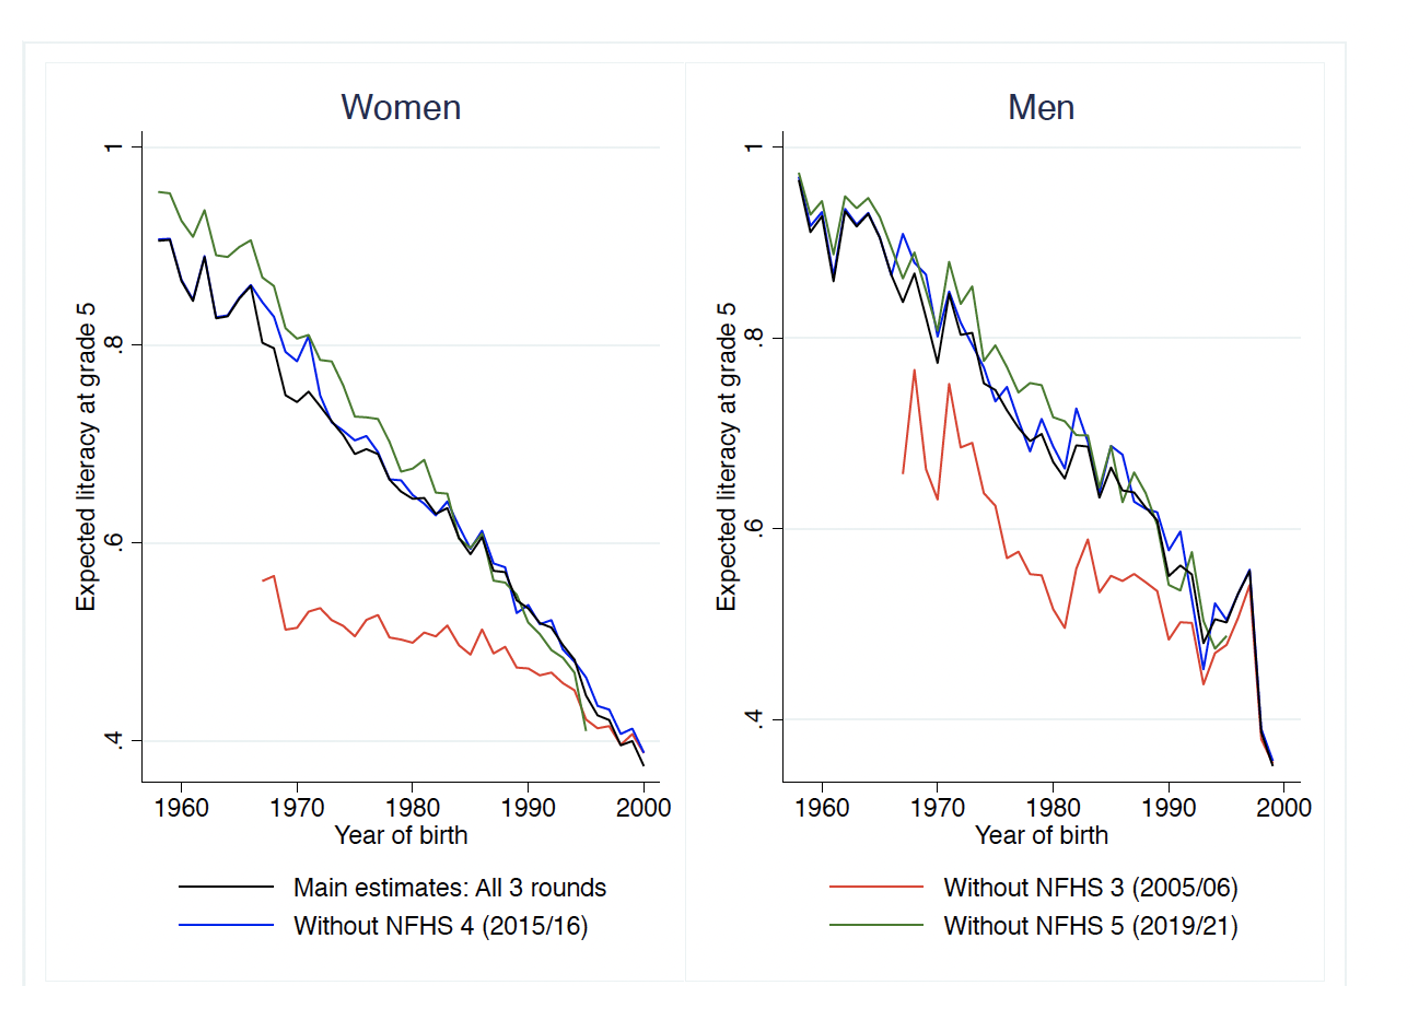
After much deliberation, we find the simplest explanation is that the literacy data in NFHS-3 is just measured somewhat differently, and in our revised working paper, we’ve incorporated NFHS-5 and decided to drop NFHS-3. This has the added advantage of producing more conservative estimates of India’s declining education quality. (This is conservative in the simple sense that since we’re making the claim that education quality in India has declined despite overall economic growth and development, we want to err to the side of understatement.)
If we’re right and NFHS-3 is off, it’s not just our education quality estimates across cohorts that require revision, but also simple, unconditional trends in literacy for India: NFHS-3 reported a national literacy rate of 55 percent for women, while NFHS-4 showed 68 percent.
India is not alone in its data struggles: we’ve also dropped some or all survey rounds from Albania, Belize, Honduras, and Nigeria, though India produces the most substantive and interesting revision.
For those interested, we have a longer appendix in the paper outlining everything above. Of course, we feel a bit sheepish about this update, but want to be transparent about how we incorporate new data as it emerges, and will continue to do so in future revisions. Finally, thanks to Jean Dreze for pressing us on the Indian data and to Thi Le for research assistance updating all the numbers.
A few postscripts…
A big flashing neon caveat
We spend a lot of time on this in the paper, but it bears repeating here: these trends are entirely descriptive, and will be influenced not just by the causal return to school, but also by changing patterns of selection into school and across grades. As enrollment has expanded, some new entrants have come in less prepared, and arguably the hurdle to progress to secondary school has fallen, which could both mechanically drive down learning levels for individuals with (only) primary schooling. In the paper we present some evidence that selection isn’t the whole story, but it’s far from definitive. We hope future drafts will include more formal bounds on selection effects. For now, establishing these descriptive facts alone has proved hard enough!
A note on Bangladesh
Several people noted on twitter that the data goes back to 1958 for Bangladesh, even though the country didn’t exist until 1971. That’s actually not a mistake, but it is a good reminder that our analysis uses no historical literacy data from East Pakistan or anywhere else circa the 1950s or ‘60s. Instead, we’re looking at the literacy of women born in the 1950s or ‘60s but observed in Bangladesh in the 1990s and 2000s. Think of this as a window into what education quality was like for Bangladeshi women before Bangladesh gained independence.
Replication materials
The website for the new 2023 version of the working paper has a link to the old 2022 version for anyone who wants to compare.
We’re also sharing data and code to replicate all the results in the paper.
- If you just want country-by-country results in a usable format, you can download an excel file with our latest estimates.
- A few brave souls will want to replicate our analysis from scratch. We’re posting a zip archive of Stata do-files. The code starts from the ‘raw’ DHS and MICS data files, which are freely available for download from USAID and UNICEF, respectively.
Topics
DISCLAIMER & PERMISSIONS
CGD's publications reflect the views of the authors, drawing on prior research and experience in their areas of expertise. CGD is a nonpartisan, independent organization and does not take institutional positions. You may use and disseminate CGD's publications under these conditions.