The next few posts on education are a bit unusual, in a good way I hope, but unusual entrants into the blogosphere. As part of the CGD initiative on education in the developing world and the pivot from schooling to learning, we are going to post links to and discussions of some of the new empirical evidence that is emerging. However, the new evidence on learning trajectories--the gains in skills/capabilities/knowledge as students progress through grades--both requires some common background and, to my view, challenges some of the fundamental assumptions about the schooling experience. So this first post describes a measure--the learning gain per year of schooling compared to a standard deviation of student mastery across students in a given year of schooling--that is intimately related to both the achievement of learning goals and to the fundamental design of schools. This puts the post somewhere between a paper reporting new results and describing results appearing in other papers.
As Mark Twain said: “It ain’t what you don’t know that gets you in trouble, its what you do know that just ain’t so.”
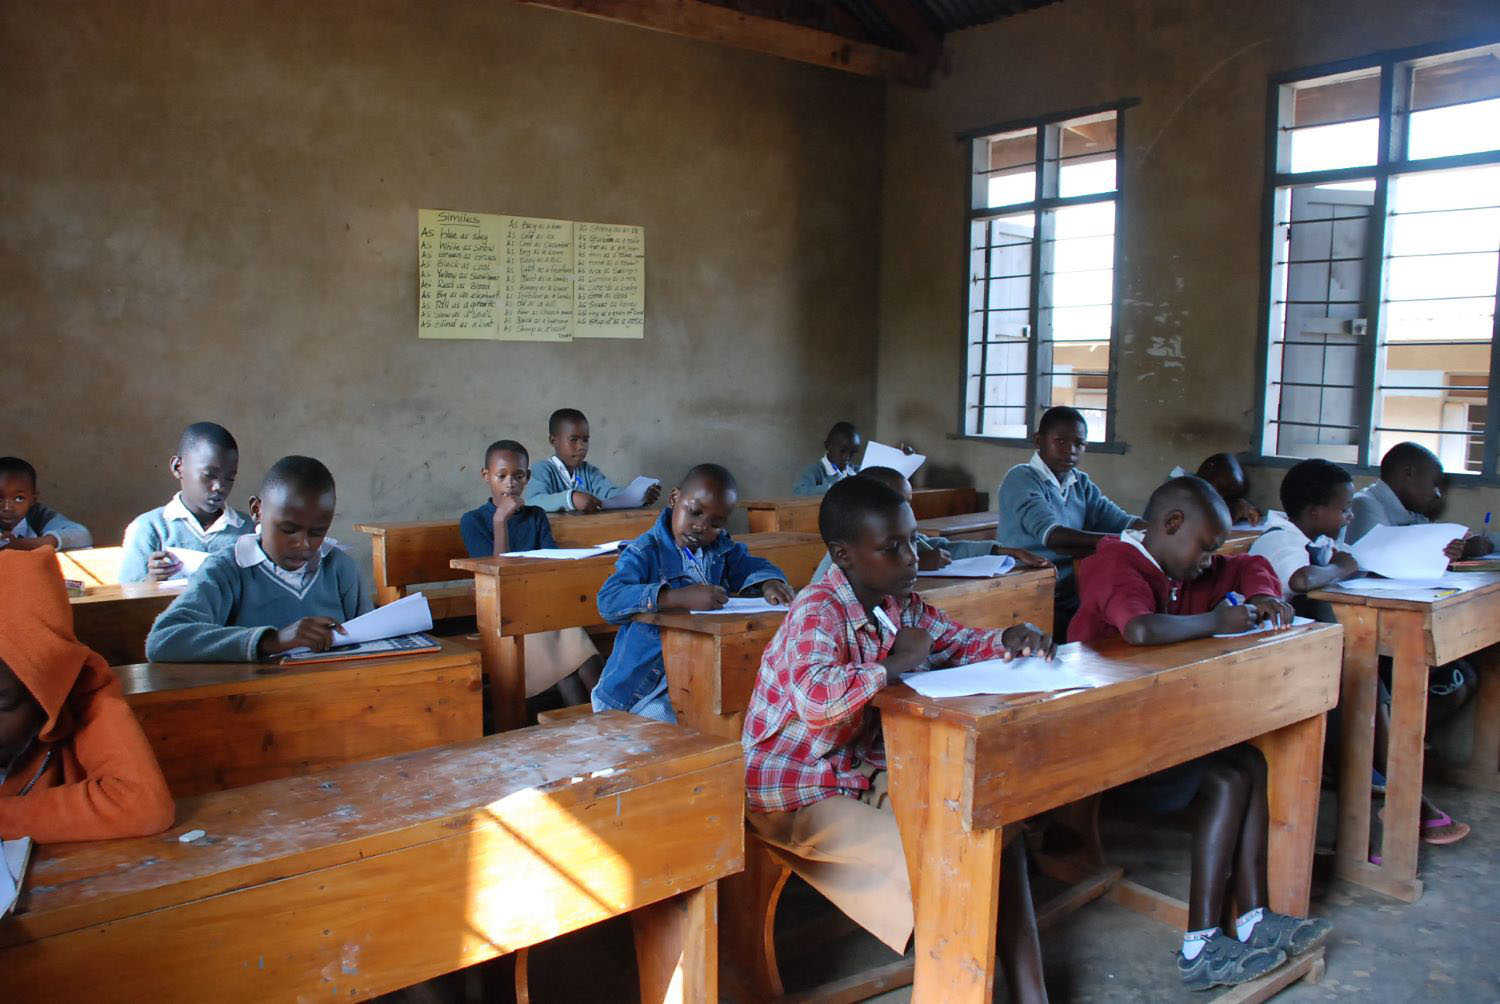
The entire structure of elementary schooling—from the physical layout of classrooms to the curriculum to the way teachers are assigned to a child’s school daily routine—is based on what a child having completed “Third Grade” (or “standard 3” or “level 3” ) means. What a third grade child does in school is learn the third grade curriculum and what a third grade teacher does is teach the third grade curriculum. The curriculum of schools is designed so that a child learns mastery of subject area concepts and skills and their applications in sequence so that third grade builds on second grade and prepares for fourth grade. This is premised on two perfectly reasonable ideas.
First, that concepts and skills are cumulative and are best mastered in a certain order. An excessively simple example: a child needs to recognize letters before they can read words and need to recognize and read words in order to understand sequences of words as sentences and be able to read sentences fluently (that is, at a minimum speed) in order to understand meaning, and so on.
Second, that group based instruction is effective (and efficient) when instructional groups have reasonable homogenous skill sets.
Curricular graded classroom instruction—the foundation of most schools—is therefore premised on knowing as an empirical fact that a child being in “third grade” or “fifth grade” conveys substantial information about their actual knowledge and skills. Tragically, increasing bodies of research suggest that in many developing countries what we know about “grade” just ain’t so.
The ratio of the gain in skill across grades to the dispersion of skill within a grade is central to what we mean by grade—and yet is often unmeasured. I show that when this ratio of gain to dispersion is low that “grade” means little or nothing in two empirically precise ways: (1) “grade completed” has little predictive power for measured skills/knowledge and (2) the overlap of skills/knowledge across grades is near complete so that “grade” does not represent an homogenous group for instruction.
Let me start with hypothetical examples using simulations to illustrate the ratio and its empirical consequences and then show that data from South Asia and Africa are consistent with very small ratios of grade gain to student dispersion.
So, suppose we have an agreed upon valid and reliable measure of student mastery of any curricular domain (e.g. reading, mathematics, science, history). We will assume that this measure of domain mastery has a Gaussian normal distribution and normalize the measure so that the standard deviation in that measure of curricular mastery across students in a given grade is 100. These assumptions imply that if the average score of third graders is 300 then the bulk of these students (68 percent) will have scores between 200 and 400 (and 16 percent below 200 and 16 percent above 400). Let us also assume that this measure has an average of 200 when a child is in first grade.
Now, suppose we measured on this same scale the mastery of children in grades 1 to 6. We could then plot the distribution of these scores grade by grade. What that would look like depends on the magnitude of the gain in mastery—what could be called learning—from year to year on this scale—hence relative to the (constant) student standard deviation. Figures 1a and Figure 1b show two possibilities. In Figure 1a the learning gain is 80 points per year and hence the ratio of gain in skills to dispersion of skills is .8 of a student standard deviation per year. In this scenario “being in third grade” means something—most third grades have greater mastery than the typical first grader but less than the typical fifth grader.
Figure 1a: Illustrative distributions of student capability across grades—learning gains large (=.8) relative to within grade student differences

Figure 1b is exactly like 1a (on the same scale) with the only difference being that the learning gain per grade is only 20 points per year—or .2 of a standard deviation. Now “being in third grade” is not very informative at all. A child in third grade that is at the lower end of typical performance (a student standard deviation lower, or the 16th percentile) has substantially less mastery that the first grade average (140 vs 200). Conversely, a child in third grade at the upper end of typical performance (a student standard deviation higher, or the 84th percentile) would have mastery much higher than the fifth grade average (340 vs 280).
Figure 1b: Illustrative distributions of student capability across grades—learning gains small (=.2) relative to within grade student differences

This can set up two empirical measures of what “grade” might mean and precisely how grade might mean little or nothing.
The first is the size of the predictive power of grade for skill mastery. Suppose I want you to guess whether or not a child has some skill—like reading a story of a given difficulty or doing three digit subtraction. Further, before you guess I will answer one question about the child—boy or girl, age, height, color of eyes, name, or, perhaps, grade completed. What is the best question to ask and how much does it improve your guess? Most people’s gut instinct, especially if they know the grade at which a given skill is taught in school, the grade completed is the best piece of information and knowing a child’s grade completed improves one’s guess a lot. That intuition is correct is the ratio of learning gain per grade to student dispersion within grade is large. But, if the learning gain is small compared to the students’ skill dispersion in a grade, then knowing a child’s grade actually helps little in predicting what they know.
The usual statistic to understand the predictive content of a piece of information it is (incremental) R-Squared: how much lower is my predictive error when I based my guess on X? R-squared varies from zero, where X means nothing, to one, where X reveals all. In our simple simulation above we can compute for each ratio of grade learning gain to student dispersion the R-Squared of knowing a child’s grade in predicting their concept/skill mastery. Figure 2 shows that is the gain per grade is small then grade means little or nothing for predicting learning. If the gain per year is only .2, then knowing a child’s grade improves one’s guess by less than 10 percent. If one “knows” that “grade matters” and based on that knowledge designs a school on the basis that “third grade” is informative for what a child in third grade can do and is ready to learn, then when learning progress is weaker than assumed the whole structure can fail.
Figure 2: If learning gain per grade relative to dispersion is low then knowing a child’s grade has little predictive ability for what they skills/concepts/capabilities they have (and hence are ready to learn)

The second measure of what grade means is the extent to which “grades” represent homogenous groups for instruction. Let me define by the “core” of a grade the level where the bulk of the students are. In this simulation let us for now define the “core” as students within a standard deviation of the average. We can ask: “how much does the core of one grade overlap with the core of another?” If progress from grade to grade is small, then the overlap is large, and if progress from grade to grade is large, then most students in a higher grade will have moved beyond those of a lower grade.
Figure 3 illustrates the notion of “core overlap” using grades 3 and 4 of the simulation with a learning gain per grade to dispersion of .2 (gain of 20, student standard deviation 100). In this case the “core” of grade 3 is 140 to 340 and the “core” of grade 4 is 160 to 260. Hence the overlap of the “core” in these adjacent grades is 160 (those at the lower end of grade 4 core) to 240 (the upper end of the grade 3 core) which is a range of 180 out of a core of 200. So 92 percent of the students in grade 4’s core were also in grade 3’s core.
Figure 3: The “instructional core” of grades has extensive overlap with previous grades if the progress per year is low

The essence of a sequenced grade curriculum is that each grade builds on what was learned in the previous grade. So by design some amount of instruction is review and deepening of mastery of previously acquired skills and some amount of instruction is introducing new material. But when learning progress is slow “third grade” ceases to mean anything as nearly all of what is done in “third grade” is known by both those in second grade and those in fourth (and fifth) grade.
Figure 4: Connection between overlap of adjacent grades “instructional core” and the ratio of learning gain to dispersion

In this first post, all I have shown are the arithmetically inevitable consequences of the relationship between the pace of progress in learning and the within grade dispersion across students. Nearly every aspect of the modern school is built on the presumption that the learning gain per year is large enough to make group grade based instruction on a sequenced curriculum an effective (and perhaps efficient) approach to teaching and learning. But if the learning gain is too low then everything that is “known” about the “right” way to do schooling may well be wrong. In my next blog, I’ll show that many strands of empirical evidence emerging from South Asia and Africa suggest that what we know just ain’t so.
Disclaimer
CGD blog posts reflect the views of the authors, drawing on prior research and experience in their areas of expertise. CGD is a nonpartisan, independent organization and does not take institutional positions.


