Recommended

The global debate around high-stakes exams is strongly influenced by research from high-income countries. That research emphasises who gets sorted into the “best” schools. An alternative perspective that hasn’t received enough attention takes exams as artificial bottlenecks that prevent many children from going to school altogether.
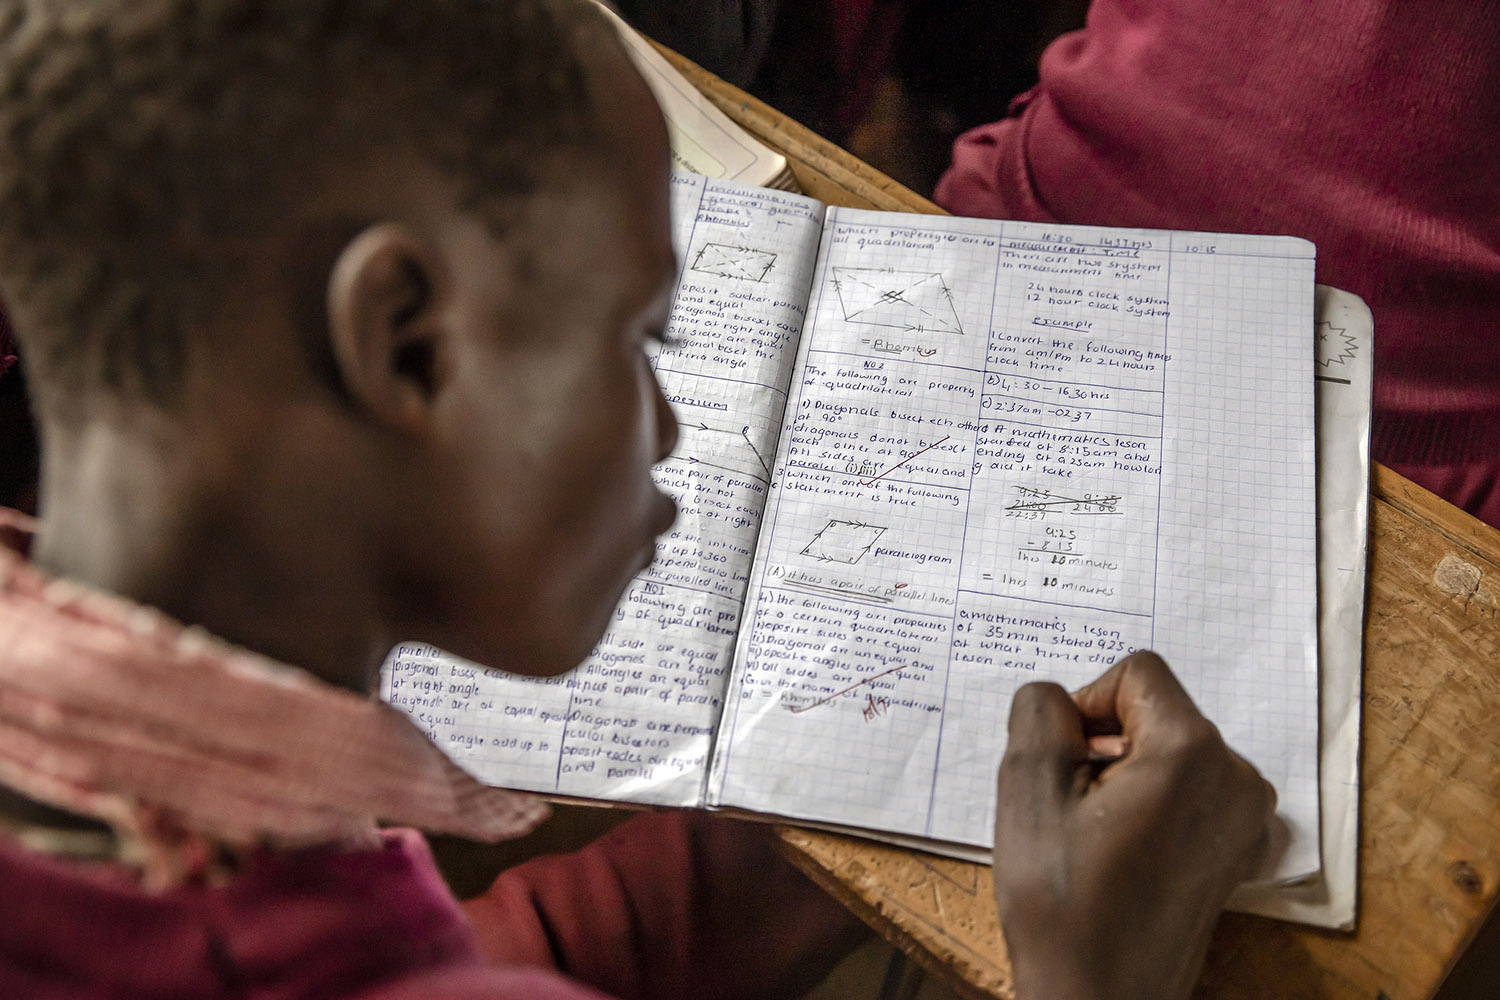
Exams play a central role in driving school dropouts in many lower-income countries. Students in 58 of 63 African and South Asian countries face two or more exams throughout their education, often determining their eligibility for the next level of schooling. But what is the cost of these barriers in terms of years of completed schooling and foregone future wages?
Evidence on this question is extremely limited. While demand-side factors for premature dropout are often investigated, the influence of exams on student progress is poorly understood. Questions remain about how enrolment responds to exam changes, how this relates to school supply, tuition fees, and so on.
Using our updated exams database we can begin to get a sense of the scale of the problem. We conduct a thought experiment to estimate years of schooling lost due to exam "pushout" (i.e. exam-driven dropout) and what that might be worth in terms of lost wages.
Our updated database covers more exams and provides new data on candidates and pass rates
We have expanded our database to include lower- and upper-secondary exams, along with data on the number of test-takers and pass rates. The update improves knowledge on the prevalence of high-stakes testing in Africa and South Asia.
Across the 53 countries with available examination performance data, 39 million students took high-stakes exams, with 10 million—roughly one in four students—failing. Primary school exams show lower failure rates compared to secondary schooling, yet still, about one in six children received a failing grade (Figure 1).
Figure 1. The fate of 39 million exam-sitters as they work towards a basic education
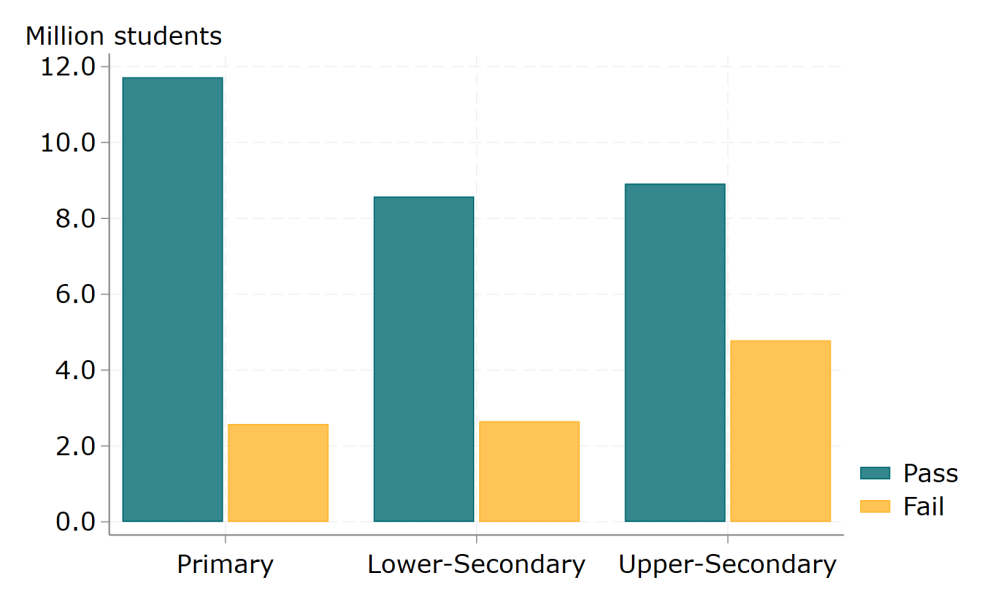
Note: we include data from the most recent primary, lower-secondary and upper-secondary exam for each country. Exam schedules and data availability mean that exams may come from different years. All info included in the source: CGD Database on School Exams.
Exam “pushout” could account for around a quarter of all post-primary dropout
To estimate the impact of exams on dropout rates and later outcomes, we first need to determine the share of post-primary school dropout that appears to be driven by exam barriers. We can do this by linking data on enrolment with exam characteristics and pass rates from our database.
We start with a cohort of 100 kids entering primary school and use household surveys to look at student flows at five points within each education system: from primary completion to upper-secondary completion. This allows us to observe the rate of student loss at each transition point. We can then use our database on public exam participation and pass rates to estimate the role that exams may play in that loss.
Exam pushout could account for 15 to 60 percent of student dropout that occurs after completing primary, but before completing secondary school (shown on the vertical axis of Figure 2). Our estimate for the proportion of dropouts driven by exams varies, rising from around 10 to 15 percent in Ghana, Senegal and Kenya, to over 50 percent in Namibia and Nigeria.
The total post-primary dropout rate also influences how exam pushout affects secondary school completion rates (shown on the horizontal axis of Figure 2). In Cameroon, nearly half of the children that complete primary will drop out before finishing secondary school. In contrast, only 20 percent of dropouts in Liberia or South Sudan occur after completing primary school, largely due to higher exit from school before children reach the end of primary school.
Figure 2. Exam “pushout” accounts for 15 to 60 percent of post-primary student exit
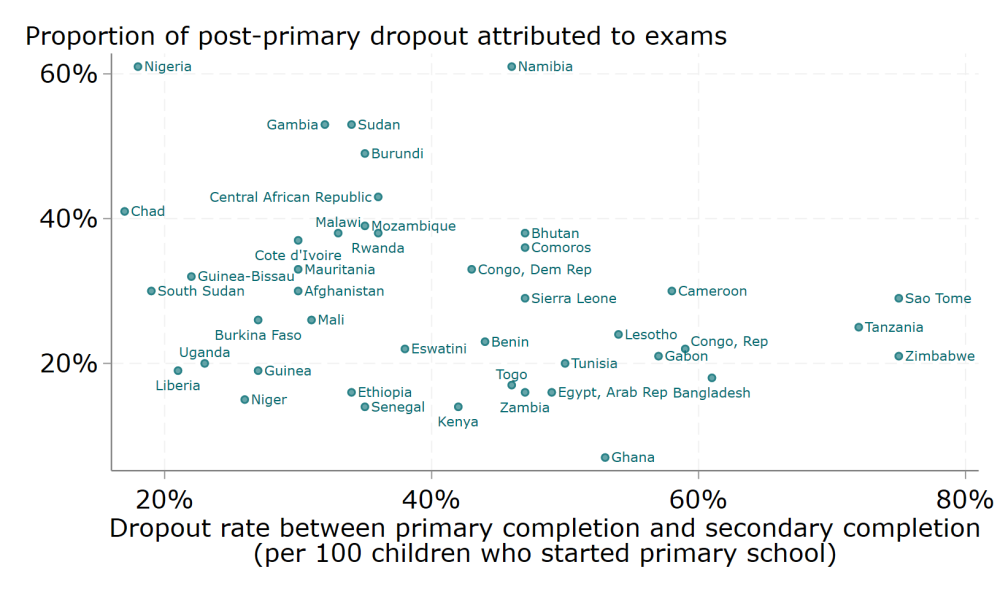
Source: authors’ estimates based on DHS and MICS surveys, and CGD database on school exams.
Exam-driven losses could be worth about 1 to 2 percent of GDP in low- and middle-income countries
We can produce a speculative estimate of economic cost, via the impact of dropout on wages. We use a simple model to evaluate this for 43 low- and middle-income countries.
For each country, wage losses depend on the role of exams in post-primary pushout (Figure 2), along with average wage levels, returns to secondary schooling, the number of students enrolled in and completing primary education and labour force utilisation rates. We can express the loss in reduced GDP, similar to methods used to estimate the economic cost of COVID-induced school closures.
Putting these pieces together, lifetime earnings losses among children currently in primary school may account for between 0.1 and 5.4 percent of GDP (Figure 3).
We can also put a speculative value on lost lifetime earnings as a percentage of current GDP for each country income group. In our sample, this value ranges from 0.9 percent in low-income countries (22 countries) to 1.1 percent in lower-middle-income countries (19 countries), and 2.1 percent in upper-middle-income countries (2 countries). These exam-driven losses amount to about 10-15 percent of the total earnings loss attributed to COVID-19 school closures.
Figure 3. Lost lifetime earnings caused by exam pushout, coloured by income level
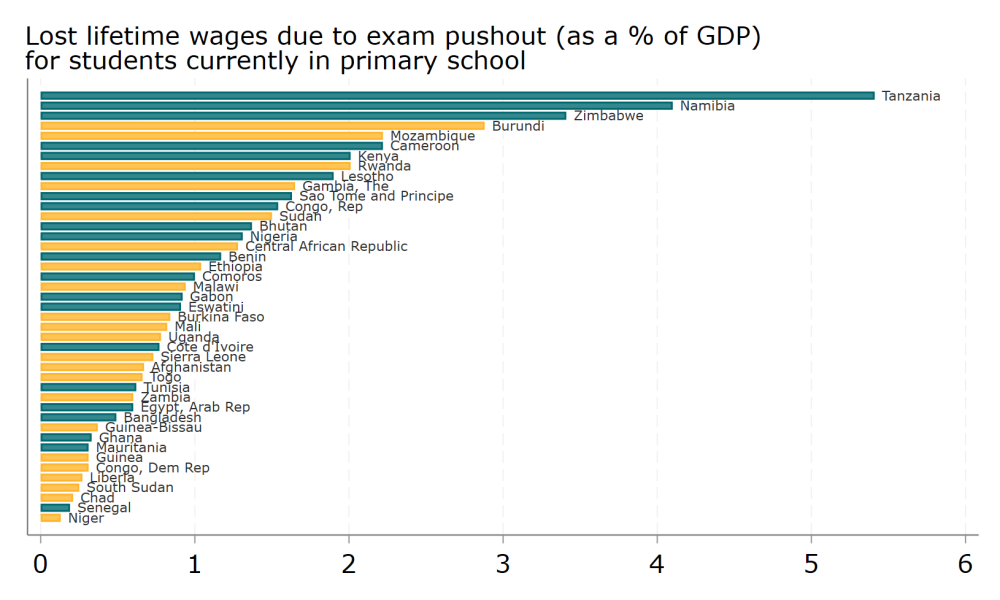
Note: Total loss per cohort of students is the product of individual losses and the potential number of future workers that is pushed out by an exam. Annual individual losses are a function of annual earnings, the number of years of schooling lost, and the return to each additional year of school. We convert a stream of future losses to present values over a working life with the rate of real growth (IMF’s 3.7 percent for Emerging Market and Developing economies, at the time of writing) and a discount rate of 3 percent. In estimating cohort level losses, we multiply individual losses by the number of students that complete primary school, adjusted for the share of primary completers who are pushed out by an exam. To account for the fact that not all individuals will work, we adjust this by the current labour utilisation rate in each country. Future primary school completing cohorts are assumed to face the same schooling and labour market circumstances as the current primary school completing cohort.
Exam reform may be about as effective as other educational interventions, and can operate at scale
A quick comparison with the World Bank's analysis on “How to Improve Education Outcomes Most Efficiently?” puts exam removal around the midpoint of the 150 studies included. It’s worth about 0.1 learning-adjusted years of schooling (LAYS), compared to a range of 0.02 to 0.19 LAYS for other studies.
But a major difference is that exam reform impacts the entire graduating cohort—tens or hundreds of thousands annually—rather than a study sample of a few hundred or a few thousand. It shares similarities with programs that have low individual impact but broad reach, such as providing information on education quality or improving school nutrition.
We need more investigation of how education systems respond when exams are changed
To reiterate: this is a thought experiment intended to shed light on the possible extent of exam-driven dropouts and their economic consequences. It does help us to picture where exams bite hardest, but a complete analysis is constrained by a lack of research and data on how education systems respond when exams are changed.
We do not account for the potential differences in outcomes if severely ‘under-prepared’ students are allowed into weak secondary schools. While evidence from Kenya indicates positive outcomes for marginal students admitted to secondary school, this might not be the case everywhere. That’s particularly true for students far from the pass/fail threshold, even though it could enable some currently excluded students to make valuable human capital investments.
Additionally, as more people acquire schooling or skills, some may expect the returns to human capital to decline. Primary education expansions show promising wage returns, even after market adjustments. Yet, this might not hold true for secondary school expansion, or in labour markets with low economic growth or substantial information and mobility barriers. And even if countries move away from high-stakes pass/fail exams, if the labour market values specific qualifications, dropout rates could remain high after important certification tests. These areas—along with a careful assessment of what it would take in terms of government budgets and teacher deployment—warrant further research.
Each year, tens of millions of kids take exams, and a significant portion will fail. Understanding the impact of exams on educational outcomes is vital for achieving global education goals in lower-income countries. Exam bottlenecks prevent many motivated children from continuing their education, and removing or improving these obstacles could greatly improve schooling levels and future outcomes.
Notes on assumptions
We have to make a few assumptions which are worth laying out.
- We assume that an exam failure means that a student will not, at a later date, progress to the higher level. This could be relaxed later.
- We assume that students who are no longer pushed-out will, on average, attend school for one additional year. We could, instead, think of these individuals as the same as the group that already travels through schooling and take an average from them. Better would be data on the enrolment response to exam reforms, which we do not have. An alternative might be to use enrolment response to something similar, like the removal of fees. Can all be explored later if of interest.
- If exams were not binding, but the labour market rewards specific qualifications rather than intermediate years of schooling, we may still see jumps in dropout after relevant choke points. This is an avenue for future research.
- We assume that those induced to attend more schooling will experience the same returns as the individuals for which returns are currently estimated.
- We use country-specific returns to each additional year of secondary school. Where these are unavailable, we follow Psacharopoulos et al., (2020) and take every additional year of schooling in low- and middle-income countries at 9 percent in additional future earnings.
- We accept temporal inconsistency between data sources. Reconstructing longitudinal participation profiles from cross-sectional data in household surveys is likely to overestimate enrolment for younger cohorts, relative to their older cohort peers. Equally, exam results change (although typically not that dramatically, and not in any particular direction) from one year to the next.
- We only estimate current lost wages—we do not begin to consider the steps, and the costs, required to realise such a change, i.e., the need to supply more teachers, more school buildings, etc.
Topics
DISCLAIMER & PERMISSIONS
CGD's publications reflect the views of the authors, drawing on prior research and experience in their areas of expertise. CGD is a nonpartisan, independent organization and does not take institutional positions. You may use and disseminate CGD's publications under these conditions.