



The International Development Assistance (IDA) arm of the World Bank provides concessional loans and grants to the poorest countries (largely). Most of its allocation (around 60 percent) is determined by a formula that includes population, income, and a composite indicator measuring concepts such as governance and project performance.
This formula is a defensible, transparent way to allocate development finance. But the weightings on the different components place a much lower emphasis on income than is warranted. Measured by GNI per capita, income is probably the best single measure of living standards across countries, and a dollar of finance can clearly have a bigger impact in countries where it is lower. Governance matters too but is hard to measure, and trying to quantify “governance” is subjective and involves arbitrary decisions on how to weight different aspects. But because of the relative weightings, slight changes to these scores outweigh huge changes in GNI per capita. The upshot is that IDA is not as poverty focused as it could be. Next IDA round, the weighting on GNI per capita should be at least doubled.
The “performance-based allocation” formula
IDA allocates its resources across various “windows” (that prioritise particular thematic areas such as refugee hosting countries or private sector initiatives) and country allocations. The latter accounts for the majority of IDA financing, and within that, most finance is allocated according to the “performance-based allocation” (PBA) formula. The share of IDA financing that is allocated via this formula has declined over the different IDA replenishment rounds (from 92 percent in IDA15) but is still 58 percent of the total, making it the most important determinant of which countries get what from IDA.
This has three components, population, GNI per capita (measured by the Atlas method), and “country performance rating” (CPR). The CPR is a composite index that captures both an array of measures of governance quality (which combined produce the Country Policy and Institutional Assessment, CPIA), and a measure of how well past projects have performed in the country (the Programme Performance Rating, PPR). It is included to reflect the argument that finance is likely to have more impact in countries with better governance (an argument dating back to Craig Burnside and David Dollar’s 2000 paper). Each dimension of the CPIA is given a score from 1-6, and these are weighted and averaged to produce the total. Most of the weight (68 percent) is on the “Public Sector Management and Institutions” cluster (cluster D), which includes components like “quality of budgetary and financial management” and “quality of public administration.”
These three elements are then multiplied together, but with exponents on GNI per capita and CPR of -0.125 and 3 respectively.
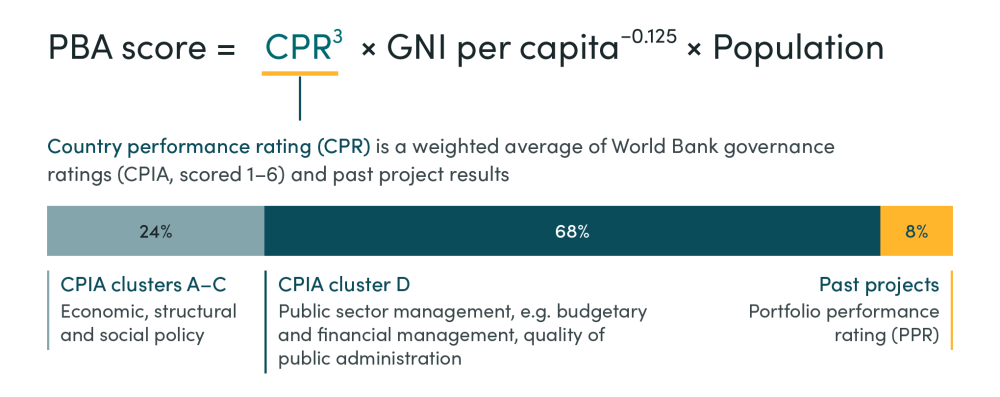
The allocation that each country receives is then proportional to the PBA score, on top of a “base” allocation of 15 million special drawing rights, an IMF asset (around 20 million USD) so that smaller countries don’t receive an allocation too small to actually deliver anything. There are further tweaks that mean that the ultimate allocation differs slightly—some larger countries have their allocations capped, while others receive nothing because they are in non-accrual status (they are not repaying past loans)—but the above formula captures the core logic of the country allocation.
CPR affects formula much more than GNI per capita
The difference between an exponent of -0.125 and 3 is huge. In the FY25 allocation document, GNI per capita spans from $230 (Burundi) to $20,360 (Guyana), yet the -0.125 exponent flattens that range: income’s contribution to the PBA formula moves only from 0.5 to 0.3, a 40 percent difference. By contrast, CPR spans from 1.58 (Eritrea) to 3.97 (Samoa), but the exponent widens that into a contribution of 4 to 62—a 16-fold difference. The PBA score is therefore dramatically more sensitive to CPR than to income.
Imagine that there are only two hypothetical countries (A and B), each with identical populations of 100, CPR scores of 3, and an income of $230. Each would have identical allocations. Now, imagine that country A’s income increased 10-fold, to $2300. This would reduce its allocation by a mere 14 percent (from 50 to 43 percent). That’s remarkably little for a country whose income is now ten times higher than the other country competing for the allocation. Country B would only need to increase CPR by around 0.3 (against its total value of 6) to have the same impact on the allocation (table 1).
Table 1. Impact on allocation of CPR changes versus GNI per capita changes
| Population | CPR | GNI per capita | Share of PBA | % change | |
|---|---|---|---|---|---|
| Baseline | |||||
| Country A | 1 | 3 | 230 | 0.5 | - |
| Country B | 1 | 3 | 230 | 0.5 | - |
| Scenario 1 | |||||
| Country A | 1 | 3 | 2300 | 0.43 | -14.3 |
| Country B | 1 | 3 | 230 | 0.57 | 14.3 |
| Scenario 2 | |||||
| Country A | 1 | 3 | 230 | 0.43 | -14.3 |
| Country B | 1 | 3.3 | 230 | 0.57 | 14.3 |
Note: This is ignoring the effect of the base allocation, so each percentage change will be slightly lower, with exactly how much depending on the size of the base allocation relative to overall budget.
Ghana case study
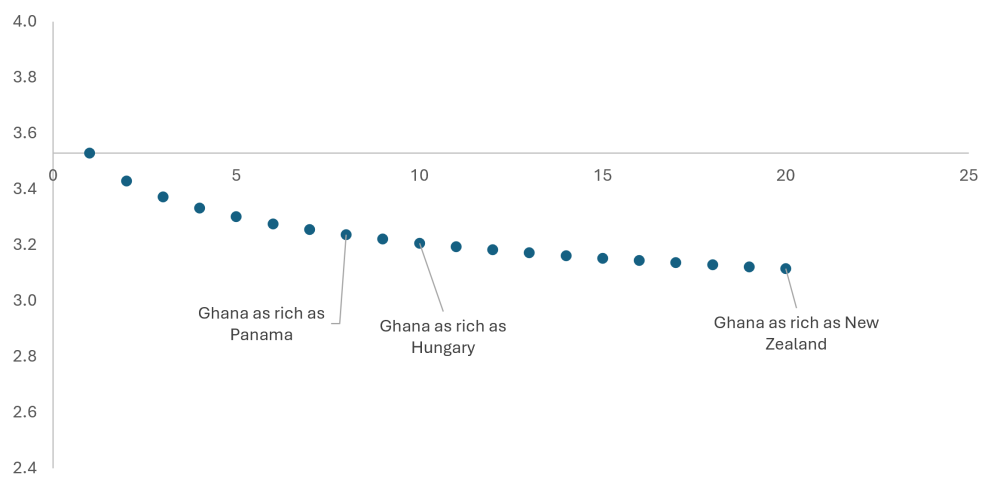
The same applies in actual allocations. I used the data published by the World Bank on the formula and see how changes to CPR and GNI per capita would impact allocations. The exact changes will depend on the country (with small countries being less affected, because the fixed base allocation will be a higher share of their total allocation). But below we use Ghana as an example to illustrate the impact of changes to CPR and GNI per capita. We consider increases in GNI per capita from “merely” doubling to twenty-fold increases, well beyond plausibility. Figure 1 plots the changes in CPR that have the same impact on allocation as a X-fold increase in GNI per capita.
If Ghana’s CPR fell to that of the Tajikistan (a fall from 3.53 to 3.12), its allocation would decline as much as if it became as rich as New Zealand (an increase from $2,340 as of the FY25 allocation document to $46,630). There is no doubt that Ghana is significantly better governed than Tajikistan, which is an authoritarian regime that struggles with systemic corruption. But no sensible, needs-based formula would allocate any concessional finance to New Zealand.
For CPR to have the same impact as an 8-fold increase in income (which would make Ghana about as rich as Panama, and richer than several OECD members such as Chile), it would need to fall to 3.24, a similar level to Vanuatu. This is remarkable given that by some indicators, Vanuatu is better governed than Ghana. In other words, that fall in CPR is essentially within the margin of error, and yet it has the same difference to the allocation as catapulting Ghana to high-income status.
Figure 1. Decline in CPR required to match same impact on PBA score as X-fold increase in GNI per capita
Source: IDA FY25 Allocation, World Bank Data
This would be less of a problem if the IDA threshold was taken more seriously. Officially, countries graduate from IDA at $1,365. Below this threshold, all countries are evidently poor, and measurement of GNI per capita itself is very noisy, and so it is more defensible to put greater weight on CPR. But as colleagues have discussed, this threshold is no longer meaningful in determining which countries receive allocations. More than half of IDA’s allocation in FY2025 was for countries above that threshold, and a substantial gap has emerged between countries that have an income higher than the threshold, and those that have graduated from IDA support. Guyana is nearly 10 times richer than Ghana (and nearly 90 times richer than Burundi) but still receives a per-person IDA allocation double Ghana’s (and nearly double that of Burundi).
Are governance scores consistent across institutions?
Even if you thought that the CPR was a much better indicator of whether aid will be effective than GNI per capita (and the evidence is not supportive), its weight in the formula still doesn’t make sense given how hard it is to measure. The largest part (92 percent) of the CPR is the CPIA, which attempts to turn complex concepts such as “quality of public administration” into a crude numerical scale, which is inevitably subjective.
One way of demonstrating this is by comparing the CPIA scores to metrics produced by other institutions, such as the African Development Bank (AfDB), which aim to capture similar concepts. The correlation between the CPIA produced by IDA and AfDB is 0.95, suggesting a lot of agreement, and the average difference between the scores is only 0.14. This might sound small, but even that difference becomes highly impactful given the difference exponents on CPR and GNI per capita.
Consider Ghana again. A 0.14 increase in CPIA would lead to an increase of 0.129 in the CPR (given the 92 percent weighting on CPIA). This would lead to an 11 percent increase in Ghana’s allocation. This is the equivalent impact as a collapse in GNI per capita, of nearly a 60 percent decrease. Measurement noise from CPR dominates GNI per capita in the PBA allocation.
Small changes in weight have big impact
One source of subjectivity in the CPR figures comes the weights from which the different components are combined. The weights of 24 percent on CPIA clusters A-C, 68 on CPIA cluster D, and 8 percent on PPR might be defensible but there isn’t much evidence underpinning them, and given the exponent on CPR, the allocation becomes sensitive to their exact value. The CPIA clusters are well correlated with each other (Pearson’s coefficient of 0.72) and so the relative weights on them matter less, but neither are well correlated with PPR, and so changes to the balance between CPIA and PPR can have a large impact.
Take two hypothetical countries again, with equal population, GNI per capita and CPR. Now, imagine that their CPR scores are constructed from the CPIA/PPR scores given in table 2, and that 0.01 is taken from the weight of each CPIA component and added to PPR, to give weights of 23 percent, 67 percent, and 10 percent. Qualitatively this new set of weights is essentially the same: there is no objective basis for saying that the PPR weight should be precisely 8 percent. For our hypothetical country A, this change in weights would decrease its allocation by 2.9 percent. To achieve the same impact by changing GNI per capita, it would have to increase by 60 percent.
What about a more substantial change? A key part of the reason behind the CPR term is past evidence that shows that aid has more impact in well governed countries. While CPIA is measuring conditions that could lead to projects being more successful, PPR is measuring whether projects have actually been successful and so it would be reasonable to assign it a much higher weight. Let’s say that the PPR weight is increased to 30 percent, and the CPIA weights reduced proportionally. Now country A’s share would be 25 percent lower, which would require a preposterous 60x increase in GNI per capita to achieve the same result. Choosing between two perfectly reasonable sets of weights shouldn’t have as much difference as that between Burundi’s and China’s income.
Table 2. Impact of changes in CPR weights on allocation
| Country Details | CPIA(a-c) | CPIA (d) | PPR | GNI per capita | Population |
|---|---|---|---|---|---|
| Country A | 4 | 2.75 | 2.125 | 240 | 100 |
| Country B | 2 | 3.2 | 4.3 | 240 | 100 |
| Weights | CPIA (a-c) | CPIA (d) | PPR | CPR, Country A | CPR, Country B | Country A's share | GNI pc increase that has same impact: |
|---|---|---|---|---|---|---|---|
| Current | 0.24 | 0.68 | 0.08 | 3.00 | 3.00 | 0.500 | - |
| Alternative 1 | 0.23 | 0.67 | 0.10 | 2.975 | 3.03 | 0.485 | 60% |
| Alternative 2 | 0.18 | 0.52 | 0.3 | 2.79 | 3.31 | 0.375 | 5943% |
Stop letting CPR noise drown out the GNI per capita signal
The IDA PBA allocation has two mechanisms by which it ensures a poverty focus: the income threshold that means that only poor countries receive an allocation, and the inclusion of GNI per capita in the formula. Neither are working as intended: the threshold is no longer a good predictor of which countries graduate from IDA eligibility, and the exponent on GNI per capita in the formula is so low that noise in CPR measurement drowns out any signal. As a result, the per-person IDA allocation in FY2025 is actually negatively correlated with poverty rates (-0.25 when using the $3 poverty line, or -0.1 when excluding the base allocation).
To its credit, in recent IDA rounds the exponent on CPR has been reduced twice, first from 5 to 4 in IDA17, and then from 4 to 3 in IDA18. But the impact of these changes will be muted while the exponent on GNI per capita is so small. In the next IDA round, the exponent on GNI per capita should be at least doubled, to -0.25. This would change the correlation between per person allocations (excluding the base) and poverty rates from -0.1 to just over zero. It would make the allocation more poverty-focused and less influenced by tiny changes in arbitrarily weighted subjective judgements about multifaceted concepts.
Interactive Calculator
Topics
DISCLAIMER & PERMISSIONS
CGD's publications reflect the views of the authors, drawing on prior research and experience in their areas of expertise. CGD is a nonpartisan, independent organization and does not take institutional positions. You may use and disseminate CGD's publications under these conditions.
Thumbnail image by: poco_bw/ Adobe Stock