Recommended

WORKING PAPER
Lessons from the Global Shocks of 2020-2022

Blog Post
A year ago, the International Monetary Fund (IMF) announced that an alarming 60 percent of developing countries and 25 percent of emerging market economies were either in debt distress or at severe risk of default. The confluence of severe shocks in the period 2020-22, starting with the COVID-19 pandemic and followed by Russia’s invasion of Ukraine and interest rate hikes in advanced economies, left many emerging markets and developing economies (EMDEs) struggling to meet their external obligations.
History shows that debt and other financial crises have devastating consequences for development, especially since they are associated with deep and long-lasting reversals of social progress such as alleviating poverty and improving access to health and education. Identifying countries under severe stress is certainly crucial to resolving crises after they hit, especially mobilizing necessary resources from the international community. But can we identify the most vulnerable countries before these shocks occur? After all, identifying the countries most vulnerable to external shocks could be a first step towards preventing severe financial difficulties in these economies.
In a new CGD paper, I present an indicator designed to do just that. By constructing a Resilience Indicator that compares countries in 2019, the year before the COVID-19 outbreak, across several variables, it was possible to identify which ones would encounter serious economic and financial problems if hit by an external shock. In other words, published data for 2019 clearly indicated that a significant number of countries were already grappling with deep vulnerabilities prior to the multiple shocks that have affected the global economy since 2020, and mostly before credit ratings agencies issued downgrades.
A simple indicator of resilience to external shocks
The methodology behind the Resilience Indicator builds upon my previous work on countries’ resilience to external shocks. Like in my earlier work, resilience is broadly defined here. A country is considered highly resilient to an external shock if major disruptions to its economic and financial systems do not follow in the wake of a shock. As the evidence shows, economic and financial crises do not materialize in all countries impacted by a common severe shock: some countries exhibit greater resilience than others.
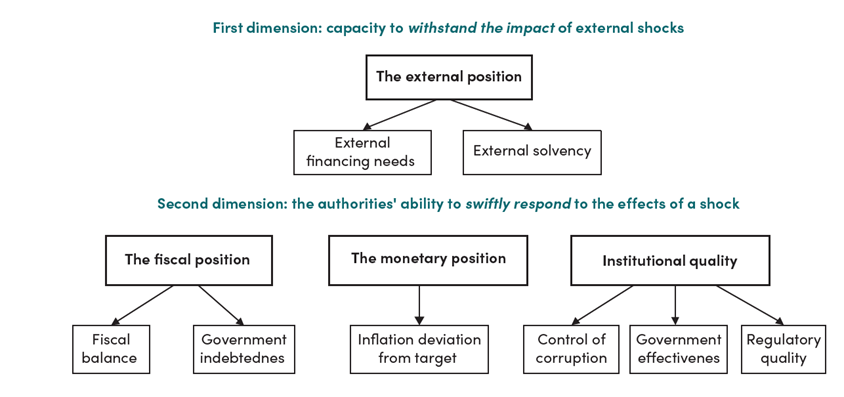
A key premise of the Resilience Indicator is that countries’ initial economic and institutional conditions before an external shock occurs significantly influence its resilience. These initial conditions are characterized in two dimensions: a country’s capacity to withstand the impact of a negative shock, and its ability to swiftly implement policies to mitigate the effects of the shock on economic and financial stability.
In determining variables that define the first dimension—the capacity to withstand shock—it is crucial to recognize that the primary negative effect of external shocks is a decrease in external sources of finance coupled with a surge in their cost. These shocks can undermine expectations of a country’s economic performance and financial stability, discouraging both international and domestic investors from financing projects or investing. This effect could arise via the commercial channel (for instance, a drastic drop in demand for a country’s exports) or the financial channel (for instance, a sharp rise in US interest rates).
Such dynamics imply that the stronger a country’s external position, the better equipped it is to resist the impact of an external shock. This can be evaluated by two measures: (1) the country’s external financing needs (a liquidity indicator that can be measured by the current account plus payments on short-term debt relative to the stock of international reserves), and (2) its total (public and private) external debt ratios (a solvency indicator).
The second dimension of resilience—a country’s ability to promptly respond to an adverse shock’s effect—largely depends on the fiscal and monetary positions at the time of the shock. In other words, the available fiscal and monetary space to implement adequate policies, often countercyclical ones.
The fiscal position is defined by the government’s financing needs (the fiscal balance) and its overall indebtedness (domestic and external). Concurrently, the scope for countercyclical monetary policy is determined by the absence of constraints to the usage of the central bank’s policy tools (such as changes in the policy interest rate or interventions in foreign exchange markets). In this regard, significant deviations from announced inflation targets hinder the implementation of effective countercyclical monetary policy.
Additionally, authorities would be able to swiftly implement adequate actions if they remain unaffected by political pressures and operate in a system where corruption is effectively controlled. In other words, institutional quality plays a critical role in determining the second dimension of resilience, warranting the inclusion of variables measuring its strength.
Figure 1 summarizes the two dimensions of resilience.
Figure 1. The two dimensions of economic resilience
Variables characterizing the two dimensions are combined using a simple methodology to construct the Resilience Indicator, as explained in the paper. This methodology allows for the analysis of relative economic and financial resilience among countries.
Which EMDEs were most vulnerable to the shocks of 2020-2022: Predictions from the Resilience Indicator in 2019
Based on data availability, I applied the Resilience Indicator to 71 countries classified in two groups: emerging markets and developing countries. Higher scores indicate greater resilience to external shocks. While some data came from worldwide databases, others came from national sources or country-specific documents published by multilateral organizations. All data was from 2019, indicating countries’ economic and financial condition in the pre-COVID period.
In both country groupings, the countries with the lowest scores—those assessed in 2019 to be relatively less resilient to external shocks—were precisely the countries that faced the greatest difficulties during the multiple external shocks of the early 2020s.
Developing countries
Countries in Figure 2 are ordered from highest to lowest values of the indicator (most to least resilient) in 2019. Not surprisingly, almost all the least resilient countries in the sample are in Africa.
Figure 2. Resilience Indicator 2019: Developing Countries
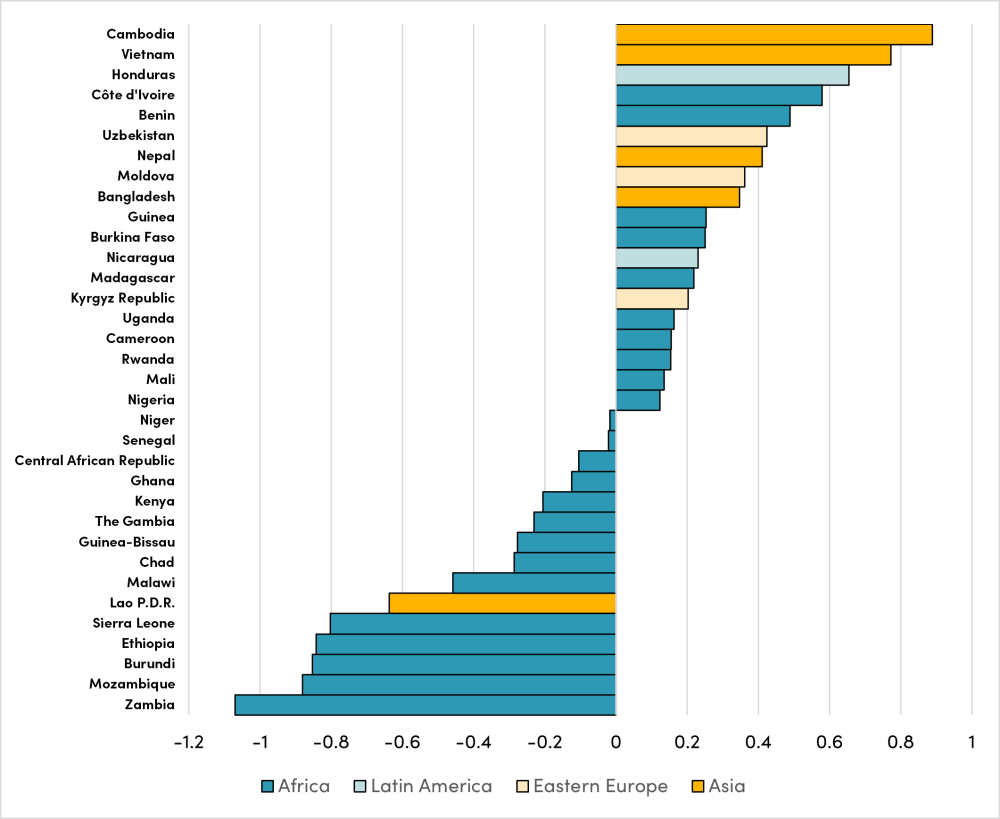
Were the countries with the lowest scores on the indicator in 2019 the ones most affected by the multiple shocks that started with the COVID pandemic in 2020? Yes. The 2022 IMF/World Bank classification of countries according to risk of overall debt distress (through their Debt Sustainability Analyses) confirms the Resilience Indicator’s accuracy. The results from the Resilience Indicator in 2019 can be compared with the IMF/World Bank assessment of countries’ default risk in the aftermath of the shocks.
The classification of countries in our sample by the World Bank in 2022 was as following:
|
Low risk |
Medium risk |
High risk |
In distress |
|---|---|---|---|
|
Bangladesh |
Benin |
Burundi |
Chad |
|
Cambodia |
Burkina Faso |
Cameroon |
Malawi |
|
Honduras |
Cote d’Ivoire |
Central African Rep. |
Mozambique |
|
Moldova |
Guinea |
Chad |
Zambia |
|
Nepal |
Kyrgyz Republic |
Ethiopia |
|
|
Uzbekistan |
Madagascar |
Gambia, The |
|
|
|
Mali |
Ghana |
|
|
|
Nicaragua |
Guinea-Bissau |
|
|
|
Niger |
Kenya |
|
|
|
Rwanda |
Lao P.D.R. |
|
|
|
Senegal |
Sierra Leone |
|
|
|
Uganda |
|
|
Notes: (1) Vietnam and Nigeria are not included in the table because they are not classified as low-income countries by the World Bank, (2) In November 2022, following an agreement between Chad and its creditors under the Common Framework, the IMF-World Bank changed Chad’s classification from “in debt distress “to “high risk” of debt distress.
Source: World Bank, Debt Sustainability Analysis (2022) https://www.worldbank.org/en/programs/debt-toolkit/dsa
The ordering of countries based on the 2019 Resilience Indicator and on the 2022 World Bank classification are a close match. Countries with a higher score in the indicator were classified as having low or medium risk of overall debt distress by the World Bank, while countries with lower scores in the indicator were classified as having high risk or already in distress. In other words, in 2019, policymakers and analysts who studied a few key economic and institutional variables could have accurately identified, to a large extent, countries’ relative economic and financial resilience to the external shocks of 2020-2022.
While some countries exhibited weaknesses across most variables in the indicator (e.g., Burundi, Mozambique, and Zambia), others revealed their vulnerabilities mostly in one or two variables. For example, Chad, Ethiopia, and Malawi had large external financing needs despite not having high external debt ratios. Additionally, Ethiopia and Malawi experienced high inflation rates. Chad shows how deficiencies in governance can result in crisis, even with low debt ratios. The country had the second-worst institutional quality score, reflecting its extremely low capacity to manage debt. By 2020, Chad’s large external payments made its debt position unsustainable. Moreover, the Indicator gave strong signals of macroeconomic problems in Ghana in 2019, when other international assessments were producing optimistic reports. The combination of a high fiscal deficit (the second highest in our sample), high government indebtedness, and high inflation placed Ghana in the lowest tercile of countries in the indicator. At the end of 2022, Ghana defaulted on its external debt.
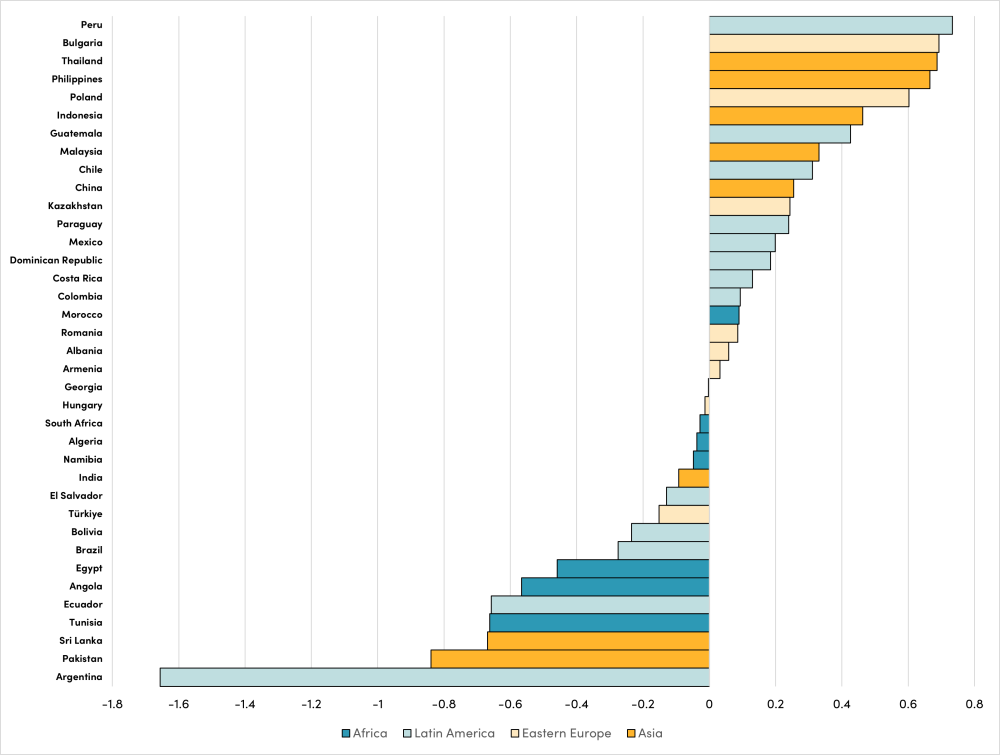
Emerging markets
As shown in Figure 3, Argentina, Pakistan, Sri Lanka, and Tunisia had the lowest scores in 2019 among the assessed emerging market countries. Since then, Argentina and Sri Lanka have defaulted, while Pakistan and Tunisia have teetered on the edge of default, with their government bonds trading at distressed levels. In these four countries, all or most variables of the indicator revealed severe vulnerability in 2019. In some other countries with low scores, specific variables stood out as sources of vulnerability. Egypt, for instance, had persistently large fiscal deficits (the second largest in the sample) that threatened macroeconomic sustainability, despite progress in reducing inflation. In Angola, the fiscal efforts of 2018-19 (including reaching fiscal surpluses) were not timely enough to correct for the extremely high ratio of government debt. Additional analysis using sovereign bond yields to gauge the accuracy of the indicator is presented in the paper.
Figure 3. Resilience Indicator 2019: Emerging Markets
The Resilience Indicator is, of course, not the first or only effort to assess and compare countries’ risk of economic and financial distress. Rating agencies, Wall Street, and multilateral organizations produce this type of assessment and cross-country comparisons, but they are often based on models that are highly complex, or black boxes that are extremely hard to check or adjust. An advantage of the Resilience Indicator is that it is public and straightforward, and simple enough to calculate in a relatively short time and as frequently as deemed necessary by policymakers.
The bottom line
A simple indicator based on a few variables conveys a clear message: as of 2019, the writing was on the wall as to which countries were less able to withstand the multitude of external shocks that started in 2020 with the COVID-19 pandemic.
The Resilience Indicator is not perfect. It is subject to the limitations already established in the literature for this type of index. Furthermore, the indicator did not rank Cameroon among the least resilient developing countries, even though the IMF/World Bank debt sustainability analysis assessed the country at high risk of debt distress in 2022.
A more nuanced assessment could be achieved by incorporating variables in the indicator that capture additional structural characteristics, as I explain in a previous paper. However, the objective here has been to present a straightforward indicator constructed from readily available information for a large number of countries. Identifying countries that are most vulnerable to large external shocks can help policymakers and the international community direct their efforts towards crisis prevention, thereby avoiding painful reversals in development gains.
Nayke Montgomery was responsible for data collection, analysis and visualization, and research background.
Topics
DISCLAIMER & PERMISSIONS
CGD's publications reflect the views of the authors, drawing on prior research and experience in their areas of expertise. CGD is a nonpartisan, independent organization and does not take institutional positions. You may use and disseminate CGD's publications under these conditions.
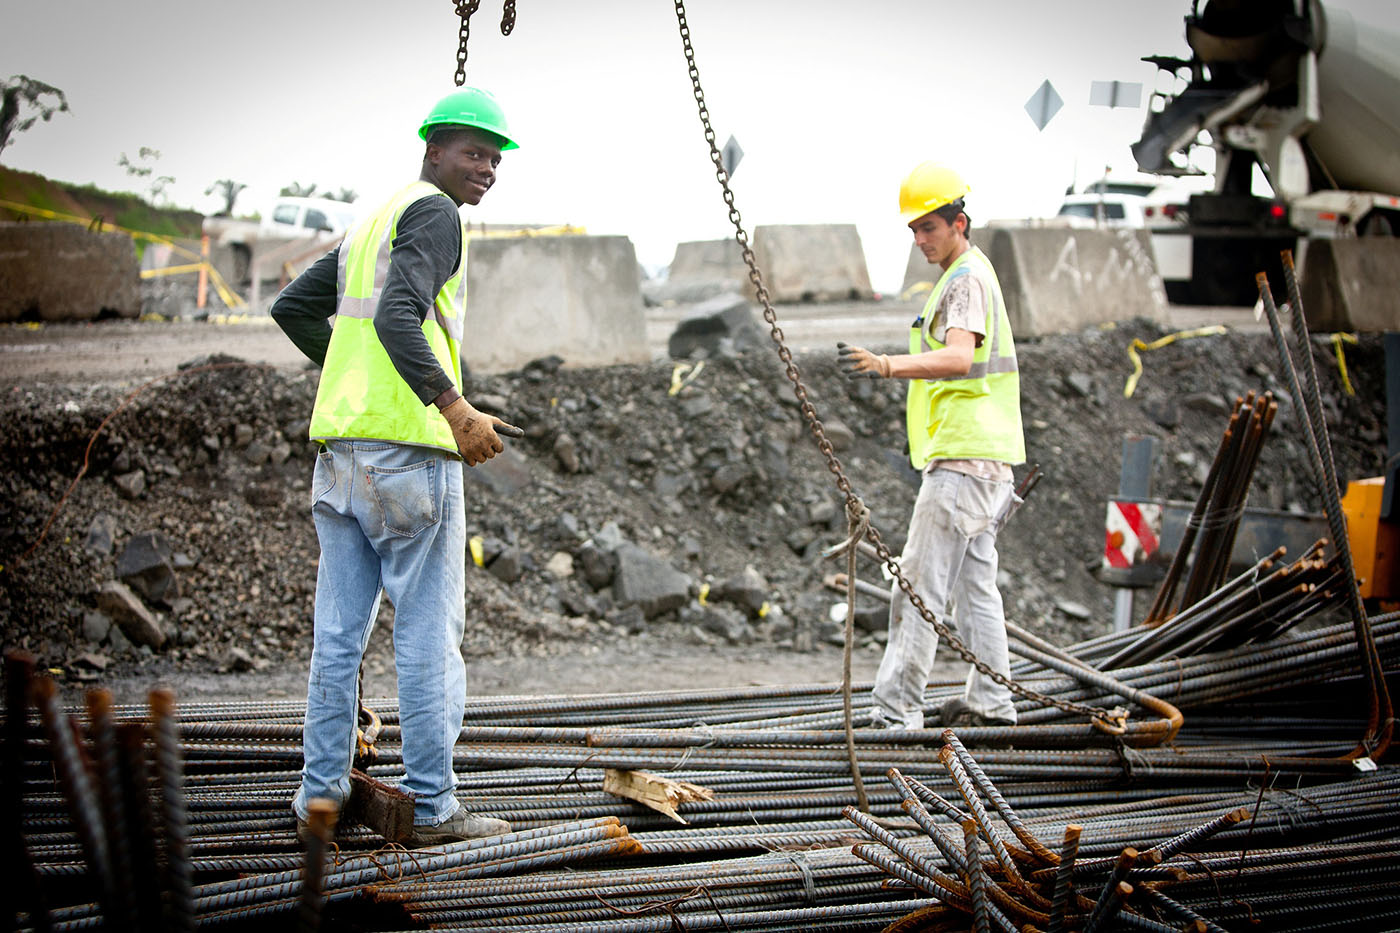
Thumbnail image by: Hanoi Photography / Adobe Stock