Recommended

Blog Post
Hybrid Capital and SDRs for the Uninitiated
The IMF’s Annual Report on SDR Trading Operations is the Rosetta Stone for followers of Special Drawing Rights (SDRs)—it provides great information on the otherwise inscrutable state of the SDR market. (Last year we compared reading it to a Bigfoot hunt.) The past year was tumultuous for SDRs, but we’ve now managed to decipher the annual report and extract the must-knows to help you have a more enjoyable experience when you read it! The report covers the first year after the historic allocation of SDR 456 billion ($650 billion) in August 2021 and provides important indications of the impact of the allocation on the use of SDRs.
Europe has become one of the main hubs of SDR trading
As a reminder, SDRs are traded through Voluntary Trade Agreements (VTAs) between the IMF and countries willing to exchange them for hard currencies. Late last year, Mauritius became the first sub-Saharan African country to have a VTA with the IMF, and six other countries across the world also joined the fold.
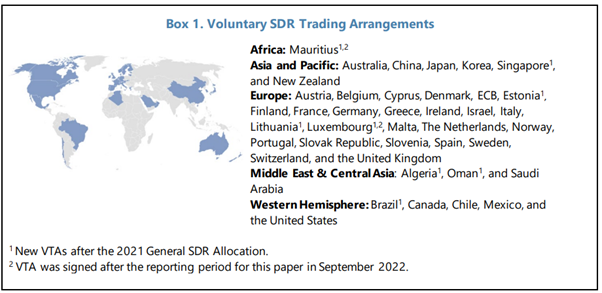
Source: IMF Annual Update on SDR Trading Operations
To ensure its stability, the VTA market is organised in a way that calibrates an agent’s purchasing and selling capacity based on its SDR Holdings.
In September 2021, the VTA landscape looked like this:
Table 1. VTAs: Trading ranges, as of September 2021 (in millions of SDRs)
|
Arrangements |
Trading Range (in % of Net Cumulative Allocation) |
Number |
Purchasing Capacity |
Average Purchasing Capacity |
Selling Capacity |
Average Selling Capacity |
|
Standard |
50-150 |
10 |
31,105 |
3,711 |
39,347 |
3,935 |
|
Eurosystem |
65-135 |
15 |
50,532 |
3,369 |
40,909 |
2,727 |
|
Other |
35-200 |
9 |
146,498 |
16,278 |
28,751 |
3,195 |
|
Total |
|
34 |
234,137 |
6,886 |
109,007 |
3,206 |
Source: IMF Annual Update on SDR Trading Operations
Almost year later, after a sharp increase in selling capacity, the landscape of VTAs looked like this:
Table 2. VTAs: Trading ranges, as of August 2022 (in millions of SDRs)
|
Arrangements |
Trading Range (in % of Net Cumulative Allocation) |
Number |
Purchasing Capacity |
Average Purchasing Capacity |
Selling Capacity |
Average Selling Capacity |
|
Standard |
50-150 |
12 |
39,198 |
3,266 |
44,808 |
3,734 |
|
Eurosystem |
65-135 |
18 |
65,980 |
3,666 |
60,008 |
3,334 |
|
Other |
35-200 |
8 |
132,092 |
16,511 |
29,460 |
3,682 |
|
Total |
|
38 |
237,270 |
6,244 |
134,276 |
3,534 |
Source: IMF Annual Update on SDR Trading Operations
In the year following the August 2021 allocation of $650 billion of new SDRs, purchasing capacity grew only a bit (from SDR 234 billion to SDR 237 billion). But selling capacity increased by almost 25 percent (from SDR 109 billion to SDR 134 billion). We take this as a sign that countries willing to trade SDRs are in a more comfortable SDR position, especially members of the Eurosystem (which includes the European Central Bank) whose sales capacity increased by almost 50 percent.
Looking at actual SDR operations, the IMF report notes that the volume of SDR sales increased markedly from SDR 1.7 billion in 2020-21 to SDR 18.3 billion 2021-22. While the increase was impressive, total sales amounted to only 4 percent of the 2021 allocation, indicating that most newly allocated SDRs continued to be held as reserves.
As indicated in the table below, in 2021-22 most SDRs were sold to Europe, with Asia and the Western Hemisphere each absorbing about 75 percent of the volume as Europe. Many fewer SDRs were acquired through the VTA market, with Asia and Europe providing most of those to acquirers.
Table 3. Regional sources of SDR sales and acquisitions via VTAs, September 2020- August 2022
|
Sales of SDRs |
||||
|
Region |
VTAs Available |
VTAs Used |
Number of Sales |
Amount of SDR Sales (SDR Millions) |
|
Asia and Pacific |
6 |
6 |
35 |
5,371 |
|
Europe |
24 |
23 |
73 |
7,176 |
|
Middle East & Central Asia |
3 |
3 |
8 |
442 |
|
Western Hemisphere |
5 |
5 |
32 |
5349 |
|
Total |
38 |
37 |
148 |
18,338 |
|
Acquisition of SDRs |
||||
|
Region |
VTAs Available |
VTAs Used |
Number of Acquisitions |
Amount of SDR Acquisitions (SDR Millions) |
|
Asia and Pacific |
6 |
5 |
15 |
1,062 |
|
Europe |
24 |
14 |
45 |
1,047 |
|
Middle East & Central Asia |
3 |
2 |
2 |
1 |
|
Western Hemisphere |
5 |
3 |
12 |
420 |
|
Total |
38 |
24 |
74 |
2,530 |
Source: IMF Annual Update on SDR Trading Operations
The report notes that 48 countries exchanged SDRs in the VTA system. All member sale requests (ranging from SDR 37 thousand to SDR 1.7 billion) were made by emerging markets and developing countries (EMDCs), with low-income countries (LICs) accounting for 29 percent of the total SDR sales volume. The largest sales volumes occurred immediately after the SDR allocation, but otherwise there is no evident time pattern.
Figure 1. Monthly SDR sales volume through VTAs, in millions of SDRs, September 2021-August 2022
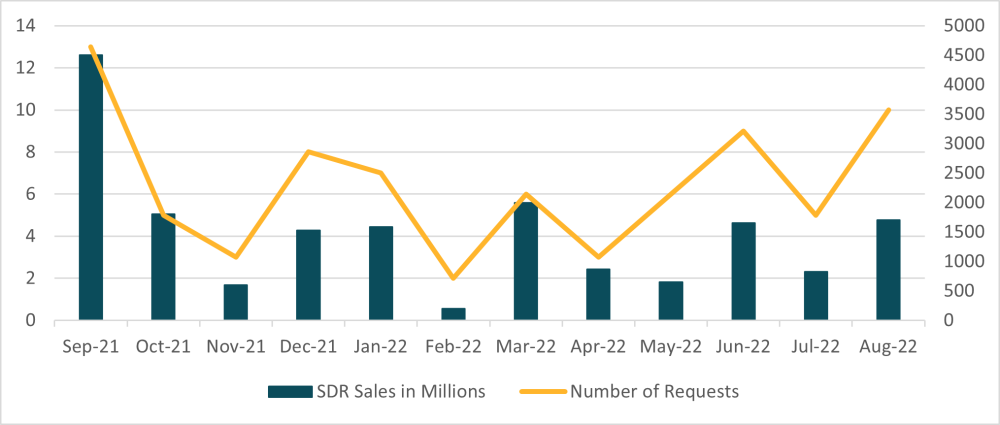
Source: IMF Annual Update on SDR Trading Operations
Countries will often pay their debt service to the IMF in SDRs and need to acquire SDRs for those purposes. In 2020-21, before the new allocation was made, 17 trades were made in connection with lending by the IMF’s Poverty Reduction and Growth Trust or liquidity, whereas only five such trades were made in 2021-22. This indicates that the extra liquidity provided by the new allocation made it easier for countries to meet their IMF obligations. In addition, before the allocation, 30 IMF members had SDR holdings below 5 percent of their cumulative allocation, but in 2021-22 this number fell to 24.
Table 4. Summary of SDR sales through VTAs
|
|
September 2020 - August 2021 |
September 2021 - August 2022 |
|
Number of Sales Requests |
27 |
90 |
|
Number of Transactions |
30 |
148 |
|
Of which: |
|
|
|
In connection with GRA lending |
1 |
0 |
|
In connection with PRGT lending |
11 |
1 |
|
In connection with PRGT liquidity |
5 |
4 |
|
Others |
13 |
143 |
|
Total Amount of SDR Sales |
1,721 |
18,338 |
|
Of which: |
|
|
|
In connection with GRA lending |
144 |
0 |
|
In connection with PRGT lending |
507 |
49 |
|
In connection with PRGT liquidity |
217 |
175 |
|
Others |
853 |
18,114 |
Source: IMF Annual Update on SDR Trading Operations
Overall, the annual report confirms that the VTA market is healthy and growing in importance. It appears to be dominated by Europe, even though the US holds 20 percent of the world’s SDRs. And the market is still small relative to the total allocations SDRs or total global reserves, which amount to about $14 trillion. Thus, SDR trading is very much a niche market in global reserve management. We have made suggestions elsewhere as to how SDRs might be better used.
Topics
DISCLAIMER & PERMISSIONS
CGD's publications reflect the views of the authors, drawing on prior research and experience in their areas of expertise. CGD is a nonpartisan, independent organization and does not take institutional positions. You may use and disseminate CGD's publications under these conditions.
Thumbnail image by: Adobe Stock