Recommended
In March 1960, Ambassador Ortona of Italy gavelled open the first meeting of the Development Assistance Group in Washington, DC. Around the table were representatives from the donor countries of Belgium, Canada, France, Germany, Italy, Japan, Portugal, the United Kingdom, and the United States, who were joined by the Netherlands later that year. The DAG, which would soon be renamed the DAC (Development Assistance Committee) went on to agree the rules covering what counts as official development assistance, which included a list of eligible target countries for ODA spending. Thus was the world divided into donors, recipients, and the “none-of-the-above” category of rich non-donors.
1960 was a long time ago. It was the year that The Flintstones premiered as prime-time television in the United States. And it is not only in terms of popular entertainment that the world was a considerably more impoverished place. Real-life Wilma and Fred Flintstone lived on perhaps $400 a year in 10,000 BC. The average world resident in 1960 had only travelled 30 percent of the distance between a Stone Age income and the mean world income of today. Many of the original members of the DAG saw average incomes low enough that they would be considered distinctly developing today.
That suggests shifting notions about what counts as a rich country over time, but the last sixty years hasn’t seen a similar change in what counts as a poor country requiring significant development assistance. While donor status appears more closely tied to relative income, significant recipient status appears to have been effectively tied to a low absolute income. And that has made for a world where the slightly less poor are denied meaningful support from a growing number of increasingly ungenerous rich countries.
The constant income cutoff for recipients...
In two figures below, I present the standard deviation of the range of incomes for donors and recipients using a number of different lists of countries over time. They use Penn World Tables for the income data, so that the per capita numbers are inflation and purchasing power adjusted. Note ranges and averages reported are not weighted by population—they are simple averages. The figures report on the standard deviation range of:
- Incomes of current low-income (LIC), lower-middle-income (LMIC), and upper-middle-income (UMIC) countries;
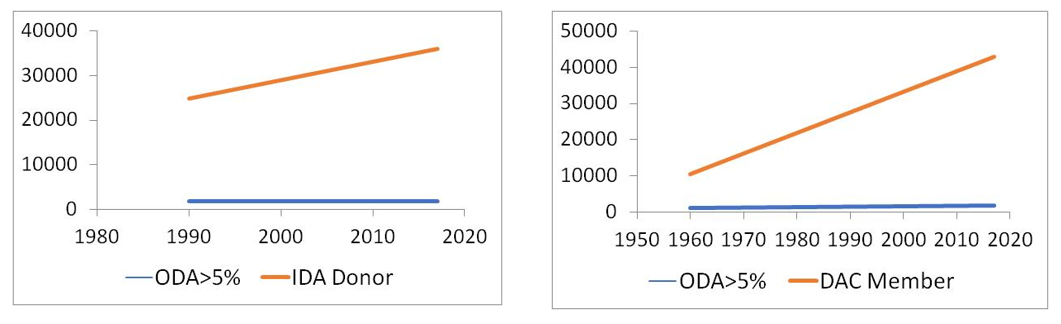
- Incomes of the original members of the Development Assistance Group (DAG) in 1960, DAC donors today, and donors to the World Bank’s International Development Association in 1980, 1990, and 2016, contributors to Montreal Protocol multilateral funding in 1990, and UN Framework Convention on Climate Change Annex One and Two countries in 1992; and
- Incomes of countries that received more than 5 percent of their gross national income (GNI) in ODA in 1960, 1990, and 2017 (“major recipients”), and countries that received more than $100 million in ODA in 1960, 1990, and 2017 (“$100m recipients”).
Figure 1 suggests that aid has remained focused on very poor countries and the income threshold for exiting “major recipient” status has remained very low. The median income of countries that received ODA worth 5 percent or more of GNI was $1,040 in 1960, $1,740 in 1990, and $1,770 in 2017.
It should be noted there are considerably more major recipients today than in 1960–not least, many of today’s major recipients were still colonies 60 years ago and weren’t counted in aid statistics. And thanks to some income growth and a lot of population growth, those countries have considerably larger economies than in the past, so providing them with aid worth 5 percent of GNI takes a lot more money. But still, the global safety net hasn’t expanded over time.
...And the rising income cutoff for donors
Meanwhile, Figure 2 suggests the income associated with embracing donor status has risen almost as fast as average global income. The median DAG member in 1960 had an income of $10,445 (below the median for upper-middle-income countries in 2017). Today, the median DAC member has an income of $42,902—a rise of 310 percent since 1960. The median IDA donor in 1980 had an income of $19,842, climbing to $36,061 in the most recent IDA replenishment.
That means there are a lot of countries considerably richer than the median donor in the past that aren’t donors today. Of the 96 countries in our dataset with 2017 incomes higher than the median DAG donor in 1960, only 29 are members of DAC. Of the 62 countries with incomes higher than the median IDA donor in 1980, only 40 were IDA donors in the latest round. Using an absolute income standard, the category of rich non-donors has expanded over considerably.
Even using a relative standard, if you think everyone more than 10 times richer than the current set of major aid recipients should be a DAC donor, 61 percent of countries ought to be DAC members today compared to the actual proportion of 17 percent.
The picture is different using a standard set relative to the global average rather than the poorest countries. Assume every country that has an income more than 1.5 times the global average should be an IDA donor. In 1980, 69 percent of countries that should have been donors on this measure were in fact donors. In 2017, 76 percent of countries that should have been donors were IDA donors. But the income gap that should matter most to the decision to provide safety net support is presumably that between the potential donor and recipients, not between the potential donor and the world as a whole.
Figure 3 shows the result of the two trends of a near-stationary cutoff for exiting major recipient status compared to a rapidly rising cutoff for entering donor status: DAG members were 10 times as wealthy as major recipients in 1960, DAC members are 24 times richer than major recipients today.
Figure 1. How rich are recipients? (Standard deviation range)
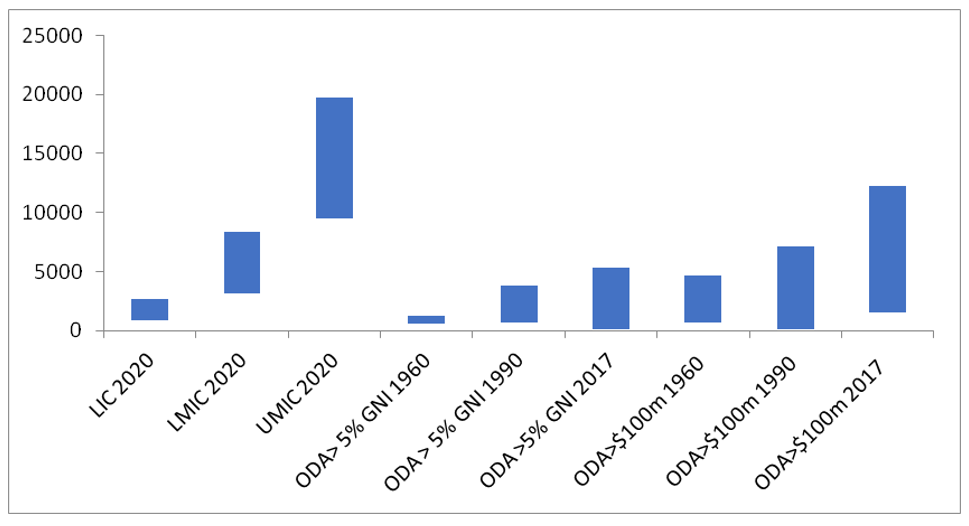
Figure 2. How rich are donors? (Standard deviation range)

Figure 3. The median income of major recipients and IDA donors/DAC members
Missing donors...
It is important to note this isn’t simply a matter of new donors preferring other channels for financial support than official ODA: Ian Mitchell, Euan Ritchie and Andrew Rogerson make clear that a number of non-DAC countries on the cusp of high-income status—most significantly China and Brazil—remain minor players in terms of low-cost finance for international development. China provides international grants, subsidy components of loans, and core support to multilateral donors worth 0.04 percent of GNI and Brazil provides 0.07 percent, for example. In total, Mitchell and colleagues suggest only one sixth of global grant, subsidy and multilateral core support comes from non-DAC donors, most significantly Turkey, China and the UAE.
...And donors missing targets
That said, the United States—a DAC founding member—only provides international grants, subsidy components of loans, and core support to multilateral donors worth 0.16 percent of GNI (for comparison, the UK is on 0.64 percent). And that speaks to the other reason the global safety net hasn’t grown that much as the world has got richer. Overall ODA inflows as a percentage of developing country GDP have fallen from 0.32 percent in 1960 to 0.26 percent in 1990, and 0.20 percent today. In considerable part, that reflects traditional donors becoming less generous. Aid outflows as a percentage of DAC country GNI has fallen from 0.51 percent in 1960 to 0.31 percent today (so much for the UN’s 0.7 percent target).
Put missing new donors and ungenerous old donors together and the global transfer shortfall looms large. In purchasing power parity terms, China today has an income per capita between the UK income and the US income in 1960. In 1960, the UK provided 0.56 percent of GNI in ODA and the US 0.54 percent. Imagine the US and China both provided 0.54 percent of their GNI in ODA today. That would increase US ODA from $35 billion to $117 billion. Chinese ODA would be worth $77 billion. That compares to current grants and subsidies of about $5 billion, which we can generously assume is equivalent to about $10 billion of ODA. That adds up to an approximate $155 billion total increase in ODA were China and the US today as generous as the US was sixty years ago. And it compares to actual total global ODA flows today of about $153 billion.
This seeming failure in solidarity with the world’s poorest countries may reflect the stagnation or decline in trust regarding international institutions suggested by World Values Survey results on confidence in the United Nations over time. Perhaps it signals a declining belief in the power of aid to produce results—especially amongst the poorest countries that remain furthest behind, sometimes after decades of significant aid flows.
And, of course, it mirrors similar arguments about poverty and safety nets at the national level, perhaps especially in the United States: a declining trust in government welfare programs linked to a sense that it doesn’t help the poorest. Hopefully that domestic conversation is evolving, with strong evidence that the US safety net did help reduce poverty and can lift up the poorest if it is better designed to reach them. And, hopefully, the global discussion on aid will evolve in the same direction, based on similar evidence of past success.
The world is considerably richer than it was when the Flintstones premiered. That makes the moral stain of global poverty all the greater. If the richest countries are increasingly derelict in their financial leadership in response to this challenge, a number of countries on the verge of high-income status are also falling short. There is plenty of blame to go around.
Topics
DISCLAIMER & PERMISSIONS
CGD's publications reflect the views of the authors, drawing on prior research and experience in their areas of expertise. CGD is a nonpartisan, independent organization and does not take institutional positions. You may use and disseminate CGD's publications under these conditions.
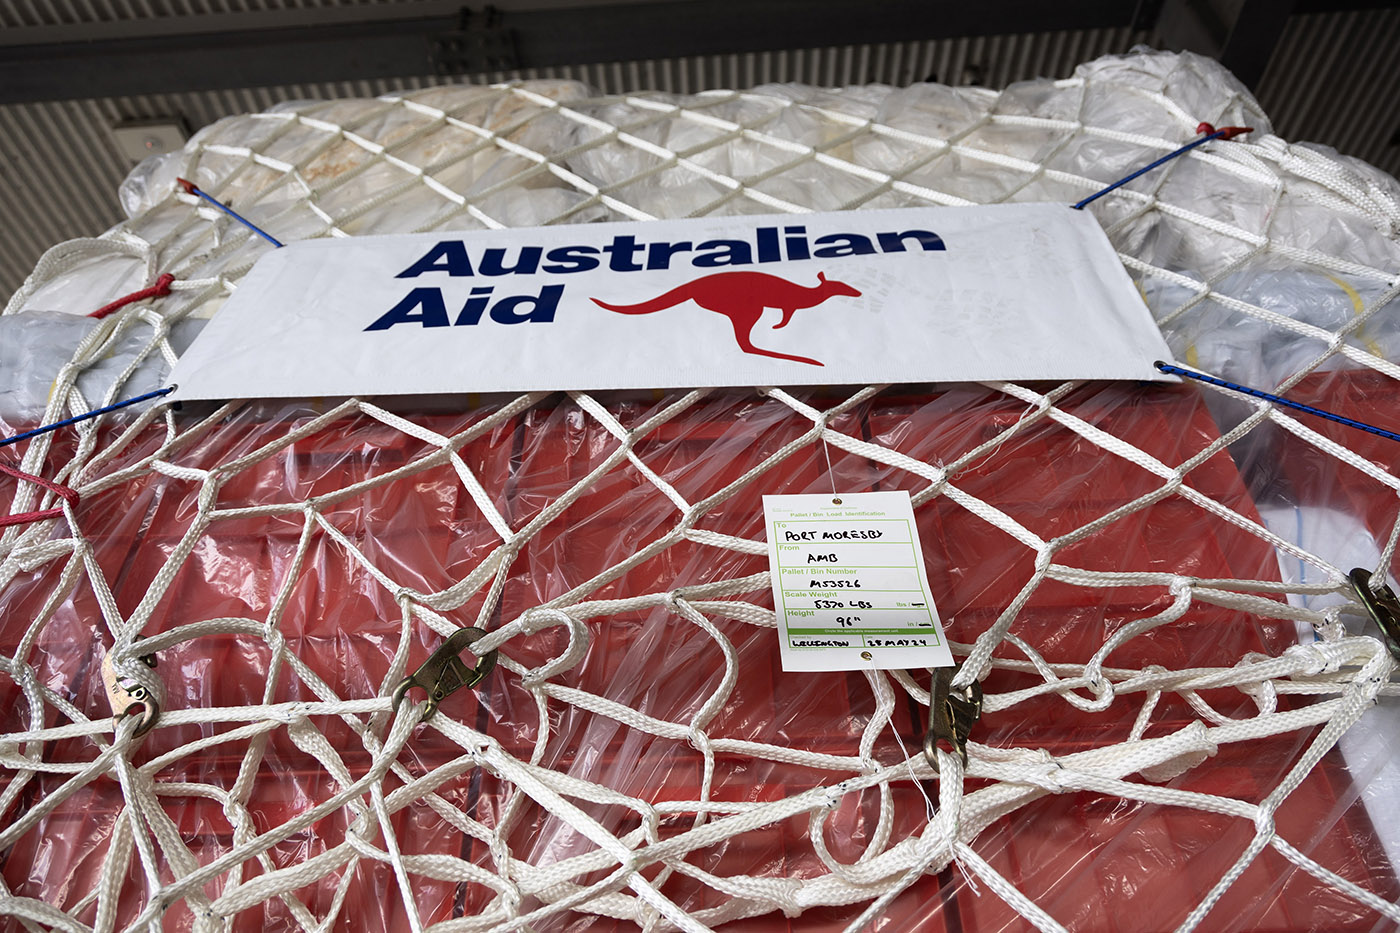
Thumbnail image by: exopixel via Adobe Stock