Recommended
Blog Post
Development in the FY22 US Spending Package
Blog Post
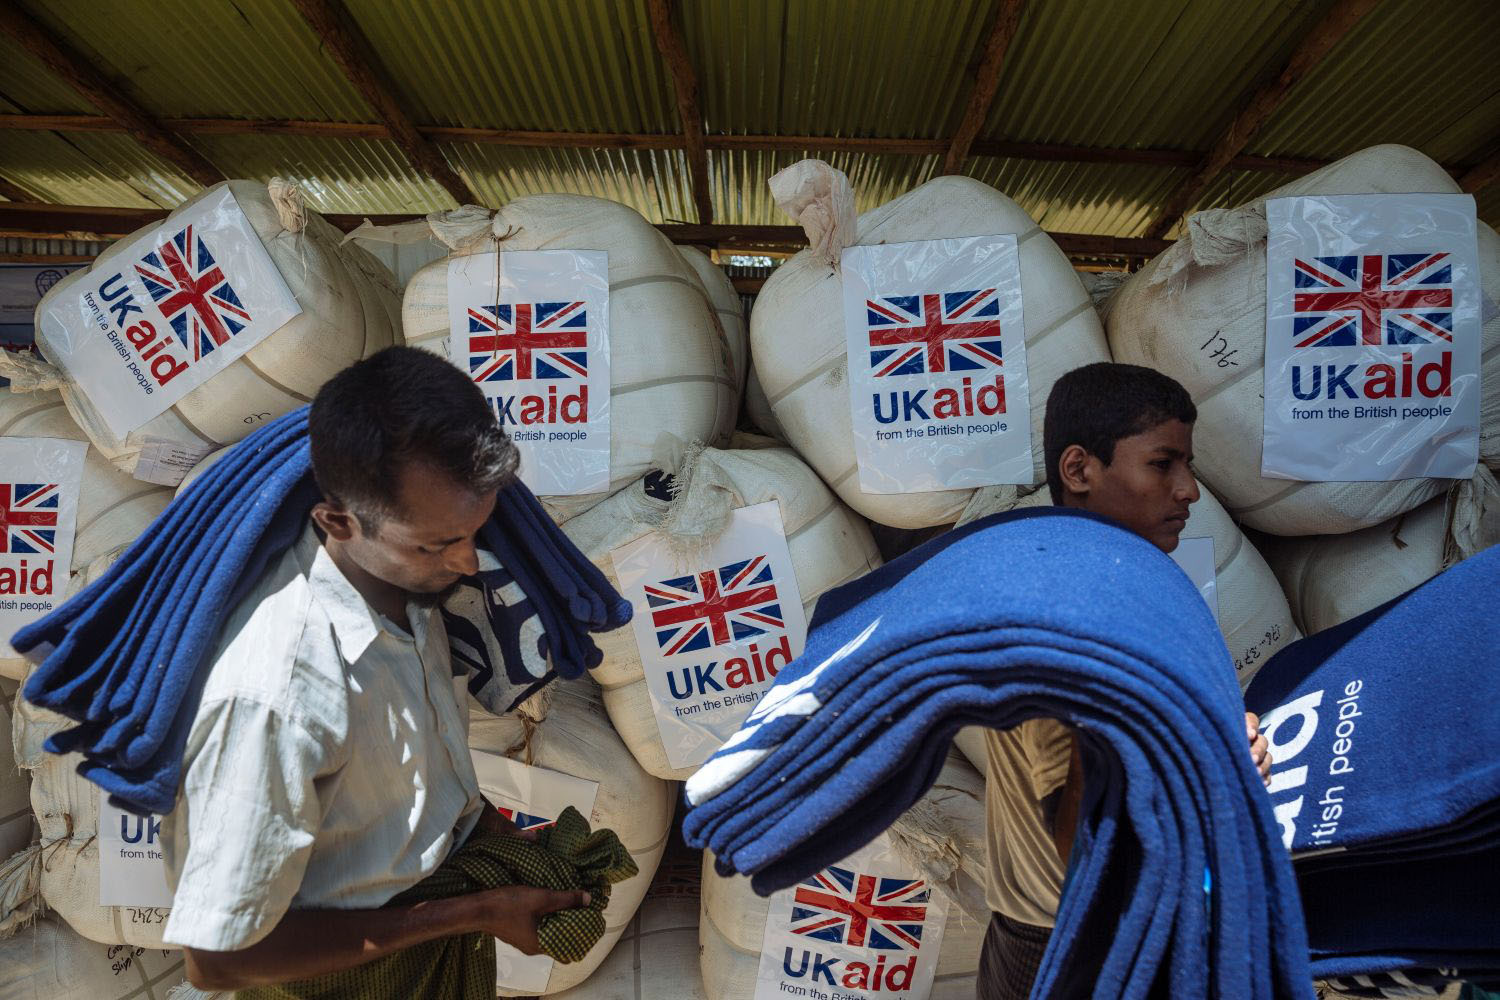
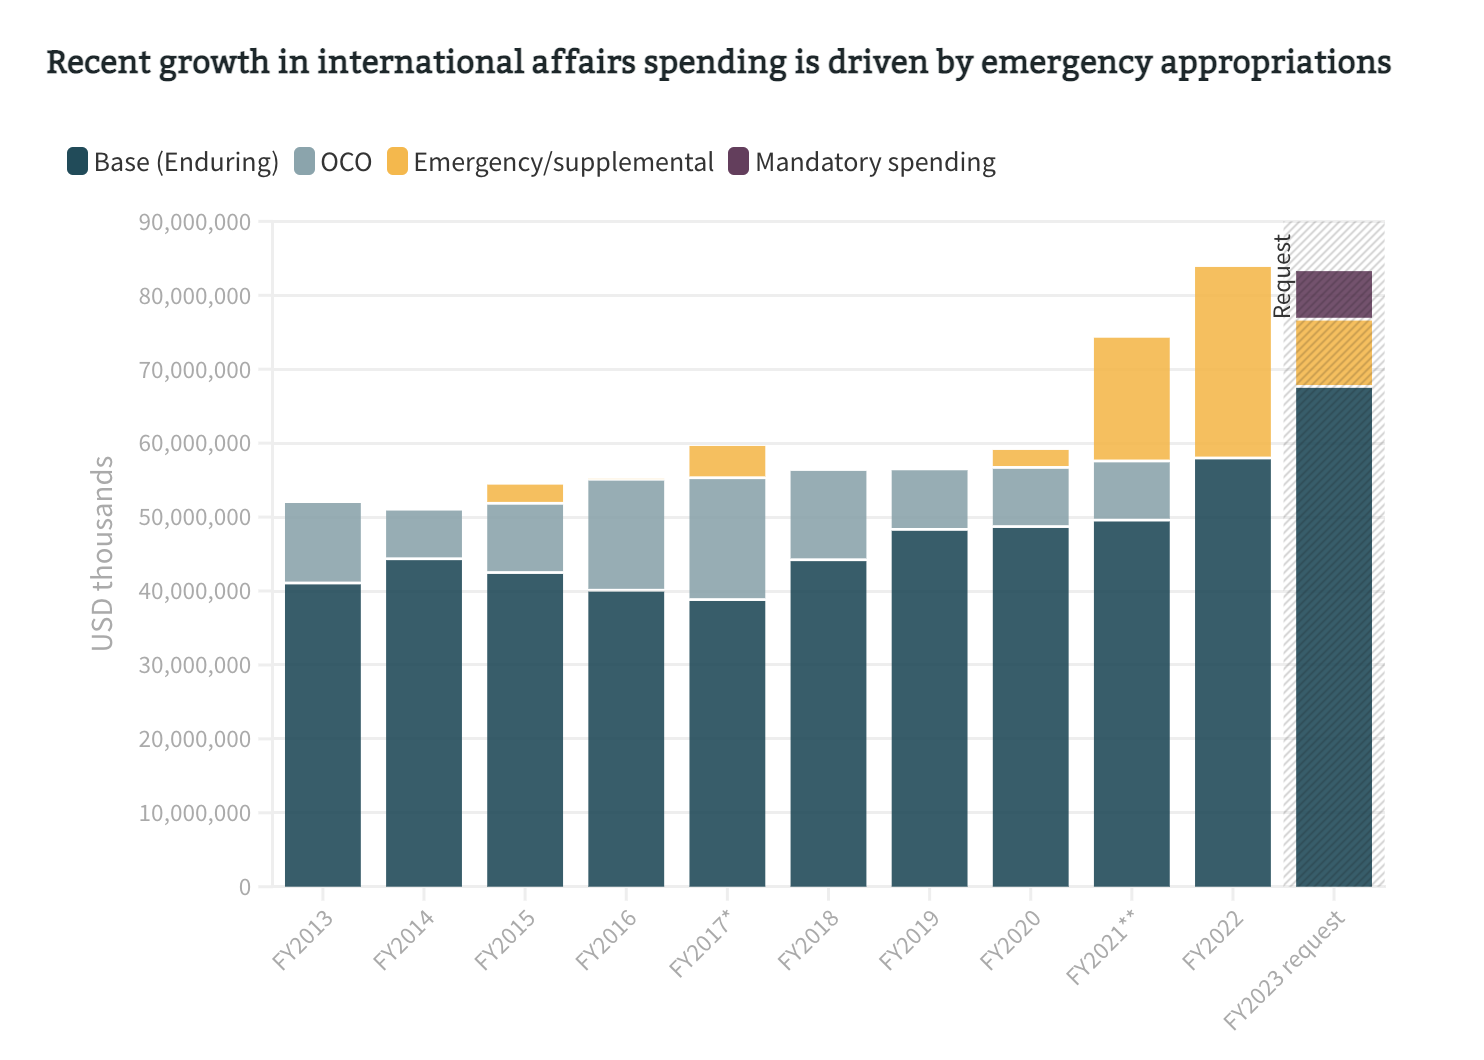
Emergency Spending vs. Regular US Foreign Assistance
The US foreign assistance data for FY 2022 is nearly complete, except for some missing Department of Defense, Homeland Security, and Transportation data, and the data reveals some interesting trends.[1] First, FY 2022 did not break the historical record of total obligations, but it came closer than any time since the 1940s, primarily driven by the Russian invasion of Ukraine. Incomplete 2023 data also suggests that FY 2022 and FY 2023 will put Ukraine assistance in top 20 all-time country-year obligations, illustrating the bureaucracy’s remarkable ability to pivot under perceived emergencies. Second, the share of foreign assistance allocated to low-income countries is steadily decreasing over time. Though this is primarily a result of decreased aid to Afghanistan over time—and not the sharp increase in assistance to Ukraine in FY 2022—it does contribute to the existing Global South perception that the world’s poorest are being left behind, which the US must carefully address.
The data also raises questions about whether US cross-sectoral allocations are fit-for-purpose in an age of historic conflict levels, and shows some evidence of backsliding on positive foreign aid data transparency trends.
FY 2022 was the 3rd highest foreign assistance obligation amount in US history
In FY 2022 the US obligated $70.2 bn in foreign assistance, which was the 3rd highest yearly amount in history. The highest was in 1949 ($80 bn) and the 2nd highest in 1947 ($73 bn). This was unsurprisingly a result of the war in Ukraine. In FY 2022, Ukraine received $12.4 bn in foreign assistance obligations, representing about 18 percent of the total amount.
This is remarkable for two reasons. First, it demonstrates that the US aid bureaucracy can quickly pivot and absorb new priorities when the collective perception of an emergency is strong enough. All the Ukraine assistance was obligated in the second half of the fiscal year, and it was no small feat to navigate the bureaucracy to accomplish this mission. Second, for the most part, the Biden administration was able to address this new emergency without decreasing commitments to other funding priorities—through the passage of Supplemental Appropriations bills. Again, the navigation of these bureaucratic complexities and decision-making processes was a remarkable achievement.
Ukraine FY 2022 and FY 2023 are both in the top 20 historical country-year obligations
Although FY 2023 data is incomplete, the current data already suggests that both Ukraine’s FY 2022 and FY 2023 obligations will make it into the top 20 historical country-year obligations.
Top 20 Highest Amounts of US Foreign Assistance Obligations in Any One Year
|
Rank |
Country |
Fiscal Year |
Obligations ($ billion) |
|---|---|---|---|
|
1 |
United Kingdom |
1947 |
40.9 |
|
2 |
Vietnam (former South) |
1973 |
19.6 |
|
3 |
Afghanistan |
2011 |
17.2 |
|
4 |
Afghanistan |
2012 |
16.5 |
|
5 |
Vietnam (former South) |
1972 |
16.1 |
|
6 |
France |
1951 |
16.0 |
|
7 |
Ukraine |
2023 |
15.9 |
|
8 |
Israel |
1979 |
15.8 |
|
9 |
United Kingdom |
1949 |
15.5 |
|
10 |
France |
1952 |
15.1 |
|
11 |
Afghanistan |
2010 |
14.2 |
|
12 |
Vietnam (former South) |
1971 |
13.8 |
|
13 |
Iraq |
2006 |
13.5 |
|
14 |
Iraq |
2004 |
12.9 |
|
15 |
France |
1949 |
12.6 |
|
16 |
Iraq |
2005 |
12.5 |
|
17 |
Ukraine |
2022 |
12.4 |
|
18 |
Israel |
1974 |
12.2 |
|
19 |
Vietnam (former South) |
1969 |
12.2 |
|
20 |
Germany |
1949 |
12.1 |
Ukraine 2023 ($15.9 bn) is already in seventh place despite incomplete data; and the 2022 amount ($12.4 bn) is seventeenth. The top 20 list demonstrates how foreign assistance correlates with core US national security interests, especially wars in which it directly participates and the reconstruction of countries in the aftermath of wars. The highest amount was obligated to the United Kingdom in 1947 ($40.9 bn in constant dollars). Foreign assistance to Vietnam during the Vietnam war constitutes four of the top 20 obligations. Afghanistan and Iraq comprise six of the top 20 spots. Israel in the 1970s occupies two spots.
Foreign assistance to low-income countries has steadily decreased since 2012
The most worrisome trend is the dramatic decrease in foreign assistance to low-income countries (LICs ) in both absolute numbers and as a percentage of total disbursements. Between FY 2012 and FY 2022, US disbursements to LICs decreased from $19.9 bn, or 34 percent of the total, to $12.9 bn, or 19 percent of the total. However, between FY 2012 to FY 2021, disbursements to lower middle-income countries (LMICs) constituted between 16 to 20 percent of the total, but in FY 2022, this portion jumped to 31 percent.
This finding about US foreign assistance aligns with a recent analysis of Organization for Economic Cooperation and Development (OECD) Development Assistance Committee (DAC) aid data, which found that in 2022 LICs and least-developed countries (LDC) received a smaller share of aid from the DAC donors.
The general trend is worrisome because plenty of rigorous research—including this working paper by my CGD colleague Charles Kenny—argues that in order to maximize the utility of aid spending, aid should be targeted to the poorest countries. However, it is well known that myriad variables unrelated to development need shape US foreign assistance allocations, such as geopolitics and congressional politics.
This data supports those theories, as the decrease to LICs was primarily driven by decreased aid to Afghanistan, while the sharp increase to LMICs in FY 2022 was driven by Ukraine. Because of the supplemental appropriations and the increase in total disbursements, it is tendentious to suggest that Ukraine was a cause of lower allocations to LICs. However, one can imagine a counterfactual scenario in which the Russian invasion did not occur and a coalition of forces successfully advocated for increased US aid allocations to other LICs, i.e. not Afghanistan.
DRG and peace and security sectors represent the smallest proportions of US assistance despite historic conflict
Although the number of conflicts is at its highest point in recent history and the recent trend of democratic backsliding persists, the proportion of US foreign assistance allocated to the peace and security and democracy, rights, and governance (DRG) sectors has decreased over the past decade.
It is important to caveat this data with three points. First, we should disaggregate the data by region or country, especially by conflict-affected countries, to assess whether these sectoral trends exist in conflict-affected countries. Second, congressional earmarks reduce flexibility, and as this Center for Strategic and International Studies report concludes, although country earmarks have decreased, sectoral earmarks have increased over time. So, earmarks may explain a lot of the allocation “stickiness”, and if so, it may be important to address this issue.
Third, it is also possible that assistance to other sectors—especially economic development—is intended to reduce or prevent conflict and violence. However, the existing evidence base—such as Professor Chris Blattman’s synthesis in Why We Fight or the World Bank’s Pathways for Peace—does not strongly support the theory that poverty causes conflict or that economic interventions reduce conflict. Another leading scholar in the peacebuilding sector, Professor Susanna Campbell, has also argued that peacebuilding success requires donors to prioritize specific peacebuilding goals, as opposed to development or humanitarian goals. Of course, the existing evidence base may not be relevant to all contexts. But it is a useful starting point, and these funding trends raise questions about whether US cross-sectoral allocations are fit-for-purpose.
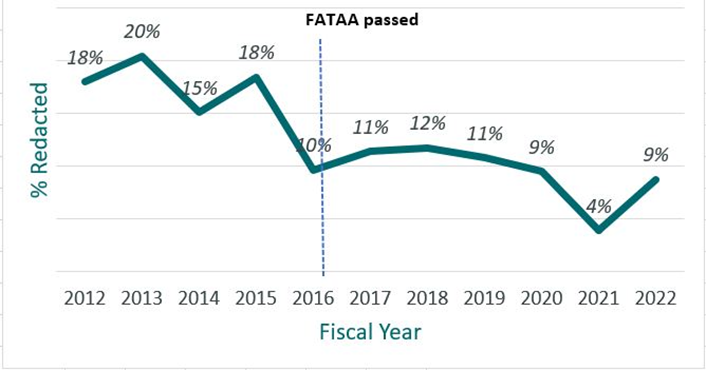
Although the overall trend since FATAA is positive, redacted foreign assistance data sharply increased in 2022
The passage of the Foreign Aid Transparency and Accountability Act (FATAA) in 2016 was a notable achievement. It strengthened the requirements for US foreign aid agencies to generate, use, and publicize foreign assistance funding and results data.
Prior to FATAA, between 15-20 percent of disbursement value included redacted activity data. Since 2016 the redacted percentage sharply decreased, and by 2021 it was down to 4 percent. But in 2022 there was a sharp uptick in redactions to 9 percent of the total disbursement value. Although 126 countries had redacted activity data, Ukraine constituted 64 percent and Afghanistan 14 percent of the total redacted disbursement value.
Percent US Foreign Assistance Disbursement Value with Redacted Activity Data, FY 2012-2022
The Russian invasion of Ukraine made 2022 a unique year for US foreign assistance and aid more generally. The data illustrates the bureaucracy’s remarkable ability to pivot under perceived states of emergency. Ukraine became the most funded recipient country by a huge margin.
However, the data reveals a clear longer-term trend of decreased allocations to lower income countries, which should concern those interested in promoting development. Although decreased aid to Afghanistan was the main cause, and the supplementals obviated the need for difficult choices, the tradeoffs could become more difficult without additional funding. Although it was right for the US to support Ukraine, one can empathize with the Global South perspective which perceives that over the past few years, the US and other western donors have failed to meet promises of COVID-19 aid, climate finance, and other priorities of the poorest countries. These perceptions have fueled distrust and diminished America’s geopolitical influence in the Global South. Moving forward with or without the supplemental appropriations, it will be important for the US to carefully manage its foreign assistance allocations so that the poorest countries are not left behind.
Thanks to Erin Collinson and Charles Kenny for helpful comments on an earlier draft.
[1] All data is from ForeignAssistance.gov, includes both military and economic assistance, was downloaded in January 2024, and is reported in constant dollars. Constant dollars use FY 2020 as the base year. For more recent years, disbursements data is used, which is the final stage of the US government’s foreign assistance allocation process; but historical comparisons use obligations data because disbursements data is unavailable.
Topics
DISCLAIMER & PERMISSIONS
CGD's publications reflect the views of the authors, drawing on prior research and experience in their areas of expertise. CGD is a nonpartisan, independent organization and does not take institutional positions. You may use and disseminate CGD's publications under these conditions.
Thumbnail image by: p_gangler / Adobe Stock