Recommended
Blog Post
Household Preferences in the Ghana School Feeding Programme
Blog Post
How School Meals Made the Last Century Fairer
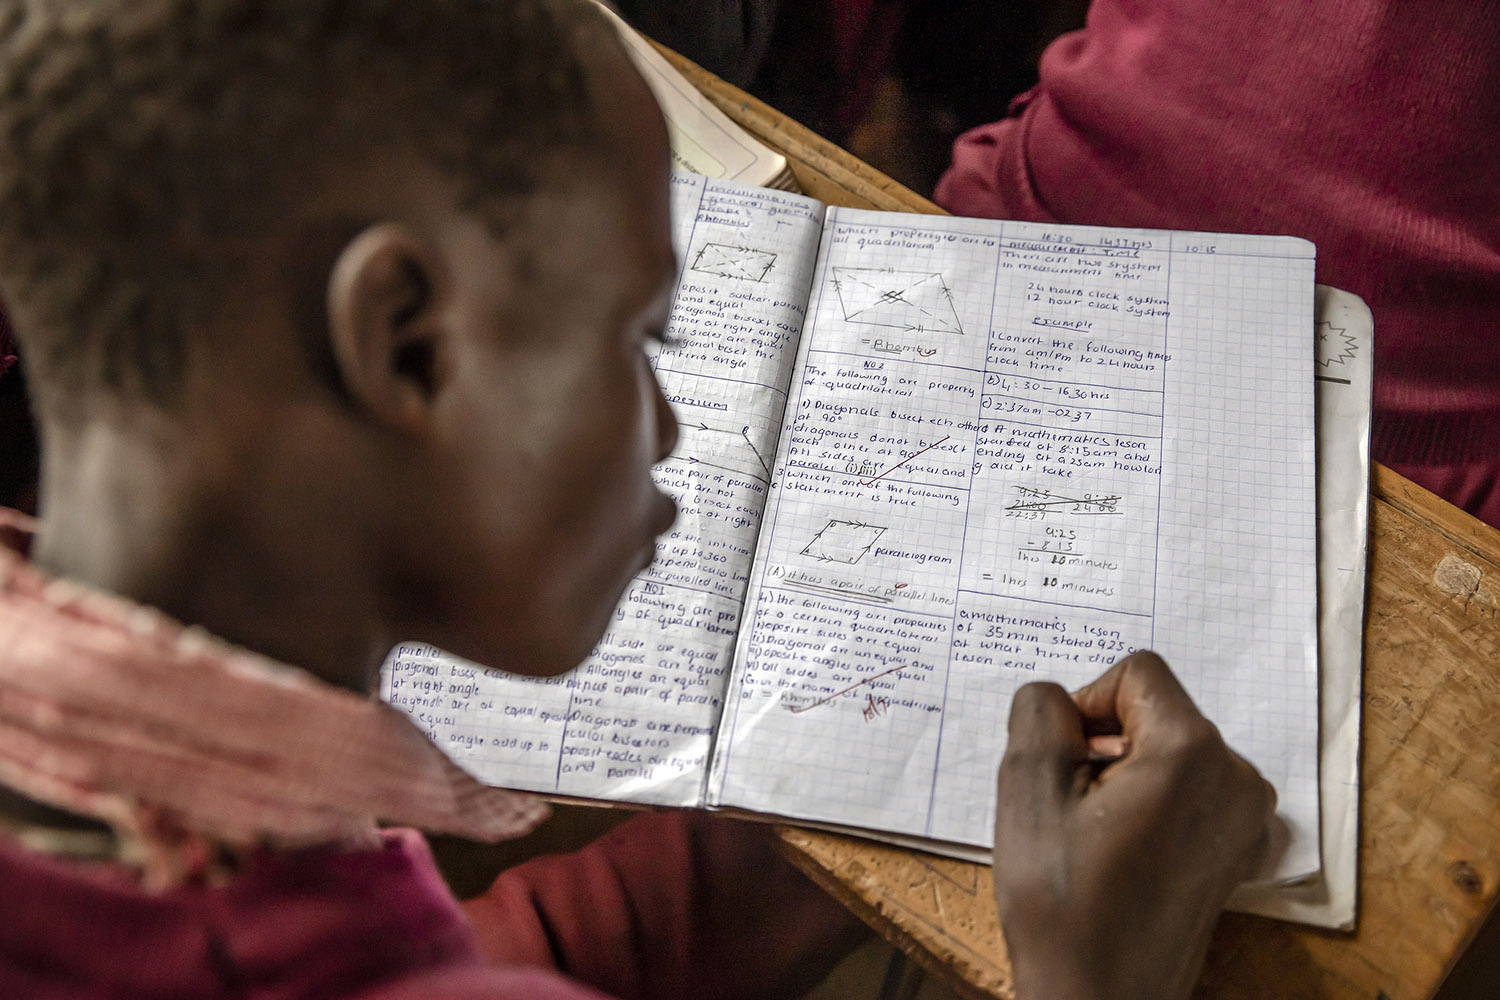
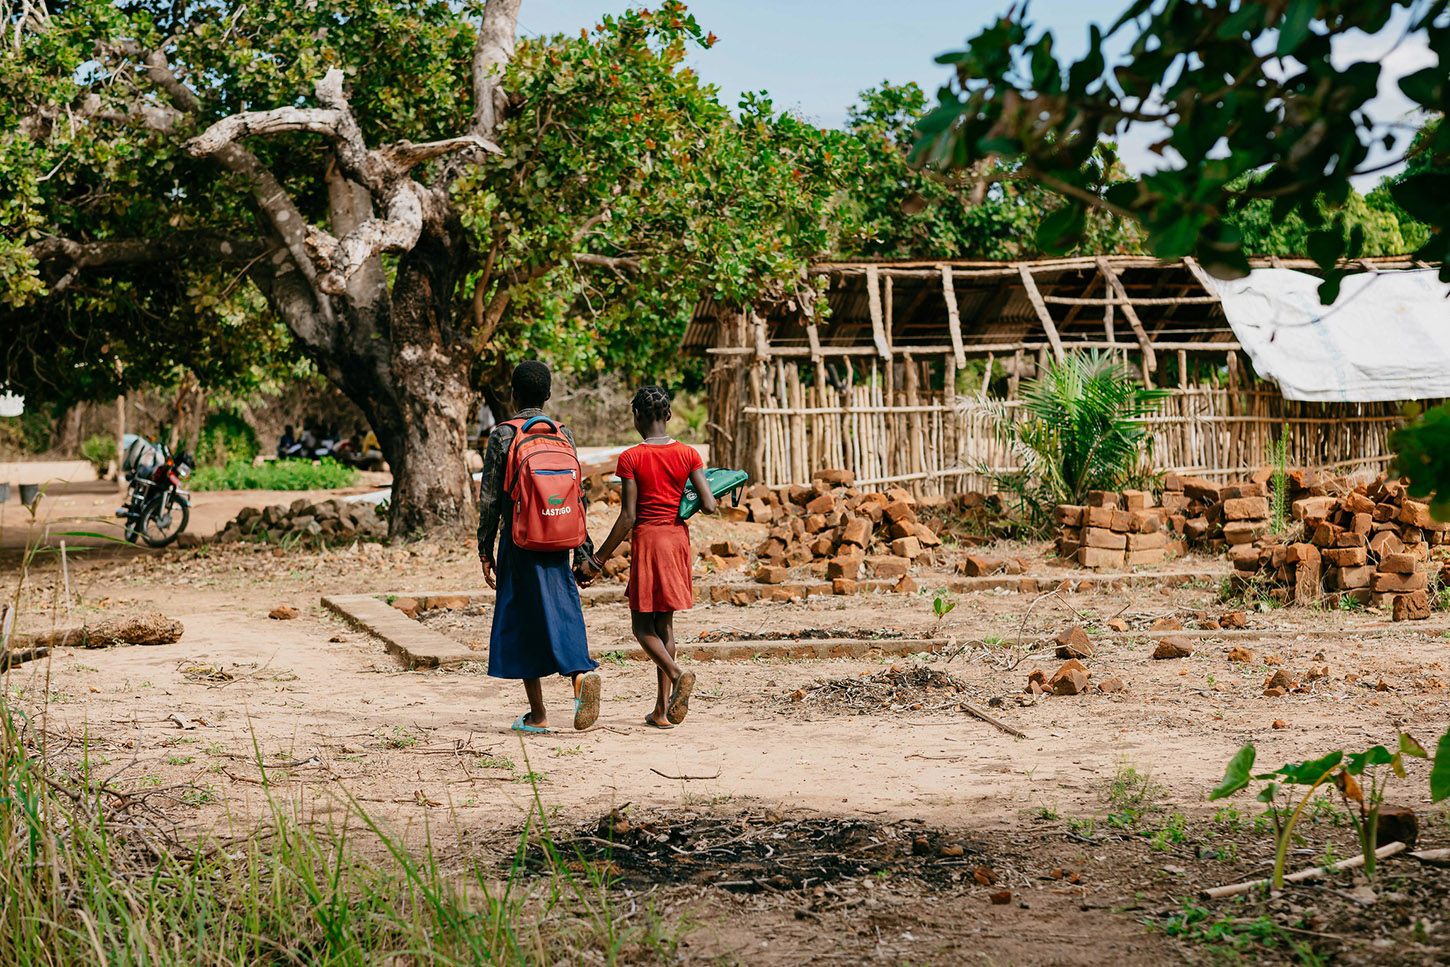
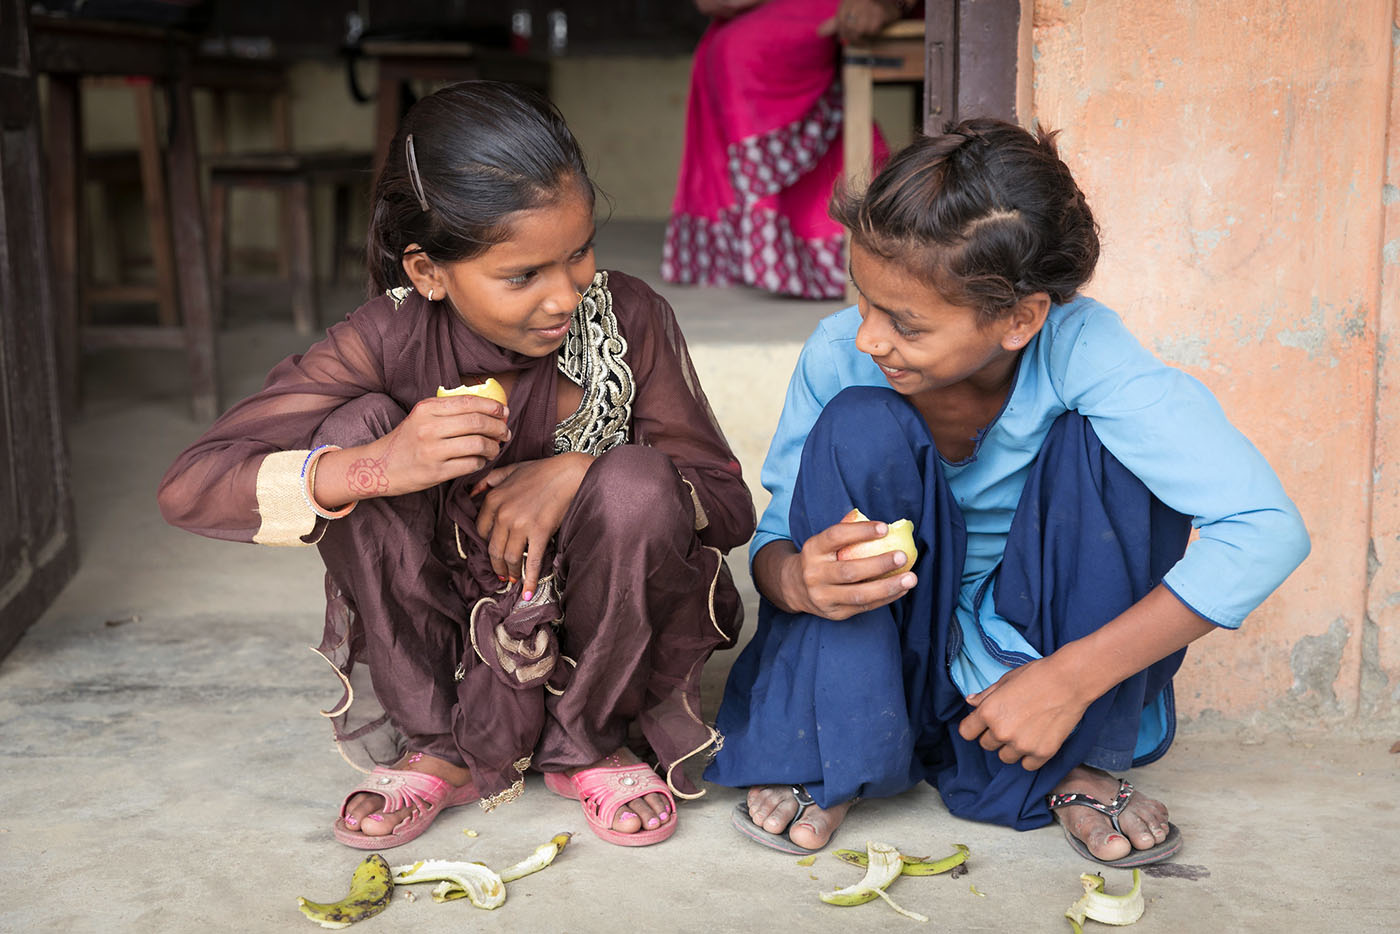
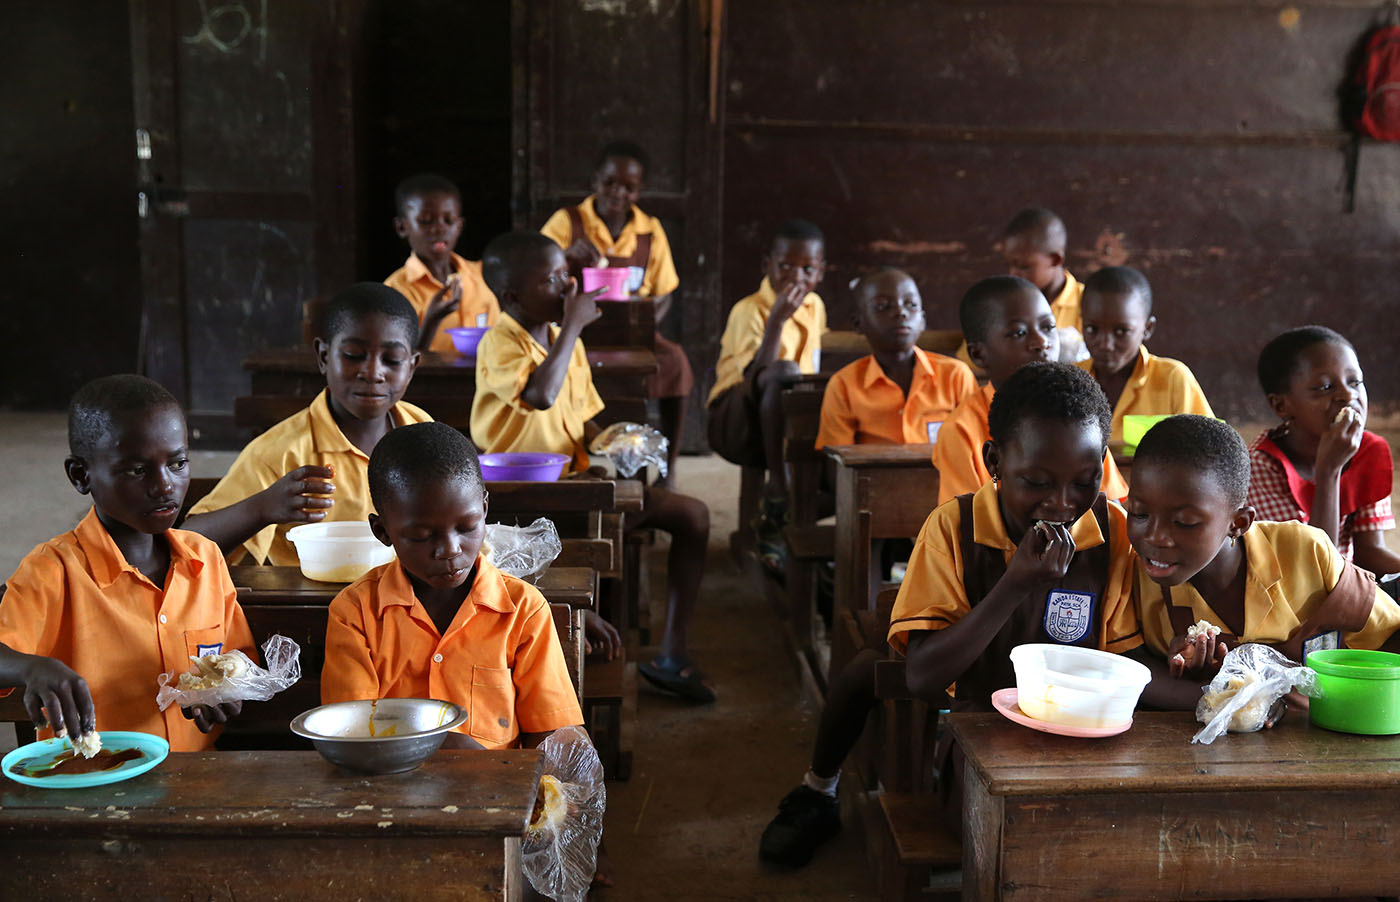
In the past decade, school meal programs have gained renewed attention as a popular tool to promote education, nutrition, and social protection—especially in low- and middle-income countries (LMICs). With 98 percent of global school meal spending financed domestically, these programs exemplify local ownership—an important strength in an era of declining foreign aid. Yet as programs scale up, fundamental questions remain: How much does it really cost to serve a nutritious school meal? Are current budgets enough to meet that need? What trade-offs do governments face between cost, quality, and scale? And perhaps most critically—how can these programs be financed sustainably?
In our new CGD working paper, we present the most comprehensive global assessment to date of school meal costs and efficiencies. Using data from 216 programs across 102 countries captured over three waves of the Global Survey of School Meal Programs (2018–2023), we analyze per-child costs, dietary quality, and scaling dynamics to better understand what it truly takes to deliver effective school meals at scale.
Key insight 1: Spending levels vary widely—and many programs remain underfunded
As might be expected, per-child spending on school meals varies widely by country income level. In low-income countries, programs spend just $110 per child annually for 200 meal days, compared to $665 in high-income countries (Figure 1. Dollar amounts reflect purchasing power parity). Higher-income countries do not just spend more, they have also increased their spending much faster recently. Over the past five years, richer countries more than tripled their per-child spending, while increases in low-income countries were far more modest.
Figure 1. Average adjusted and unadjusted annualized cost per child, by income group
But are these budgets sufficient? Benchmarking each program’s per-child cost against the price of a healthy lunch—defined as one-third of the FAO’s Cost of a Healthy Diet (CoHD) for that country—we find that 63 percent of programs fall short (Figure 2). This objective gap is reinforced by subjective data from the GCNF survey: half of programs in low- and lower-middle-income countries report inadequate funding. Moreover, in low-income countries, the negative correlation between program scale and funding adequacy suggests that maintaining adequate budgets becomes increasingly difficult as coverage expands.
Figure 2. Number of healthy meals covered by daily per-child spending for each program

Note: The line at y=1 represents the adequacy threshold where daily budget covers exactly one healthy meal.
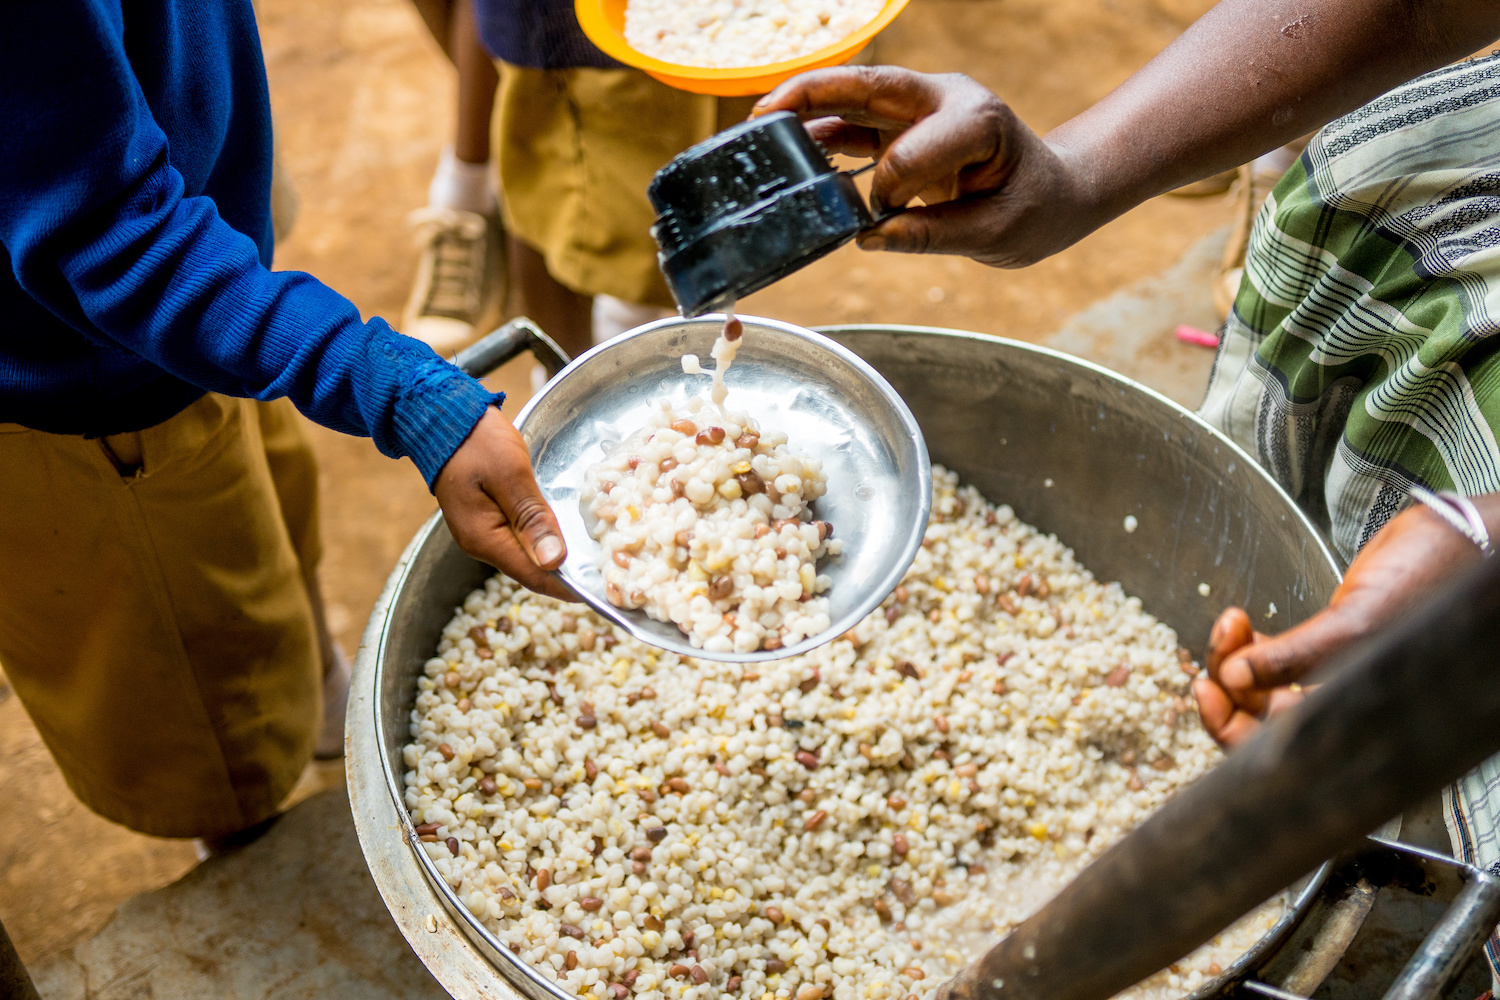
Key insight 2: Adjusting for meal quality allows a more realistic assessment of costs and efficiency
Not all school meals are nutritionally equal. To account for variation in food content, we adjust per-child costs using two dietary diversity benchmarks: the FAO’s Cost of a Healthy Diet and the Minimum Dietary Diversity index.
After adjusting for nutritional diversity, the average cost of a school meal in low-income countries doubles, from $110 to $228, highlighting the limited diversity in school menus common in these contexts. In contrast, adjusted costs in high-income countries decline slightly—from $665 to $625, reflecting meals that already meet minimum dietary diversity and offer scope for efficiency gains without compromising nutritional quality. These gaps between actual and adjusted costs suggest that reaching more ambitious nutrition goals—especially for vulnerable children—would require substantially more investment in many lower-income settings (Figure 3).
But among low-income countries themselves, the variation in adjusted costs is greater than the variation in unadjusted costs. This suggests that some programs are significantly more efficient than their peers in delivering nutritious meals. It also indicates that quality-adjusted costs offer a clearer picture of relative efficiency, helping to identify good practices and promote peer learning across systems in resource-constrained environments.
Figure 3. Adjusting cost for dietary diversity

Key insight 3: School meal programs in low-income countries often achieve greater economies of scale
Existing evidence suggests that school meal programs are among the few education interventions that can scale without losing effectiveness, particularly in terms of improving learning outcomes. Our analysis adds new insight to this conversation: many low- and lower-middle-income countries have not only scaled their programs, but have done so while keeping per-child costs relatively stable or even lower—achieving greater economies of scale than many of their higher-income counterparts.
We developed a Cost of Scaling Index (CSI) to track how costs change relative to coverage. A CSI below 1 indicates that programs are expanding faster than costs are rising. Across 48 programs with five-year data, the median CSI was 0.94. The programs with the lowest CSI are those in low-income countries.
Figure 4. Cost-scale dynamics over 5 years for long-term programs


Note: These are programs that have data in both Wave 1 (2018) and Wave 3 (2023). Black connecting lines designate programs with “adequate funding” as per officials responding to the survey, whereas red connecting lines designate “inadequate funding.”
For example, Nepal expanded coverage eightfold—from 400,000 to 3.3 million children—between 2018 and 2023, while total costs increased only fourfold (Figure 4). Benin achieved similar gains. In contrast, Uruguay’s costs nearly doubled even as coverage declined.
Even after adjusting for dietary diversity and meal days, most low-income programs still exhibit relatively stronger economies of scale, demonstrating that scaling is possible even under tight resource constraints. But without parallel improvements in meal quality, there is a risk that disadvantaged children will continue to miss out nutritionally.
Key insight 4: Program design matters—but not the same way everywhere
We explore the relationship between implementation choices and cost. A few patterns stand out:
- Targeting: Individually targeted programs tend to be cheaper per child—but only in upper-middle and high-income countries. In low-income settings, administrative burdens and widespread food insecurity are likely to reduce the cost efficiency of individual targeting.
- Sourcing: Local food procurement is associated with lower nutrition-adjusted costs, possibly due to savings on transport and storage or better access to seasonal produce. However, this correlation is limited to programs that have reported adequate funding to meet their objectives.
- Meal preparation: On-site meal preparation tends to be more expensive, especially in adequately funded programs. Centralized kitchens may offer cost savings, but policymakers may choose on-site models to promote employment or community participation. These findings reflect a tension between cost efficiency and broader social goals.
These findings suggest that operational features can be an important driver of efficiency, especially when nutritional quality is taken into account. However, their relevance for cost efficiency often becomes apparent only once programs receive minimally adequate funding
Food for thought for policymakers and donors
This new evidence on the cost, quality, and operational characteristics of school meal programs around the world offers useful guidance for policymakers:
- What’s in the school meals matters: Many school meal programs lack sufficient funding to meet basic nutritional standards. If school meals are to support child development and learning, nutritional content and dietary diversity—not just calories—should be central to budget allocations and overall financing strategies.
- Efficiency in coverage should be matched by efficiency in quality: While low-income countries operate with tighter budgets, many demonstrate greater economies of scale and cost-conscious delivery models. But expanding coverage alone is not enough. Support for these systems should aim to achieve two objectives: improving the nutritional quality of meals while continuing to scale access efficiently.
- Program delivery must be context-specific: Strategies that are cost-efficient in one context may not be feasible in another. Targeting, sourcing, and meal preparation models must be adapted to local infrastructure and markets.
What’s next: Financing and delivery models that sustain progress
Our analysis points to the next frontier in school meals policy for many low- and middle-income countries—moving beyond a focus on expanding coverage to refining the economics of delivery and financing. Many low-income countries show that it is possible to scale programs cost-effectively. The challenge now is to ensure that growth is accompanied by nutritional adequacy, fiscal sustainability, and operational innovation.
Going forward, the priority may need to shift to refining operational models that account for dietary standards, scalability, and local constraints. This means:
- Designing financing models that balance efficiency, effectiveness, and equity;
- Understanding the cost drivers of different delivery modalities;
- Linking operational decisions to long-term outcomes in learning, nutrition, and productivity.
By addressing these next-generation challenges, governments and partners can ensure that school meal programs become not just broader in reach, but deeper in impact—delivering lasting benefits for the children who need them most.
Topics
DISCLAIMER & PERMISSIONS
CGD's publications reflect the views of the authors, drawing on prior research and experience in their areas of expertise. CGD is a nonpartisan, independent organization and does not take institutional positions. You may use and disseminate CGD's publications under these conditions.
Thumbnail image by: GPE/Translieu