
A widely held view is that there is a severe shortage of health workers in low- and middle-income countries, particularly in sub-Saharan Africa. There is no doubt that many countries suffer from severe shortages of various kinds of specialized health workers, for instance, OB/GYNs and surgeons. But does this mean that primary care health systems as a whole suffer from the same problem?
Much of the evidence for aggregate, generalized shortages comes from modelling exercises that ask how many primary health care workers—doctors, nurses, and others—would be required in various countries for specified package of services at target rates of “providers per population” or similar ratios. These exercises answer an important planning question.
But they do not tell us whether the current systems are identifying and allocating existing health workers where they are needed the most; nor whether adding more health workers might be able to reach unmet patients’ needs. Based on existing studies, it is very difficult to understand how general the workforce shortage is in primary care and how it manifests as high workloads for existing providers.
Our new paper provides that evidence.
We combine a review of a literature focused on multiple aspects of human resources in healthcare with analysis of an unusually rich dataset assembled by the World Bank through its Service Delivery Indicators program. These indicators provide unique data on 7,915 facilities, each physically visited by survey teams, as well as matched data on the medical knowledge of 14,367 healthcare providers working in these facilities. The data were collected across 10 countries in sub-Saharan Africa—Kenya, Madagascar, Malawi, Mozambique, Niger, Nigeria, Tanzania, Togo, Sierra Leone, and Uganda. Note that the emphasis in this dataset, and in our paper, is on primary care only—the first point of contact for many patients.
Here are four questions and answers that explain what we found.
Q1. What did you find in your review of the literature?
Going in, we expected a voluminous literature based on clinical observations and time-motion studies detailing the workloads of clinicians. We were surprised by how little evidence we found. As we write in the paper:
“ . . . a striking feature of the literature on human resources for health is that it is quite difficult to find direct estimates of the caseloads of health-care workers. Coupled with the lack of reliable administrative data, even basic features of caseload distribution in these settings are hard to characterize.”
Given the paucity of direct evidence, we instead examine three different types of empirical studies:
- those based on direct observation or survey responses of patient counts to measure provider caseloads,
- those based on sending incognito “standardized patients,” who go through the normal care-seeking process and record both their own waiting time to see the provider and the length of the queue, and
- those that try to uncover the link between caseloads and quality of care via variations in physician supply.
The results from this review are remarkably consistent: Across each of these types of studies, there is little evidence that heavy workloads are a generalized, first-order constraint on the quality of primary care. Here are examples of some of the findings:
- The causal evidence does not find any evidence of a link between caseloads and quality of care. This is perhaps not surprising given the overall workloads. For instance, Kovacs and Lagarde (2022) find that health care providers in rural Senegal saw only 5–9 patients a day and spent less than 2 total hours on consultations. Interactions with providers are short, typically lasting between 3 and 6 minutes, despite substantial unused capacity, not because providers are busy.
- Studies that have looked at what happens when health systems add in more health care providers find zero impact on health outcomes. A striking study is that from Okeke (2023), who randomized the addition of a mid-level healthcare worker in Nigeria. He reports no impacts on health outcomes—although in the same experiment, when a doctor was added, health outcomes improved. What was missing was quality, not quantity.
- A third type of study, using standardized patients, finds extremely variable waiting times. For instance, in a study of two Indian cities in 45 percent of interactions no other patients were waiting and 65 percent had a queue of 1 or fewer waiting patients. But 5 percent did have more than 10 patients waiting (Kwan et al. 2018).
Q2. Did the finding that healthcare providers have substantial unused capacity hold up in the new data?
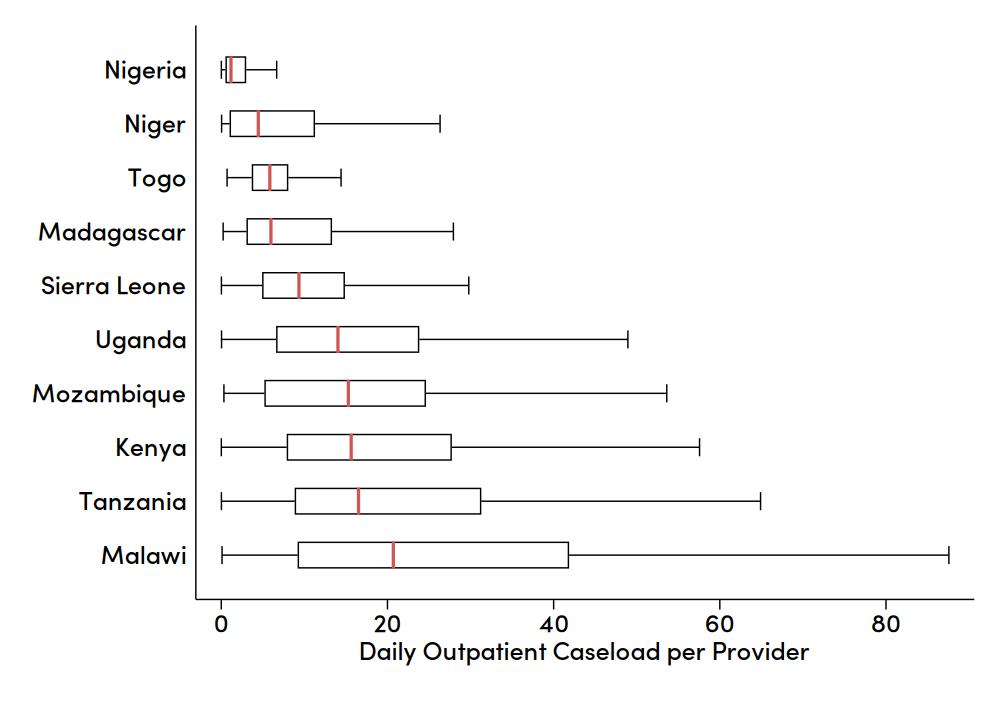
Yes, as shown in the figure below.
Figure 1. Daily outpatient caseloads faced by providers, by country
Source: Authors’ calculations using Service Delivery Indicators (SDI) survey data.
Note: This figure summarizes the distribution of daily outpatient caseload per provider across all facilities in the sample by country. The vertical red lines indicate the medians and the box endpoints indicate the 25th and 75th percentiles of the distributions. Outside values as defined in Tukey (1977) are excluded; the adjacent values are represented by the endcaps. All distributions are top-censored at 200 outpatients per day for display purposes. Box-and-whisker plots, one per country for the ten countries, of the distribution of daily outpatient caseload per provider. Red vertical lines mark the medians and box endpoints mark the 25th and 75th percentiles.
As we write:
“The median facility in the average country sample saw on average 25.9 patients per day, ranging from 2.1 in Nigeria to 87.2 patients per day in Malawi. The median provider in the average country saw on average 10.9 patients per day, with country-level medians ranging from 1.2 (Nigeria) to 20.7 patients per day (Malawi). A provider who saw 10.9 patients per day would face a one-hour-and-40-minute workday in addition to other duties if providers were spending 9 minutes per patient, which is the highest mean consultation time observed in LMIC settings (Irving et al. 2017). Given that the mean consultation time across LMIC (low- and middle-income country) settings is usually closer to 5 minutes, it could well be the case that the typical SSA (sub-Saharan Africa) provider spends no more than one hour a day seeing outpatients.”
Q3. This is very difficult to believe. We have often seen very large queues in health clinics and everyone complains about long waiting times.
How can these numbers be reconciled with the long queues that patients routinely report—and that many of us have seen first-hand? This was one of the most common questions we encountered when presenting the results. The answer turns out to hinge on the distinction between the experience of the average provider and the experience of the average patient.
The key is simple: The average healthcare provider has substantial unused capacity, but the average patient visits a relatively busy provider.
How can this be? Consider a very simple example of a country with 10 doctors and 100 patients. Imagine that every single patient goes to one doctor, say Doctor #10. Then, the average caseload across the 10 doctors is 100/10 = 10, which is arguably not very heavy. But the average patient visits Doctor #10, and Doctor #10’s caseload of 100 patients is extremely high! So, the experience of the average patient is that the doctor is very busy, but the experience of the average doctor is one of substantial unused capacity. Note where this comes from: a significant variation in caseloads across doctors—a small segment of the full healthcare workforce has to provide the bulk of care in the system
This is what we then started focusing on, and this is precisely the pattern we found in the data. If caseloads were evenly divided, you would expect the busiest 20 percent of providers to see 20 percent of the patients. But in the data, the busiest 20 percent of providers actually see between 40 percent (in Togo) and 67 percent (in Nigeria) of all patients. When we combine the uneven caseloads with mathematical insights from the theory of queues, we indeed recover that many patients will face significant queues and high waiting times. We write:
“In summary, caseloads are indeed substantial at the busiest facilities in each country, but only the very busiest providers have caseloads that would commit them to consistently serving patients throughout a full workday. Many providers instead operate under conditions of excess capacity. The variation in caseloads also implies that most patients are seen by providers whose workloads are consistent with long queues in our simulated data. Thus, the average patient visits a busy provider and faces a large crowd. It is this disjunction between the provider’s and the patient’s experience that allows us to simultaneously explain why the average provider operates under conditions of excess capacity, but most care-seekers report overworked providers, long wait times, and service delays.”
Q4. Anything else to add?
Yes! Beyond providing some of the first evidence on clinical workloads, we have been interested in understanding who the underutilized workers in the health system are. Our interest is motivated by the observation that, while unused capacity implies that we are spending money on training healthcare workers who end up seeing very few patients, it may also have implications for overall quality in the health system depending on which doctor sees more patients. To see this, suppose there is a health system with two providers: Doctor A, who scores 80 (out of 100) on a measure of quality and Doctor F, who scores 20. The average doctor therefore scores 50. However, if 1/4 of patients see Doctor A and 3/4 see Doctor F, the average interaction quality would be 35. But if we switched the shares so that ¼ of patients saw Doctor F and ¾ of patients saw Doctor A, the average interaction quality would increase to 65, with no change at all in the quality of either Doctor A or Doctor F’s performance.
So, we asked a simple question: Do the most competent doctors see the most patients?
The answer, in these data, is “No.”
In the figure below, the X-axis shows the competence of different healthcare workers, and the Y-axis shows their patient load. The dashed line then shows how caseloads and competence are linked in the data; the solid line shows what we should have seen if the most competent doctors also saw the most patients, up to a capacity constraint. As is clear, in no country is competence related to caseload. Indeed, it seems like caseloads are evenly distributed across the competence distribution in virtually every country. In Mozambique, the 20 percent most competent providers see less than the equal share (17 percent) and, even in Nigeria, where the most competent providers see more patients, the share rises only to 28 percent.
Figure 2. Correlations between provider competence and caseloads, as observed and optimally allocated
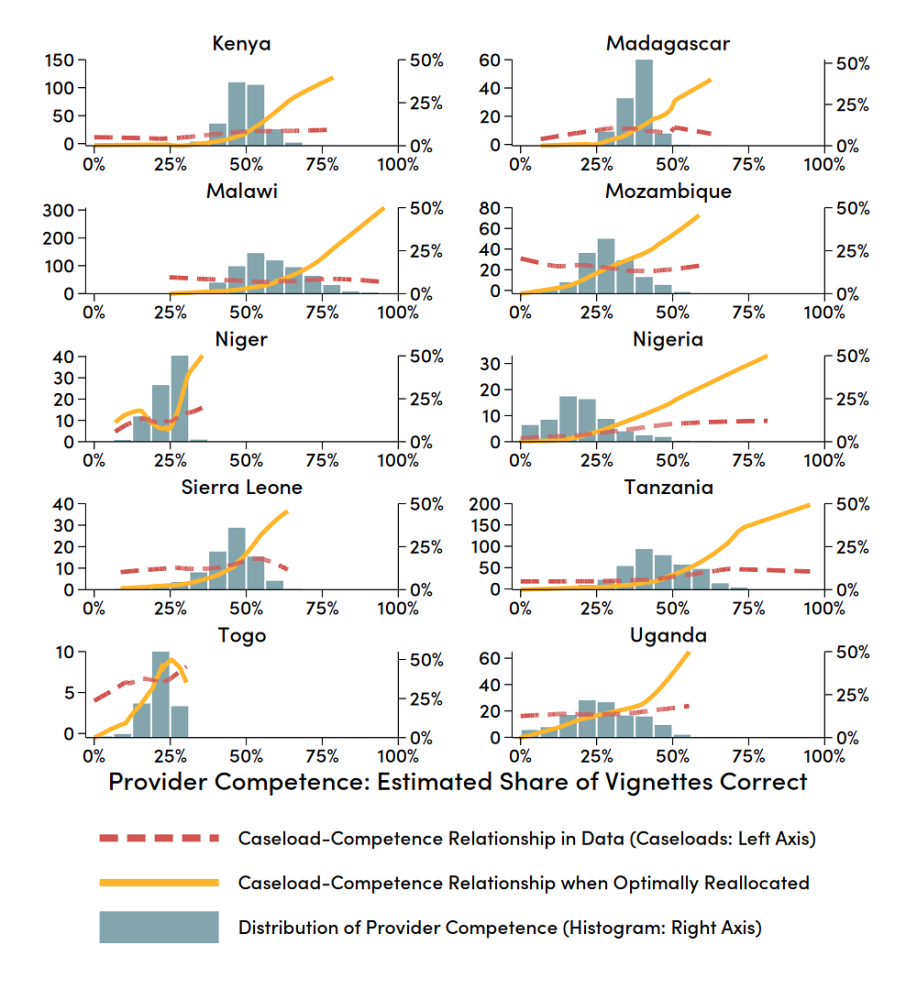
In sum, it looks like there is considerable unused outpatient capacity in every country in this sample, and indeed, in other countries where we have similar data, such as India and Vietnam. Moreover, that unused capacity is found throughout the competence distribution: some highly competent providers see remarkably few patients.
Conclusion
These findings should not be interpreted as a call to reduce the healthcare workforce or to indiscriminately increase the workload of existing doctors. Instead, they are a call to examine how health systems match resources to needs. Concerningly, they suggest that these health systems simultaneously contain highly skilled doctors whose talents are often unused, while other facilities face high congestion, and no effective policy in place to connect the two. In this case, then there is little reason to expect that more providers would meet unmet needs, because the health system is already failing to mobilize skilled practitioners who stand ready to do so. The reassessment offered here suggests a different way forward: new staffing commitments must be demonstrably delivered either at higher quality or, alternatively, better allocated than the human resources currently available in these systems.
Jishnu Das will present the paper's findings at the annual ODI Global Public Finance Conference on September 30. You can register to join online here.
Topics
DISCLAIMER & PERMISSIONS
CGD's publications reflect the views of the authors, drawing on prior research and experience in their areas of expertise. CGD is a nonpartisan, independent organization and does not take institutional positions. You may use and disseminate CGD's publications under these conditions.
Thumbnail image by: Yashkin Ilya/ Adobe Stock