Recommended
SPEECH
The End of Development Cooperation?
Blog Post
Don’t Give Up On Aid Just Yet
Official development assistance (ODA)—the measure of foreign assistance produced by the OECD‘s Development Assistance Committee or the DAC—is the most used metric for tracking aid flows, comparing countries’ generosity, and assessing the level of resources available to developing countries. But while it is arguably the most important, ODA is not the only official finance that DAC countries provide. And excessive focus on it can be misleading.
Understanding other financial flows is becoming increasingly important, as aid budgets are being stripped back in favour of more transactional approaches. But expanding the scope of analysis beyond ODA is hard given the sharp drop-off in transparency that occurs when less concessional flows are considered. In this blog I highlight that by ignoring other official flows (roughly, official finance not concessional enough to be counted as ODA), analysts are significantly misinterpreting trends in development finance, and that World Bank debt statistics suggest that OECD data is not telling the full picture.
Advocacy organisations, analysts and officials should acknowledge this new reality and stop judging countries on ODA alone. DAC countries should facilitate better analysis by providing better, more readily usable data on all transactions that have a developmental purpose. This blog accompanies analysis undertaken for the Gates Foundation that provides an overview of some of the largest gaps in our understanding of development finance.
A post-aid world has less data
It is an increasingly common view that we are in (or should be preparing for) a “post-aid world”. While others have argued that aid will continue to play an important role, it is almost certainly the case that ODA will decrease in importance relative to other development finance flows in the coming years. Many countries have already cut their ODA budgets and many more are planning to do so, as emphasis shifts towards investments rather than traditional aid. This is also true for climate finance, for which goals have always been agreed explicitly based on a broader interpretation of finance than just ODA.
This is already a problem. Between 2014 and 2023, DAC members have disbursed $151 billion in other official flows (OOF—a catchall category that’s defined more by what it isn’t than by what it includes), an amount similar in magnitude to total disbursements from the World Bank’s International Development Association over this period ($185 billion). And yet these flows were largely absent from discussion of the DAC’s development activities. This is partly because of how little we know about them: often not even the borrower or sector are recorded, let alone loan terms or concessionality. For Japan, which accounts for 27 percent of the $151 billion in OOF over that period, we know nothing beyond the aggregate, annual figure.
In our related research paper, we document numerous situations in which ignoring these flows has distorted our understanding of donors’ contribution to development. Below, we discuss a few examples.
EU institutions: ODA loans and arbitrary thresholds
In 2011, EU institutions recorded a dramatic increase in the value of ODA loans disbursed, which has been more or less sustained ever since. This led to an increase in overall ODA of 42 percent in that year. But in the same year, there was a collapse in OOF lending, from $8.3 billion to $1.0 billion (which meant that OOF and ODA together fell by $2.0 billion).
This was not a coincidence: a large chunk of EU lending (mainly loans from the European Investment Bank) was moved from the “OOF” bucket to the “ODA” bucket. Interest rates on EU loans are tied to the EU’s borrowing costs, which fell in 2011 because of the financial turmoil in the bloc at the time. This brought the loans above the (arbitrary) concessionality threshold to be classed as ODA. There was a real improvement in the terms faced by developing countries, but this may not have been substantial: there is little practical difference between a loan with a 25 percent grant element and a 24 percent grant element. The actual scale of disbursements remained essentially unchanged. The more astute commentary at the time did note this change, but only to say that figures pre/post 2011 are not comparable, not to highlight what we are missing by narrowly focusing on ODA.
Figure 1. EU Institutions, OOF and ODA loan disbursements, USD current prices
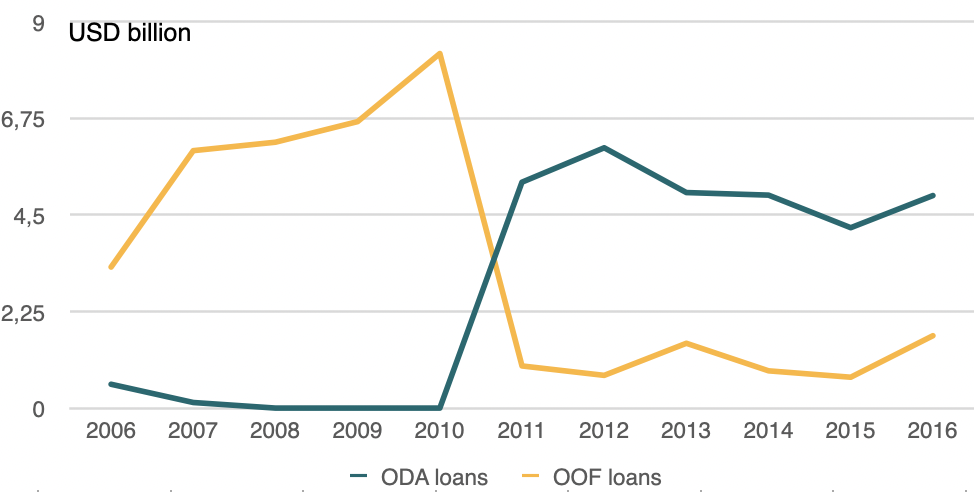
Source: OECD CRS
Korea: ODA increases, but total lending collapse
Korea increased its ODA by $1.1 billion between 2015 and 2023 (an increase of over 70 percent). It rightly received praise for this increase, but over the same period, OOF declined by 95 percent, from $12.7 billion to $0.7 billion. The net impact is a sharp reduction in development finance provision (of 77 percent). OOF and ODA are not equivalent and so it is impossible to establish what this implies about the developmental impact of Korea’s financing, (indeed, it is generally hard to tell what OOF even entails). But if OOF has any developmental value this evidently changes the narrative substantially. This did not seem to be addressed in Korea’s DAC peer review, which merely discusses the rapid scale up of ODA (i.e. the blue bars in Figure 2).
Figure 2. Korea ODA and OOF, USD billion, current prices
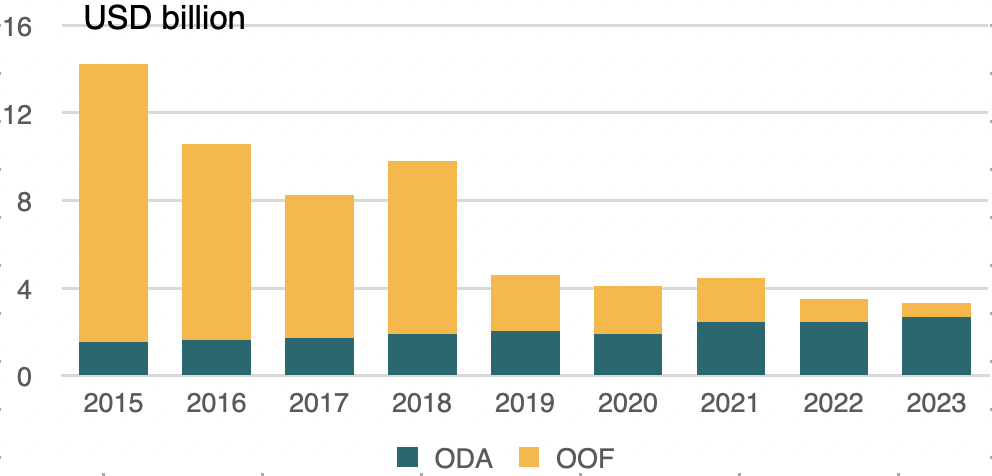
Source: OECD CRS
France and Japan: missing reflows
Data on both ODA and OOF are produced by the OECD DAC, and disseminated as part of the Creditor Reporting System (CRS). But comparing this data to other sources suggests further gaps. The World Bank International Debt Statistics (IDS) produces data on net debt flows from official providers. While the IDS data generally matches the CRS data quite well (after filtering grants and private transactions to make it more comparable) there are some contexts where the CRS paints a rosier picture than IDS. Figure 3 compares CRS and IDS data for two of the biggest lenders—France and Japan—for a selection of borrowers. The data matches well for some, but for Pakistan in particular the CRS appears to be missing substantial reflows. For Japan, this is likely because it reports no disaggregated information on OOF flows, and so it is impossible to know how much of the aggregate goes where. But OOF reporting is voluntary, and so for France it is possible that these are reflows on loans that they have simply chosen not to report. Without more data it is hard to tell, but either way, focusing on ODA alone misses important trends.
Figure 3. Dyadic debt flows, CRS and IDS (USD billion, current prices)
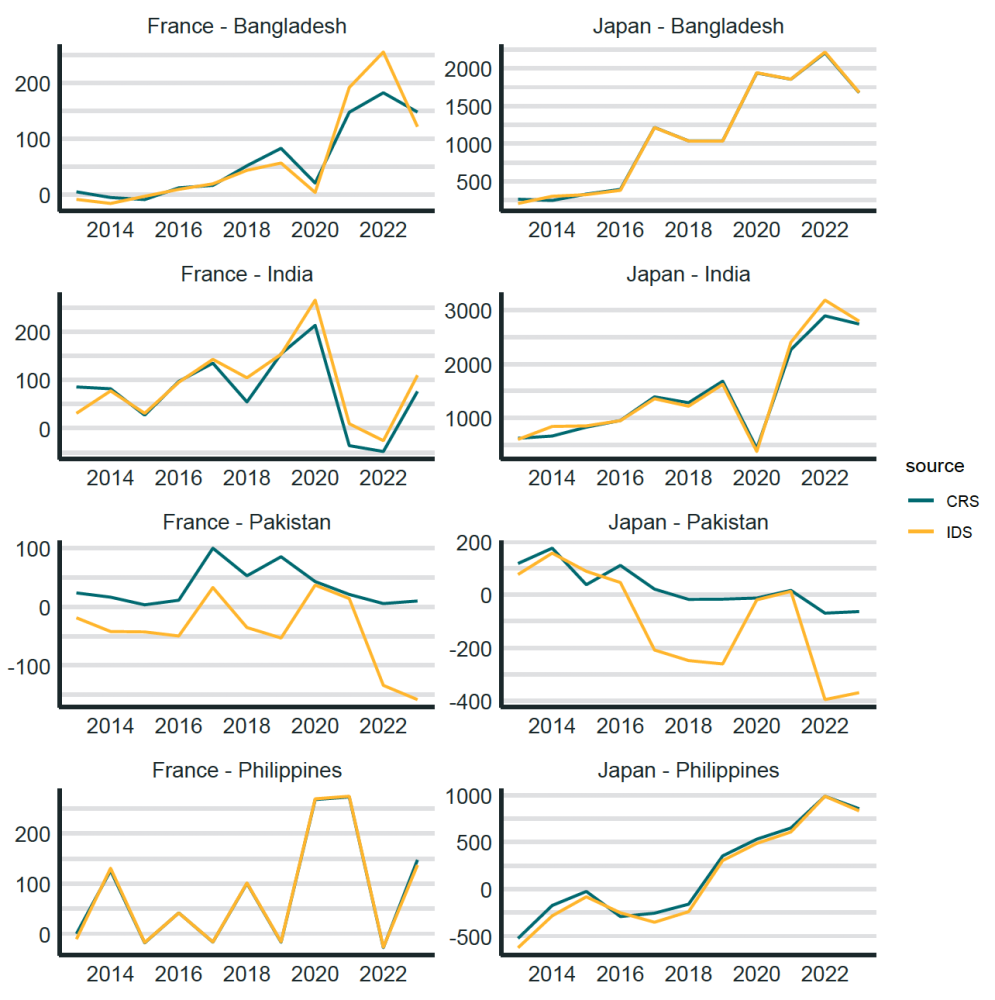
Notes: IDS data uses indicator “DT.NFL.BLAT.CD”. CRS data is filtered to include only loans (finance type between 420 and 431), to the public sector (channel code between 12000 and 12003, and no PSI flag), and excluding debt relief. Both ODA and OOF loans are included, but Japan does not report OOF in the CRS.
Source: World Bank IDS, OECD CRS
PSI rules could shine light on (part of) the problem
Historically, a large share of OOF comes from investments in “private sector instruments” (PSIs): investments that are predominantly (but not always) in the private sector and more resemble private transactions. We know so little about OOF flows that it is impossible to tell how much of the $151 billion spent over the last decade was in PSIs, but based on data after 2018 (in which year there was a variable added denoting whether transactions were PSIs) it is probably the majority.
This means that the transparency situation should improve in the next aid data release from the OECD, because the DAC has recently agreed new rules on measuring PSI transactions as part of ODA. These rules may be statistically incoherent, and many (including me) have argued that it doesn’t make sense to count PSI transactions as ODA at all. But the new rules do at least require that donors report a lot more information about PSI transactions, which should a) bring lots of data into one place that is currently scattered across annual reports of development finance institutions; and b) make them more visible by including them in the ODA measure. Although even with PSIs, a focus on OOF in previous years will be important to understand how much of the increase in PSI-ODA is genuine, and how much is reclassification of existing activities.
More focus on beyond-ODA flows from the DAC is still needed
But OECD data shows that there are still OOF loans that are not PSI transactions, to which we are paying no attention (and would struggle to say much about if we did). And World Bank data suggests that even that may not be the full picture.
This needs to change, so that lenders can be held accountable for the impact that this lending has, both positive (in bringing about climate and development goals) and negative (contributing towards debt distress). And becoming more transparent should be in the interests of countries as they attempt to claim more credit for contributing towards climate finance goals. A post-aid world needn’t be a murkier one.
Topics
DISCLAIMER & PERMISSIONS
CGD's publications reflect the views of the authors, drawing on prior research and experience in their areas of expertise. CGD is a nonpartisan, independent organization and does not take institutional positions. You may use and disseminate CGD's publications under these conditions.