Recommended
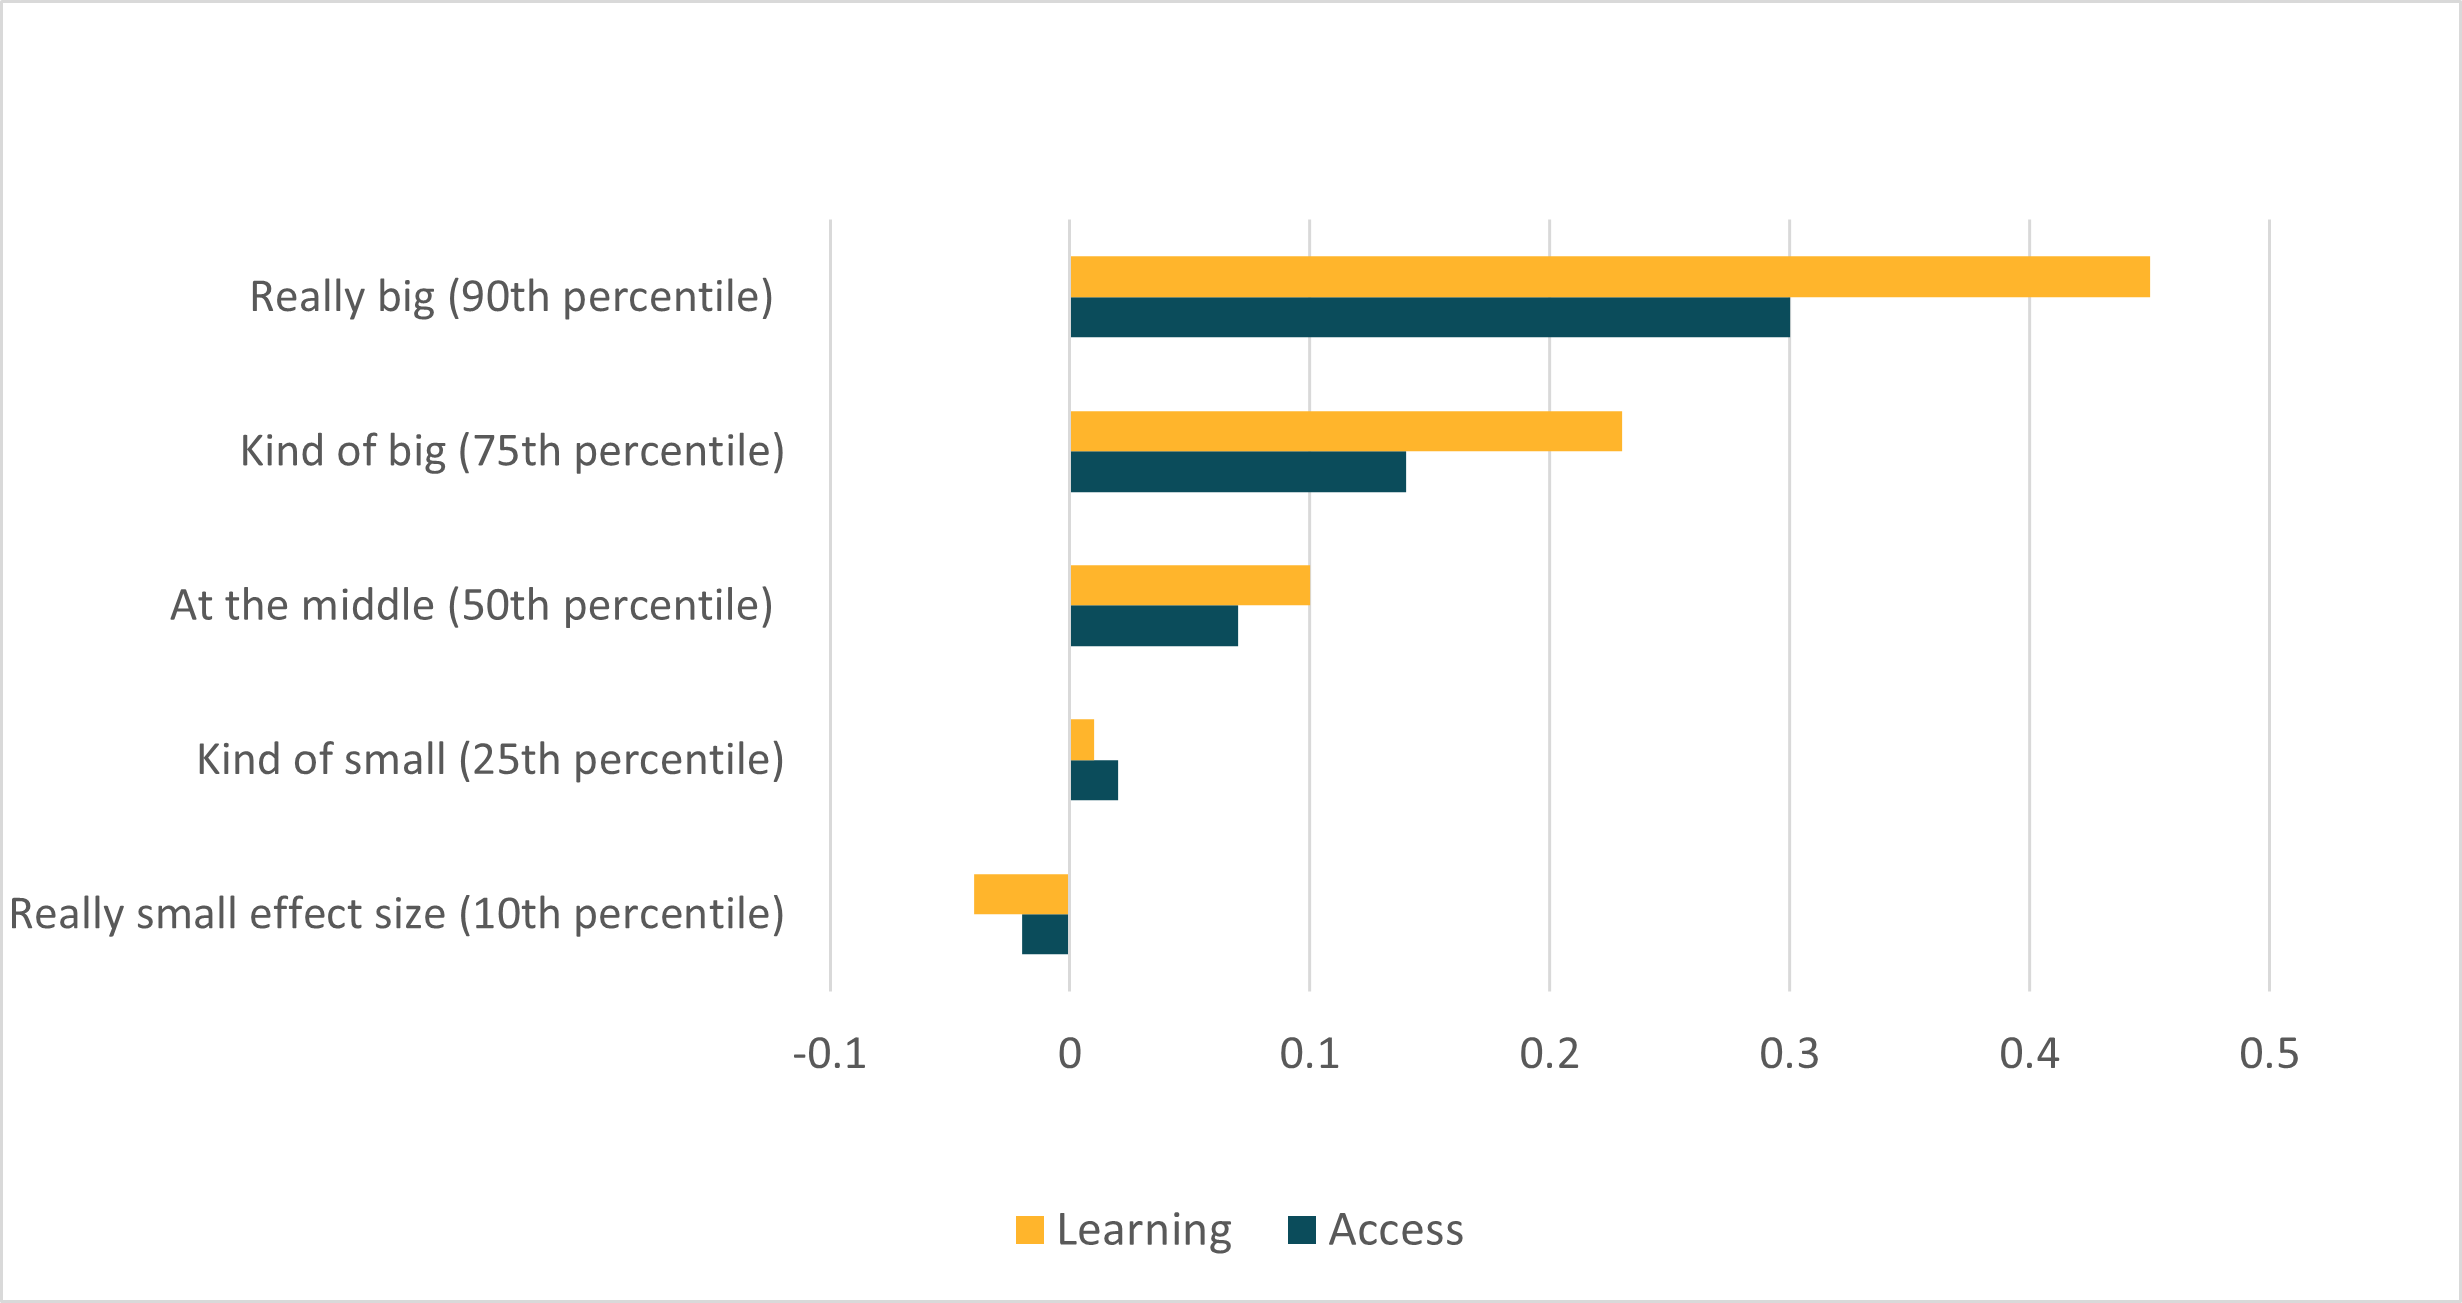


A donor comparing two reading programmes might reasonably start with the headline numbers. A programme in Nigeria reports an effect on learning outcomes of 0.42 standard deviations and is described as “highly effective and cost-effective.” A programme in Colombia reports a much smaller effect at comparable cost: 0.17 standard deviations.
So Nigeria looks like the better buy.
Until you look at what children actually learned. In Nigeria, children sounded out 1.5 additional letters and read an extra one-third of a word per minute. In Colombia, they read eight more letters, five more words per minute, and 9 percentage points more children reached the benchmark for their grade.
That should give us pause. A standardised effect size can make a small gain look large, or a larger gain look modest. When we see an education programme reported in standard deviations, the first question should be: a standard deviation of what?
Standardised effect sizes promise comparability, but they often don’t deliver it
Standardised effect sizes have become the common currency of education evidence. Policymakers, donors, researchers, and evidence synthesis bodies use them to compare programmes, rank interventions, and allocate scarce resources. They are useful because they convert different tests and outcomes into a single metric.
But in our new working paper, drawing on data from 197 studies of education interventions in low- and middle-income countries, we show that standardised effect sizes reflect the properties of the test, the sample, and the standardisation choices as much as genuine learning gains.
A standardised effect is a raw gain divided by the spread of scores in a reference group. When that spread is narrow, even a very small gain can look large. When the spread is wide, a much more substantial gain can look modest. Researcher choices on which reference group to use, which assessment to use or measured tasks to prioritise, whether to report for the full sample or for subgroups, and several other options can all have a large impact on the standardised effect size. This matters, because funding and policy decisions often follow the biggest-looking number, not the biggest learning gain.
The same reading gain can look 20 times larger depending on the study
In low-literacy settings, many children score zero on reading assessments. When most children are clustered at zero, the spread of scores is tiny. That means each extra word read per minute “buys” a much larger effect size.
Across 66 observations, we find that the same gain, one additional correct word per minute, corresponds to anywhere from 0.03 to 0.55 standard deviations (Figure 1). Put differently, the apparent value of one extra word per minute varies almost 20-fold across studies.
That cannot be right. One extra word per minute may matter more in some contexts than others and can carry more meaning in some languages than others, but its educational value cannot plausibly vary by a factor of 20.
Figure 1. The number of standard deviations represented by a one-word-per-minute gain varies twentyfold across studies

Notes: Standard deviations per additional word for 66 study × language × grade cells, each represented by the within-cell median where multiple observations exist. Bars are coloured by grade level; grey indicates grade not available because these two studies worked with household samples. Where a bar represents multiple grades, and the average is not an integer, we round to the higher grade (eight cases). The dashed line marks the overall median of 0.06. The ratio captures how many standard deviations each additional word per minute is "worth" in a given study.
Source: Rossiter et al., 2026.
Standardisation can make modest gains look like standout results
When we rank programmes by their raw gains in words per minute and compare those rankings with their standardised effect sizes, the ordering changes substantially (Figure 2). A study in Yemen moves from being the 5th most effective program by standardised effect to only the 58th most effective by words-per-minute gains. One in Nigeria drops from 28th to 56th. Programmes can move from the top third to the bottom third simply when raw gains are converted into standard deviation units. This changes which programmes look most effective.
Figure 2. Converting raw to standardised effects reorders programme rankings

Notes: Rank comparison of 85 positive dual-metric observations (standard deviation > 0 and words per minute > 0). Each observation is an individual effect. Different treatment arms, grades, and cohorts are not averaged. The vertical y axis ranks by the words per minute effect; the horizontal x axis ranks by the standard deviation effect. Lines are coloured by the absolute rank shift across the two metrics.
Source: Authors’ analysis, based on Rossiter et al., 2026.
Most studies do not show readers what children actually gained
The problem is made worse by reporting practices. Only 23 percent of the papers in our dataset report both raw and standardised effects. That means readers often cannot tell whether a reported effect represents a meaningful gain in children’s skills, or a small gain magnified by the assessment and the sample.
We are not arguing that researchers should stop reporting standardised effects. But they should not be reported alone. A single effect size can create the illusion of comparability while hiding the thing policymakers and donors most need to know: what children can actually do now that they could not do before.
Three ways to make education evidence more meaningful
First, report raw gains alongside standardised effects. Standardised estimates should be paired with the clearest possible description of what changed for children: more words read per minute, more letters identified, more children reaching a meaningful benchmark. The data are already available, and this is often the information policymakers and funders need in order to judge whether a programme made a real difference.
Second, anchor results to meaningful benchmarks. In reading, this means showing how many children moved from non-reader to emergent reader or crossed a fluency threshold where comprehension becomes possible. Benchmarks need to be language-specific and contextually appropriate; and they make results far more interpretable than standard deviations alone. They can also be used for all sorts of assessment or task, not just for reading fluency, and provide diagnostic information on which skills changed the most.
Third, use assessments that are well matched to children’s skills, and document them clearly. A fluency test may miss real progress among children who are still learning letters and sounds. A simple categorical test may be too crude for children already reading. Researchers should pilot their assessments, show score distributions, and report floor effects (many children scoring zero) or ceiling effects (many scoring perfectly). They can also easily report whether items are internally coherent, show which skill domains are covered and how responses are scored and combined.
As education measurement becomes more fragmented, the temptation to rely on single summary metrics will only grow. But the field should move in the opposite direction: toward more transparency, more context, and more direct reporting of learning.
When a programme is described as effective, the claim should be grounded in clear evidence of what children learned. Every study should leave readers able to answer a simple question: what can children now do that they could not do before?
For the full analysis, see The Illusion of Comparability Among Standardised Effect Sizes: Why Education Evaluations Should Report Raw Effects.
Topics
DISCLAIMER & PERMISSIONS
CGD's publications reflect the views of the authors, drawing on prior research and experience in their areas of expertise. CGD is a nonpartisan, independent organization and does not take institutional positions. You may use and disseminate CGD's publications under these conditions.
Thumbnail image by: Riccardo Niels Mayer/Adobe Stock