There are just eleven years to go to achieve the many targets under SDG4, the Sustainable Development Goal focused on education, and recent reports suggest things are woefully off-track. The UN General Assembly—taking place in New York this week—will be the platform for the announcement of various new initiatives and big funding pledges hoping to fast-track progress toward that goal.
With the spotlight on the global education aid architecture, we analysed the latest aid data from the OECD and UNESCO Institute for Statistics to see what it tells us about how much aid is going to education, where it is allocated, by who, and through what channels.
Chart One. Domestic spending on education dwarfs education aid.
Much of the talk at the UN General Assembly will be about aid to education. But the vast majority of education expenditure is domestically financed, with aid representing just a tiny share of total education spending. Convincing finance ministers to increase the share of domestic revenue allocated to education will raise substantially more money and is likely to be more sustainable than increasing education aid. Doing this by increasing domestic resource mobilisation through more progressive taxation is one strategy. Another is to address finance ministers’ reluctance to spend in the social sectors—for example, finding ways to turn education outcomes into more immediate fiscal returns—and getting better at providing them with more convincing information about the financial returns to well-educated citizens.
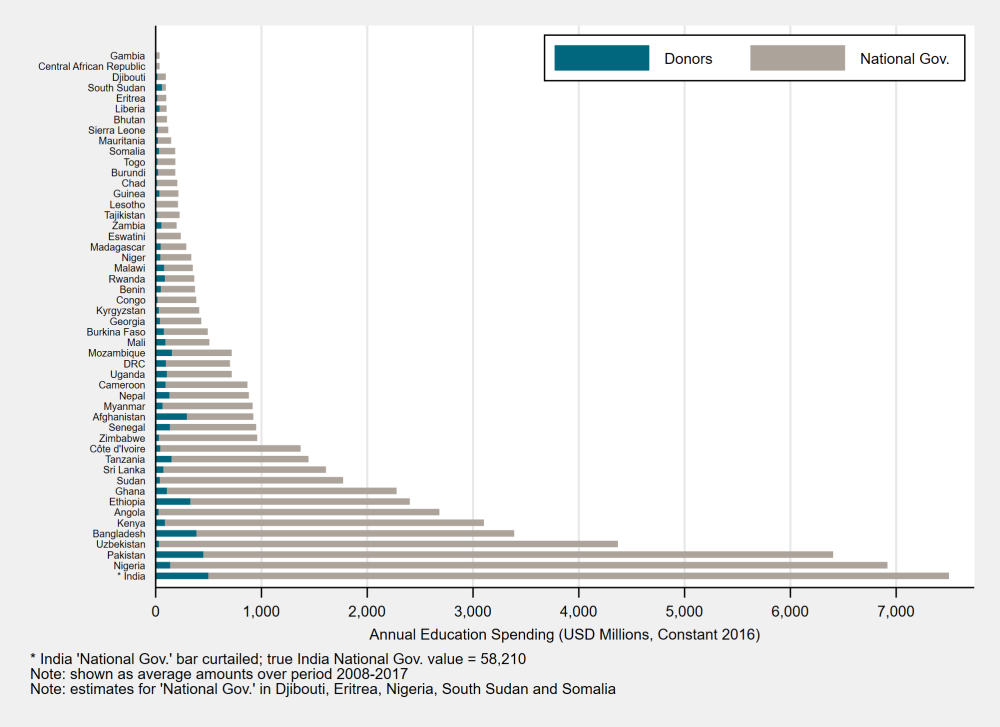
Chart Two. Aid to education has increased but has stagnated.
Despite the dominance of domestic finance in terms of volume, education aid continues to play an important role, especially for the most vulnerable groups that often lack access to any public education system. We see that aid to education has increased substantially since 2000. But unlike health, education aid has barely grown in the last decade and education’s share of sector-allocable aid has fallen.
But beyond volumes and cross-sectoral comparisons, what is more important is that finance is invested in things that will produce desired outcomes, rather than simply being spent on more of the same. By working closely with governments, donors’ relatively small contributions can improve how government money gets spent. Where the majority of recurrent expenditure in the education sector goes to compensation of employees, donors can improve the effectiveness of domestic spending by financing complementary programs that improve teaching and learning processes (for example, one trust fund in Ethiopia covered more than 80 percent of government discretionary funds at the school level).
Aid is also well suited to providing much-needed public goods and global knowledge which individual countries don’t have the incentive or resources to fund; for example research on improving cost-effectiveness or on how to improve literacy at scale. This would also include national data and assessment systems that provide the evidence on attainment and learning that governments and international bodies rely on for policy design—and which can be achieved at relatively low cost.
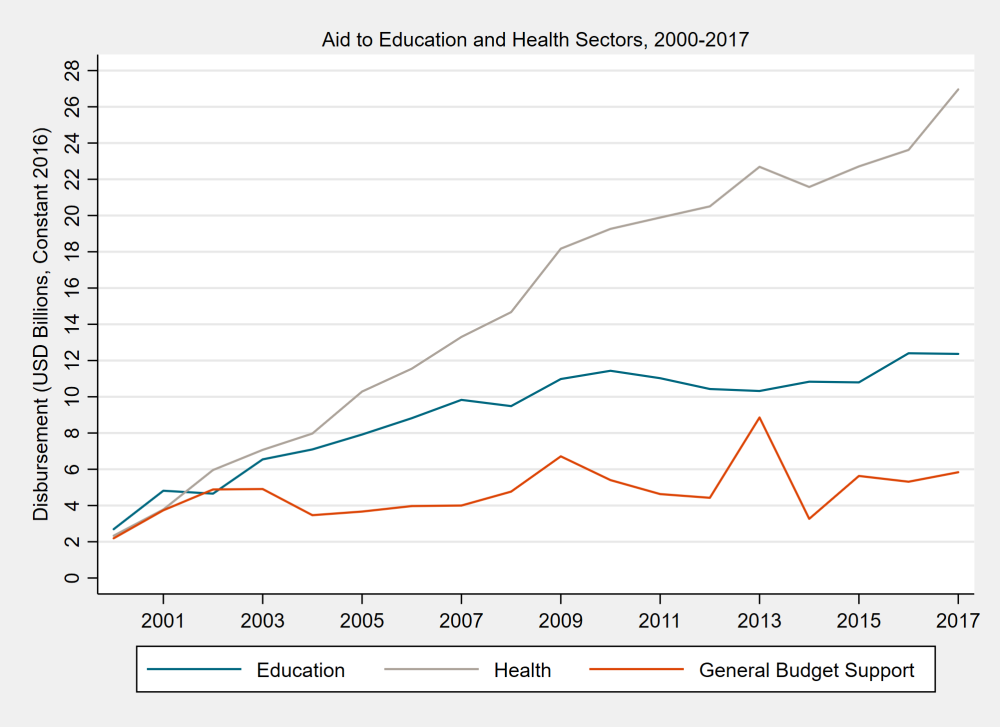
Chart Three. Bilateral donors have very different priorities for their education spending.
USAID allocates the vast majority of its education aid to basic education and until recently it had a laser-sharp focus on early grade reading. That’s changing with the launch of its new education strategy, which allows for far more flexibility in what USAID funds, although it is unlikely to shift a substantial proportion of funding away from basic education.
In contrast, Germany—the largest donor to education—allocates the greatest share of its funding to post-secondary education, particularly on scholarships for students in developing countries to study at higher education institutions in Germany. In 2016 Germany spent 47 percent of its education aid on scholarships: if this were excluded, Germany would rank 20th in education spend.
But it might be unfair to conclude that post-secondary spending is a less effective or even less equitable use of aid. What the spending data don’t tell us is (i) how scholarships are targeted—they may extend access to students from the poorest backgrounds who would otherwise not reach post-secondary levels; or (ii) what scholarships do that money does not, through increasing research output on education in Sub-Saharan Africa and South Asia or increasing the exchange of ideas across borders.
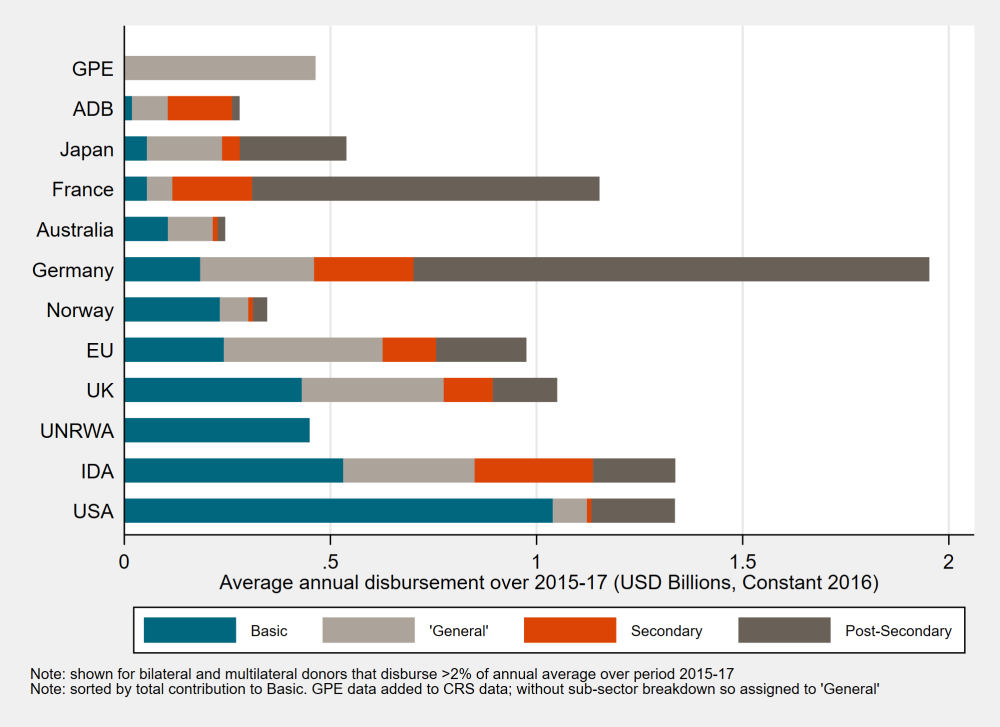
Chart Four. Children in low-income countries are not receiving the highest share of education aid.
If asked to name the two countries receiving the highest amount of education aid per school-age child, we suspect few would name Georgia (a lower-middle-income country) and Armenia (an upper-middle-income country). In fact, just four of the top ten countries according to this measure are low income.
The default expectation is that aid should benefit the most vulnerable countries but this is rarely the case. National self-interest and geopolitical and commercial considerations, as well as merit, need, and effectiveness all influence donor decisions about aid allocations.
Of course, this chart does not account for costs being much higher in some countries, but it does suggest that some richer countries are receiving a disproportionate share of donor finance for education. If we care about education for poverty reduction then reallocating aid may be considerably less difficult than doubling or quadrupling aid budgets.
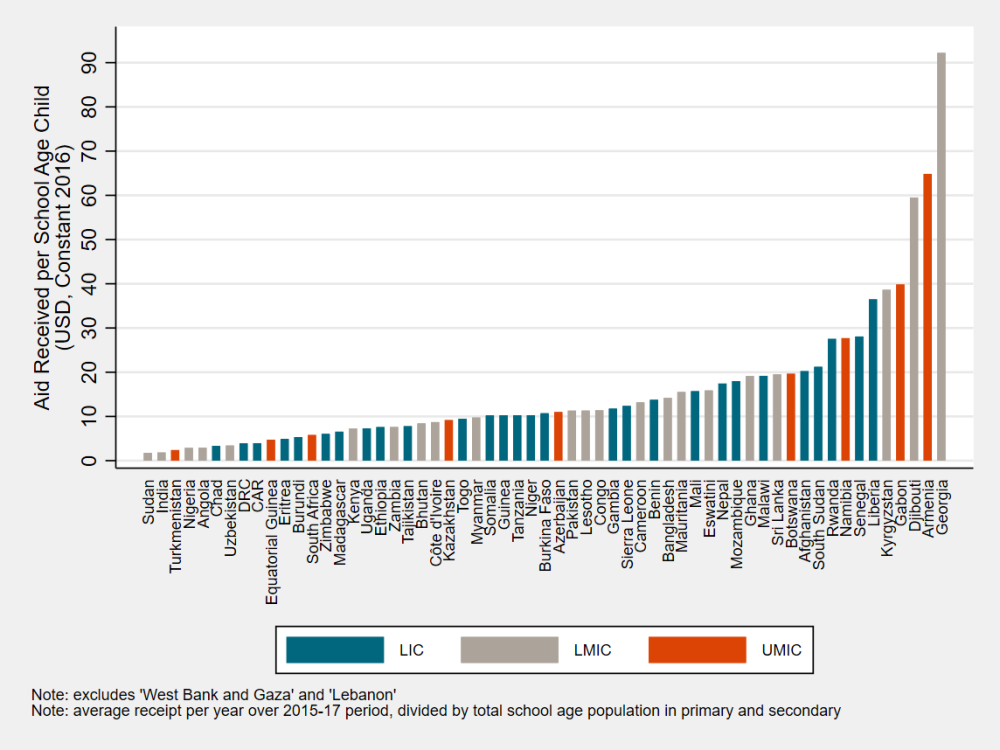
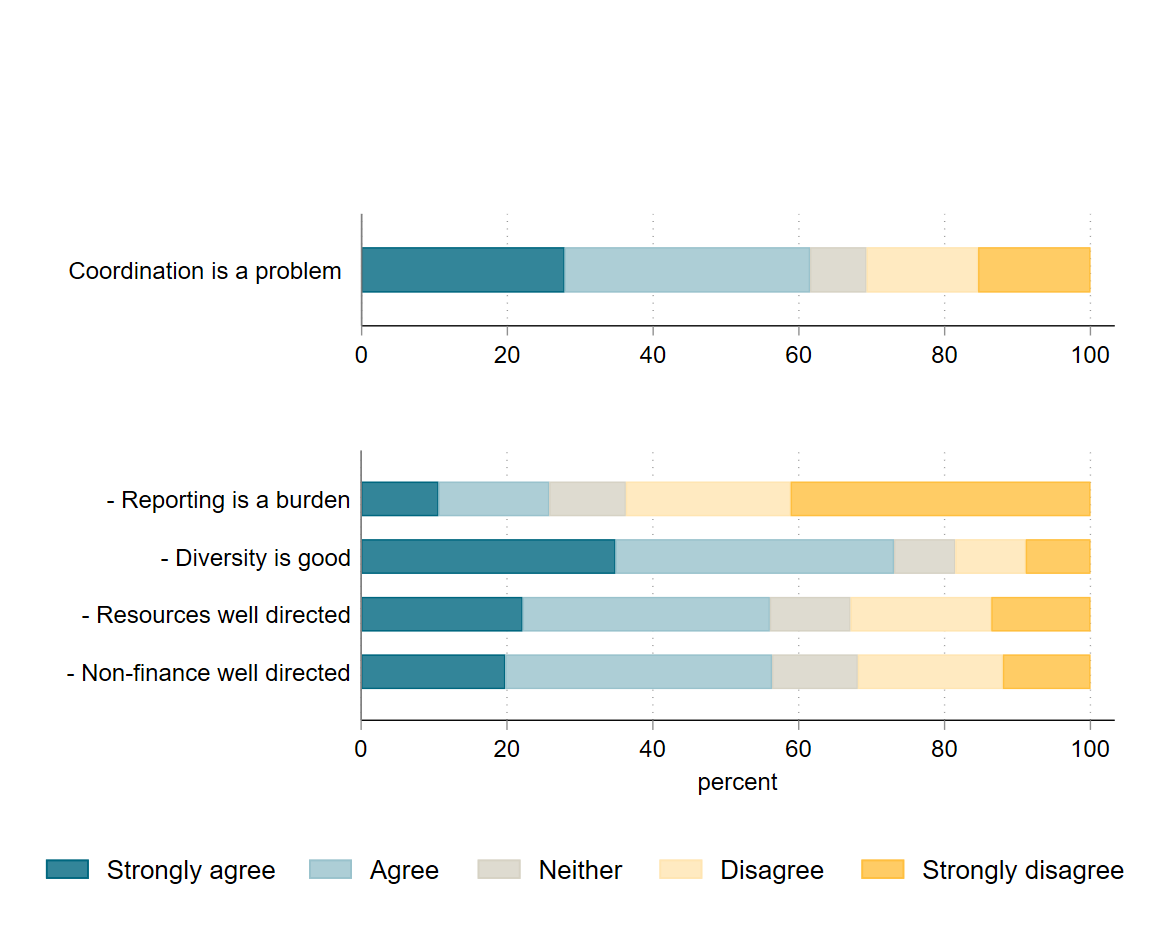
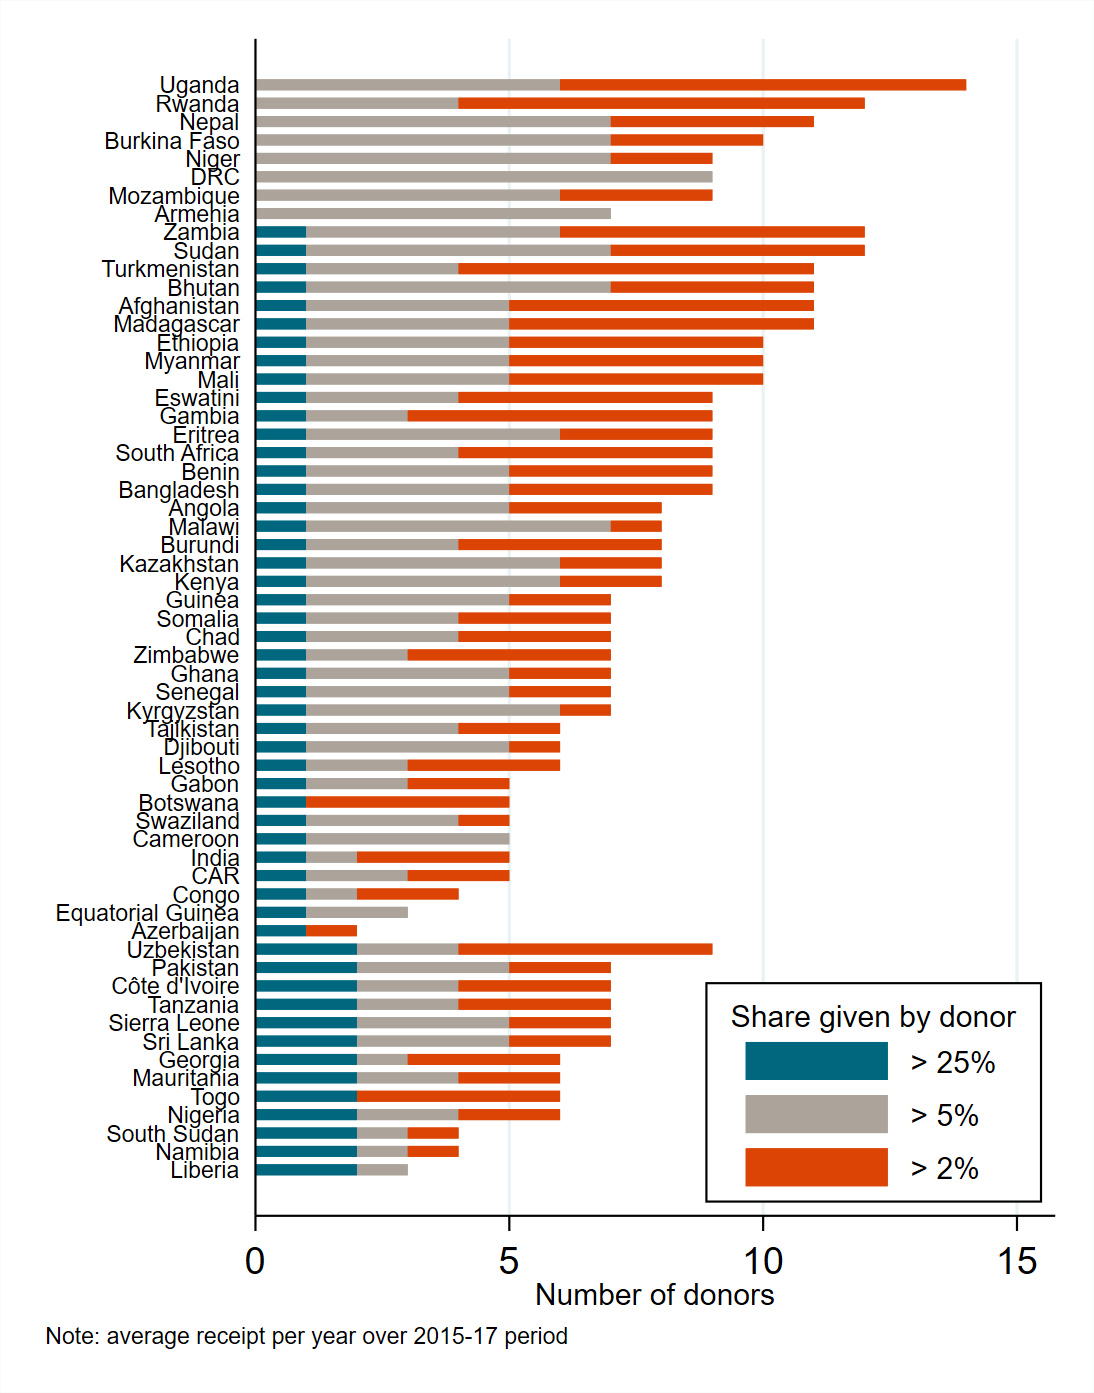
Chart Five. “Competition” between donors varies considerably from country to country.
In eight countries, no single donor gives more than 25 percent of education aid. In fifteen countries, on the other hand, more than 50 percent of donor finance for education comes from a single donor. Aid fragmentation is widely argued as being detrimental to development outcomes—if there are many small donors, aid recipients have to deal with hundreds of donor missions and navigate multiple application processes, requiring substantial time and effort by local senior staff. Conversely, the greater the number of donors, the less power held by a single lead donor—giving recipient governments more autonomy to identify their own priorities—and the greater the diversity of perspectives to help governments select better policies.
Recent research on donor concentration and division of labour suggests that generalizing judgments about the effect of aid fragmentation are misleading. Impacts will vary with each country and sector, but in all cases, sufficient administrative capacity in recipient countries reduces the negative and reinforces the positive effects of fragmentation.

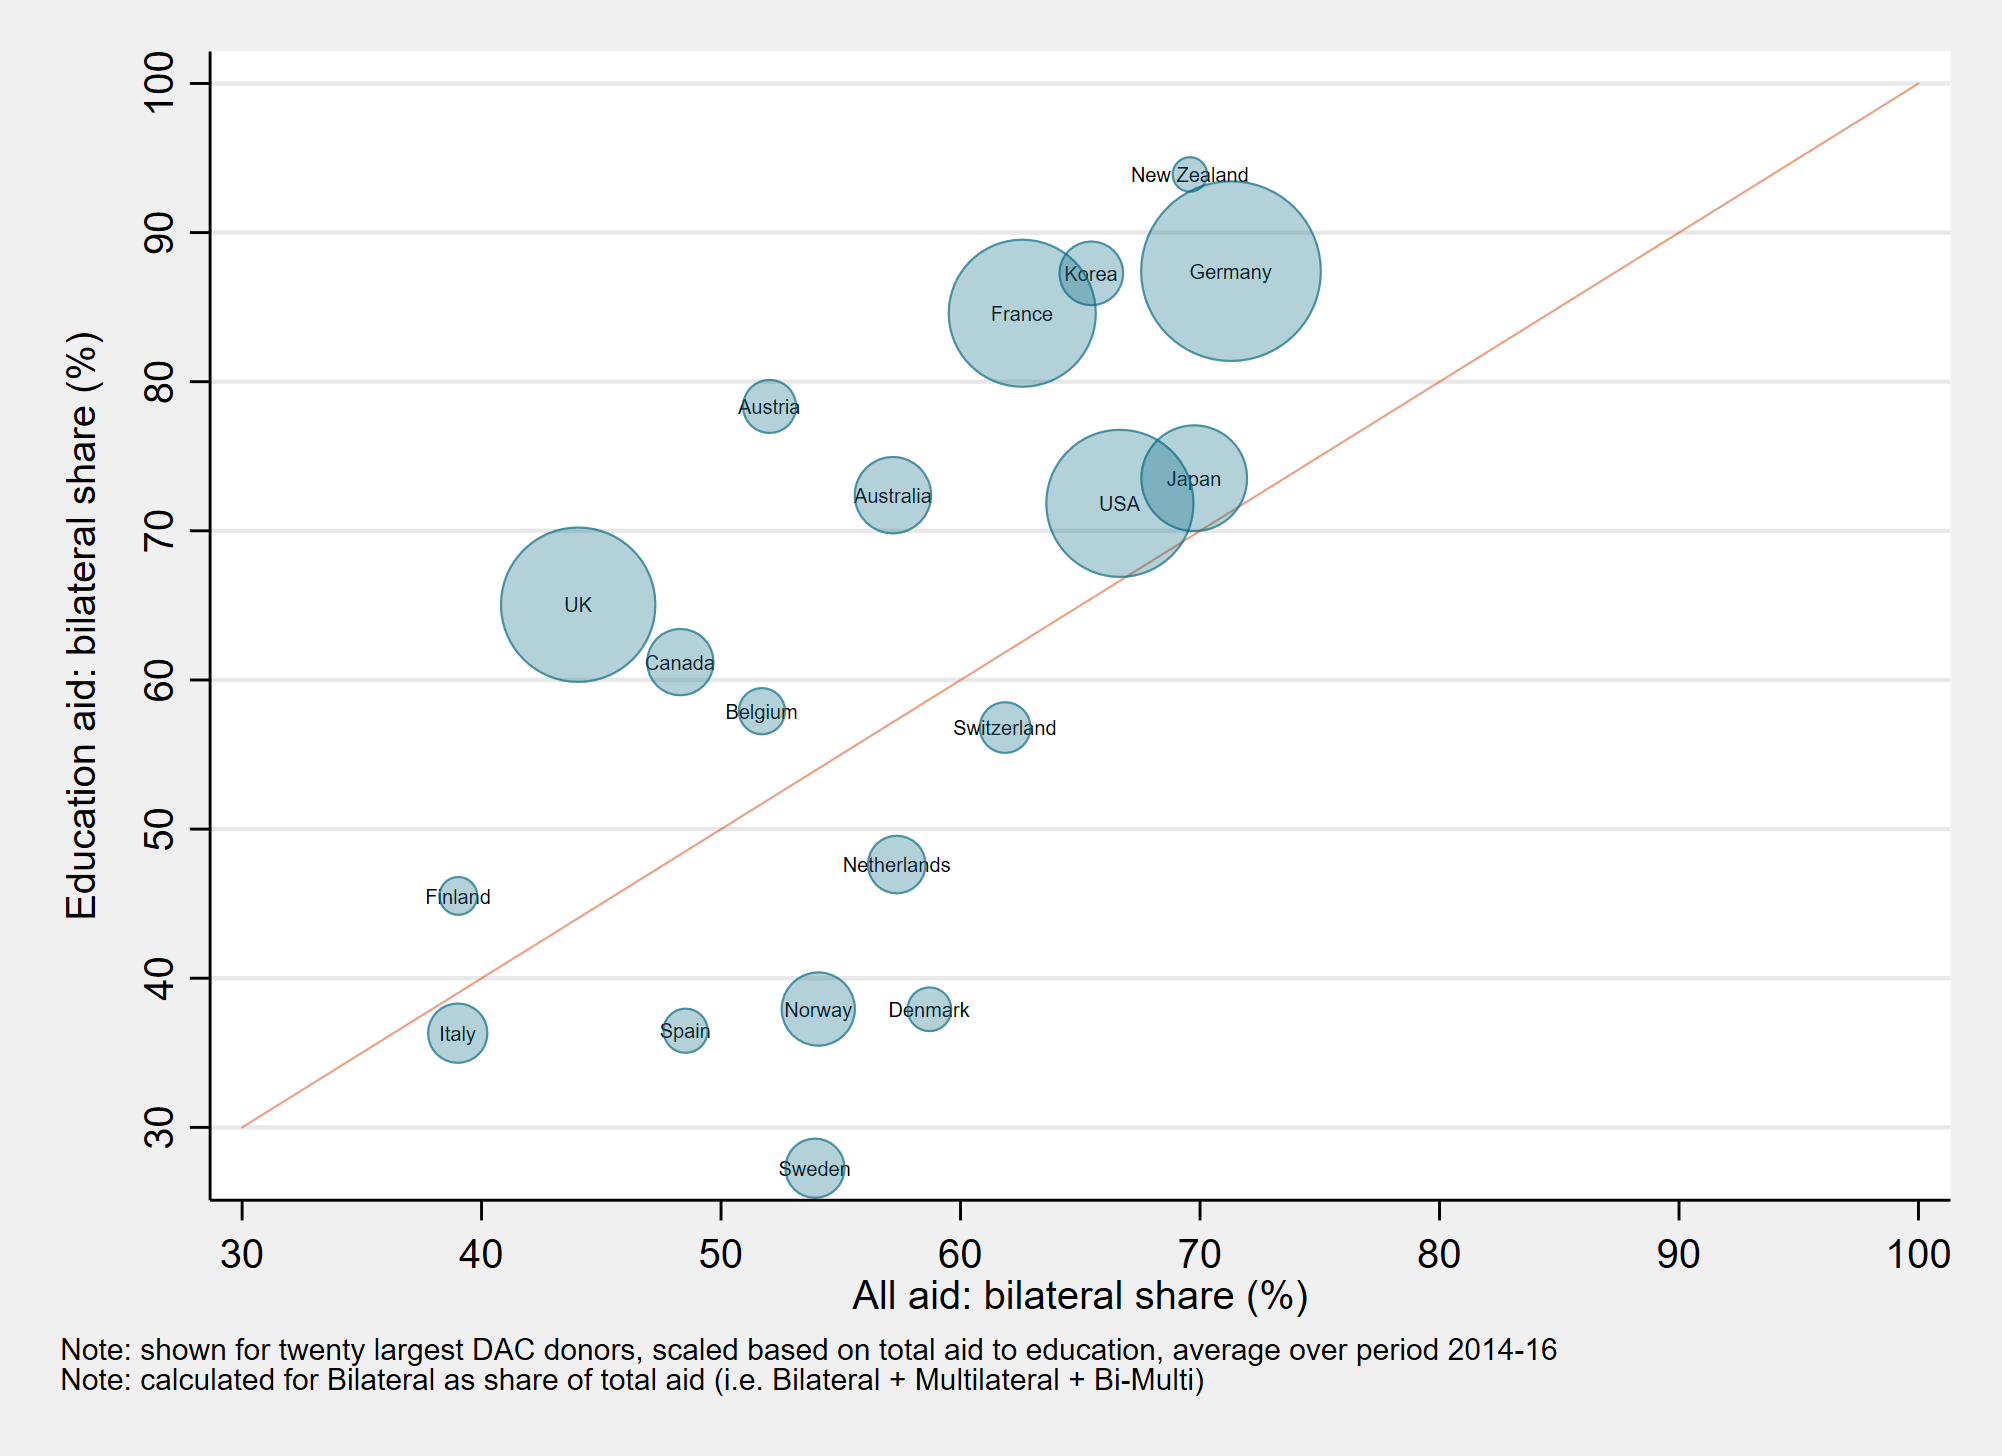
Chart Six. Compared with their overall aid allocation, large donors give considerably more education aid through bilateral (rather than multilateral) channels.
A 2016 ODI report provides reasons for donors to channel resources through multilateral agencies: it’s less politicised, more demand-driven, more selective in terms of poverty criteria, and a better conduit for global public goods. On the other hand, bilateral spending is more selective on governance criteria, with slightly lower administrative costs.
But we have very little data with which to compare the cost effectiveness of bilateral and multilateral aid and no recognised benchmark for an appropriate allocation across bilateral and multilateral channels. One reference that we do have is CGD’s Quality of Aid index that has a multilateral agency topping each of the four quality dimensions and, overall, multilaterals holding six of the top ten rankings.
It is informative to contrast bilateral spending in all aid with bilateral spending in the education sector. This shows (i) that there is substantial variation across donors in how they choose to channel their resources (if Norway can spend less than 40 percent bilaterally, could France, too?) and that (ii) most large donors give education aid disproportionately through bilateral channels. The UK, for example, disburses around 45 percent of all aid via bilateral channels, but closer to 65 percent of education aid.

Watch this space for much more from CGD on education aid, donor and government perceptions of fragmentation, and coordination at the country level.
Thank you to Aisha Ali, Lee Crawfurd, and Alexis LeNestour for their contributions to the data analysis and to Justin Sandefur for his comments on the blog.
Topics
DISCLAIMER & PERMISSIONS
CGD's publications reflect the views of the authors, drawing on prior research and experience in their areas of expertise. CGD is a nonpartisan, independent organization and does not take institutional positions. You may use and disseminate CGD's publications under these conditions.


