Recommended
Blog Post
The World Bank and Climate Projects: A Matter of Definition

Blog Post
Is Climate Finance Fixable?
Recently, there has been a spate of concerns being expressed about the amount that the World Bank is spending on mitigation finance in low-income countries (LICs)—whose greenhouse gas emissions are tiny and will remain so under any plausible circumstances. There are worries that doing projects that reduce already-meagre emissions takes finance away from much-needed development projects, such as providing infrastructure and electricity.
These complaints are understandable given that “mitigation finance” is widely understood as finance used to reduce greenhouse gas (GHG) emissions. But in a new paper, I find that in fact, reducing GHG emissions is not usually the primary goal of World Bank mitigation projects. I review the performance metrics used by the World Bank and associated trust funds, and find that in general, their mitigation projects aim to increase electricity generation; reduce transport time; increase energy access; and advance other objectives typically regarded as developmental in nature rather than climate-related.
There are legitimate concerns still to address: such as whether the most cost-effective technologies are being foregone in LICs because of concerns about their climate impact. And—since the GHG reductions resulting from a large proportion of mitigation projects aren’t tracked—there are questions about what it even means to count finance as mitigation.
But the goals of the World Bank mitigation projects we examine suggest that in practice, less mitigation finance may just mean less infrastructure.
Mitigation projects: Not primarily about mitigation
The World Bank assigns each project a “mitigation coefficient,” representing the proportion of its commitments to it that count as mitigation finance (commitments to projects with a 100 percent coefficient are treated in full as mitigation finance). In addition, it reports performance metrics for all its projects on its website, along with projects funded by trust funds and financial intermediary funds (TFs and FIFs) that it administers. This blog focuses on the performance metrics used for mitigation projects.
To get a rough sense of the focus of projects within different income groups, I first summarise the language contained with these performance metrics in the word clouds below. Projects in upper-middle-income countries centre on emissions reductions, whereas those in lower- and lower-middle-income countries emphasise “people” and “access".
Figure 1. Common words in World Bank (and World Bank TFs and FIFs) performance indicators for projects with mitigation component
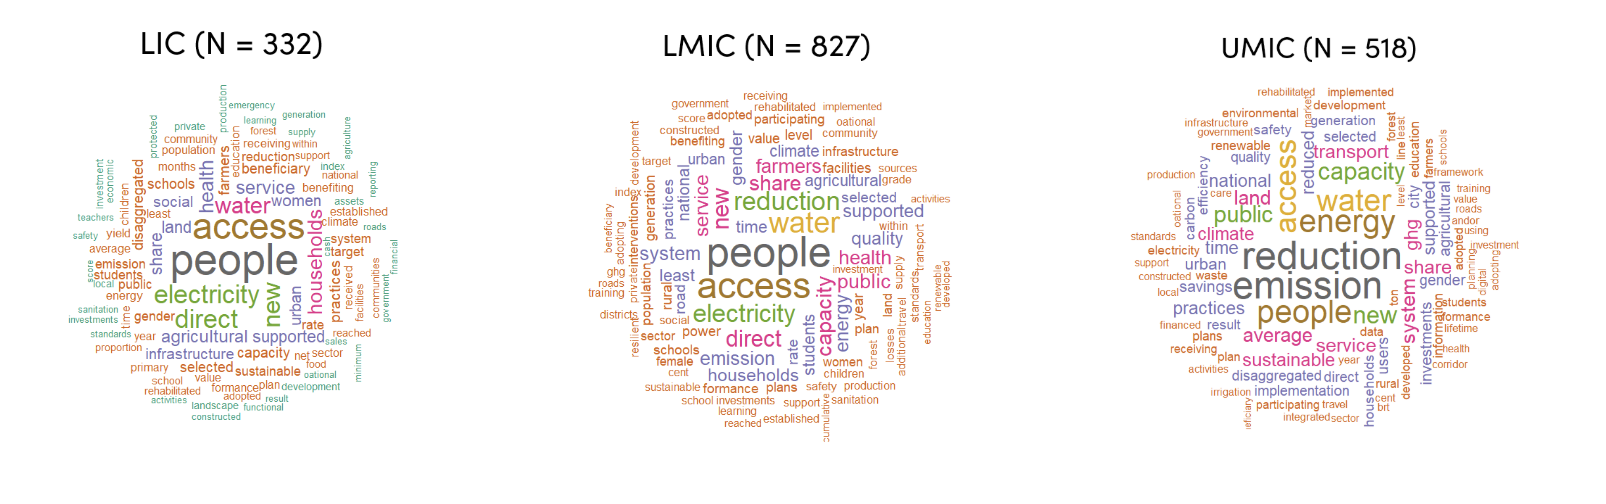
Note: N is number of projects, not number of indicators, and refers to number of World Bank projects (or those funded from World Bank administered trust funds or financial intermediary funds) that have a mitigation component and available indicator information.
Source: World Bank project API
Examining commitments to mitigation projects tells the same story. Figure 2 shows the percentage of commitments to projects that have a mitigation component (however small) that also have an indicator tracking GHG emissions reductions. Because of the number of ways that such indicators could be framed, we identified them first by hand-coding a selection, then training a language model to classify other indicators relating to GHG emissions (full details in my related paper).
The overall percentage of projects with such indicators is low: most World Bank mitigation finance commitments are for projects that do not track impact on GHG emissions as a key performance metric. There is also a huge difference between income groups: only 4 percent of commitments to LICs with a mitigation component track GHG emissions as a KPI, compared to 34 percent for UMICs. The share of commitments from TFs and FIFs (many of which have specific climate objectives, unlike the World Bank’s broader development mandate) is considerably higher (58 percent) and far more similar across income groups.
Figure 2. Percent of World Bank projects with mitigation components that track GHG reductions as a performance metric
Notes: This is an estimate based on a natural language processing method outlined in the full paper.
Source: World Bank project API
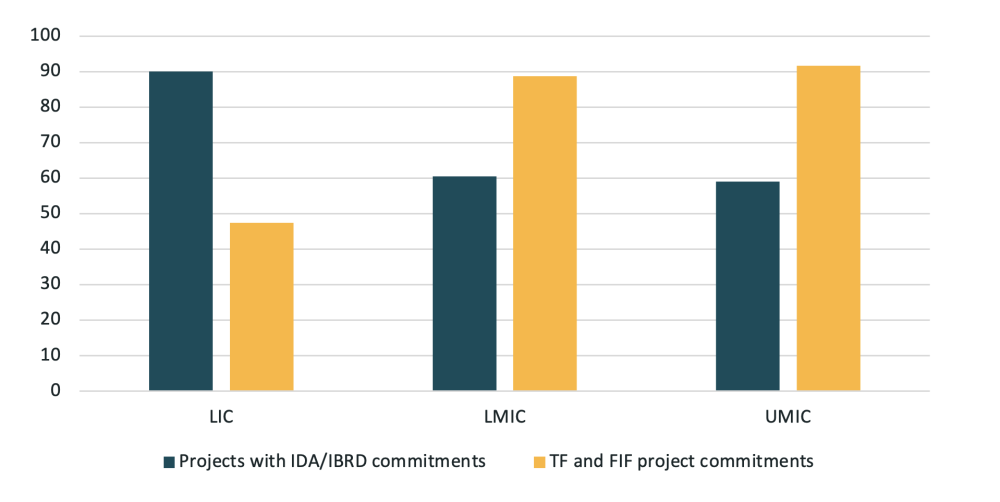
For projects that are 100 percent focused on mitigation, the shares are higher, but still well below what might be expected: on average, 61 percent of IDA/IBRD commitments have a GHG indicator. While for LICs, the figure is 90 percent, this was all from one large energy project (and the economic appraisal suggests than the impact on GHGs was not that important for the approval of the project: the rate of return was multiples higher than the threshold for approval, even ignoring the price of carbon). For TFs and FIFs, the figure was 88 percent.
Figure 3. Percent of World Bank projects with 100% mitigation coefficient that track GHG reductions as a performance metric
Notes: This is an estimate based on a natural language processing method outlined in the full paper.
Source: World Bank project API
The fact that tracking GHG emissions reductions is more common in projects in MICs, and in projects funded by TFs and FIFs, is not surprising. LICs are still responsible for a negligible share of global emissions, and expected reductions in GHG emissions usually come from replacement of traditional fuel sources (such as kerosene lamps) rather than industrial scale fossil fuel burning as in MICs. And whereas the World Bank has a developmental mandate, many of the TFs and FIFs are specifically intended to address climate goals (such as the “Prototype Carbon Fund” or “Clean Technology Fund”).
What do World Bank mitigation projects aim to achieve?
The answer to this question is varied: there are nearly 9,000 unique performance indicators across all World Bank mitigation projects, and even 100 percent mitigation projects have 703, despite a common perception that such projects are just about reducing GHG emissions. We use a clustering algorithm to group semantically similar indicators together (followed by some manual tidying). This method is imperfect and some groups did not have interpretable meaning (lumped together as “miscellaneous” in the table below). However, other groups contained indicators that were clearly related, i.e. different ways of stating the same objectives (such as “increased generation capacity”). These are summarized in table 1.
Table 1. Total commitments (USD billion) for World Bank 100%-mitigation projects in L/MICs that have indicators tracking different groups of objectives
Total | (% with GHG indicators) | LIC | LMIC | UMIC | |
|---|---|---|---|---|---|
| Total commitments (USD bn) | 20.5 | 63% | 0.7 | 9.5 | 9.7 |
| Commitments with indicators on: | |||||
| Increasing generation capacity | 9.0 | 73% | 0.6 | 5.7 | 2.4 |
| Transport improvements (other than reducing travel time) | 4.6 | 34% | 0.0 | 2.1 | 2.5 |
| Expanding electricity access | 4.1 | 66% | 0.7 | 2.3 | 1.0 |
| Mobilizing finance | 3.7 | 75% | 0.0 | 1.9 | 1.9 |
| Improving energy efficiency | 3.4 | 58% | 0.0 | 1.7 | 1.6 |
| Reducing travel time | 2.7 | 26% | 0.0 | 0.4 | 2.3 |
| Miscellaneous | 2.2 | 84% | 0.0 | 0.2 | 1.8 |
| Forest area restored or under sustainable management | 0.2 | 93% | 0.0 | 0.1 | 0.2 |
Notes: Figures are not summable down columns because projects can have multiple indicators across different categories. Also, rows don’t sum to the total because of a small value of regional commitments. The percent of commitments within each group is not presented given the small number of observations in each category. Total commitments are for projects that have a 100% mitigation component and contain indicator information.
This table demonstrates that in LICs and LMICs, 100 percent-mitigation projects are largely about energy: three quarters of IDA/IBRD commitments are about increasing generation capacity, expanding access to electricity, or improving energy efficiency. As one of the key drivers of development (there are no rich countries that are energy poor), this may reassure sceptics of mitigation finance for LICs that it is not inherently anti-developmental. The remaining quarter mostly comprises commitments for transport infrastructure, with goals such as reducing travel time between hubs, also important for development.
Some commentators have stated that “for mitigation, regardless of the sector or geography, the indicator is the tonnes of CO2 emissions reduced”. That would be true if mitigation finance all targeted the marginal cost of greening investments: the additional finance needed to achieve the same goals in a way that emits fewer GHGs (for example, the marginal cost of providing electricity from renewables rather than fossil fuels in places where renewables are still more expensive). But that does not appear to be the case with World Bank mitigation finance, which instead includes the full value of delivering energy and transport services, both of which are essential for development.
Good development, bad mitigation?
There are still valid concerns about the impact that mitigation goals could have on development outcomes in low-income countries. For example, whether World Bank projects are providing energy access in the fastest, most cost-effective way, or whether the pressure to rule out certain technologies like natural gas (widely used in rich countries) means that this provision is costing more than it should. Or whether “virtue signaling” on mitigation is absorbing too much scarce capacity of officials. And there is still the risk that increasing focus on mitigation pulls resources away from poorer countries towards those that emit more GHGs.
But the total value of mitigation finance provided by the World Bank is a poor guide both to the financial effort put into reducing emissions, and the extent to which the Bank is shifting away from development priorities. World Bank staff have said explicitly that even projects with a 100 percent mitigation coefficient are “not climate projects; they are development projects… … delivering climate mitigation co-benefits”. Instead of worrying about labels, we should focus on what projects are trying to achieve, and how successful they are in doing it.
Topics
DISCLAIMER & PERMISSIONS
CGD's publications reflect the views of the authors, drawing on prior research and experience in their areas of expertise. CGD is a nonpartisan, independent organization and does not take institutional positions. You may use and disseminate CGD's publications under these conditions.