

Recommended
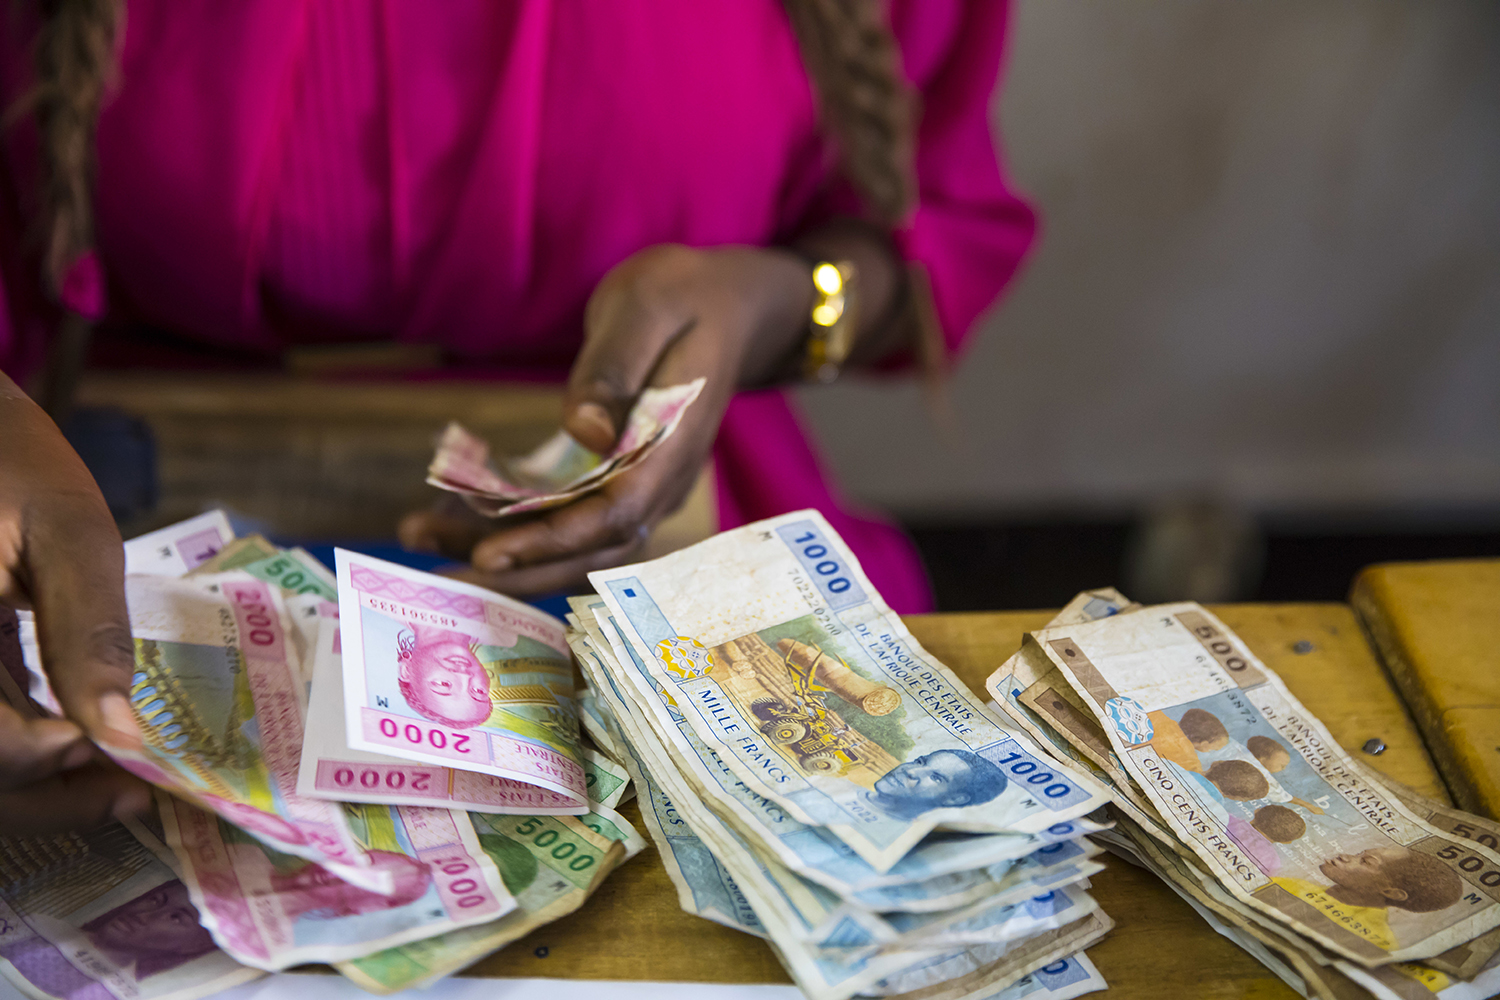

In 2024, low- and middle-income countries received an estimated US$695 billion in remittances. That is more than gross official development assistance (ODA, about US$96 billion) and net foreign direct investment (FDI, about US$420 billion) combined.
For 59 countries, remittances were worth more than 5 percent of gross national income (GNI). As aid budgets shrink and investment flows remainvolatile, remittances are becoming an ever larger share of the external finance reaching poorer countries.
The current and potential contribution of remittances to development is increasingly celebrated. However, beyond the overall figures, we know much less about how much money flows between individual countries. This matters for a range of policy questions, and two in particular: first, many remittance-receiving nations depend on a small number of remittance-sending countries (sometimes even just one), meaning any disruption could have large consequences. Second, bilateral data can tell us how underrepresented low-income countries are in remittance networks, and why: their citizens often face barriers in emigration to high-income countries, so lack the opportunity to send money.
Until recently data gaps were at least partially filled by the World Bank’s Global Knowledge Partnership on Migration and Development (KNOMAD), which produced a modelled matrix of bilateral flows (the most recent to 2021). KNOMAD has closed due to funding cuts but in a new CGD note, we replicate its methodology to produce an updated bilateral remittances matrix for 2024, and look at what has changed.
Patching the data gap
To estimate bilateral flows, we follow the method previously used by KNOMAD (developed by Ratha and Shaw in 2007). We allocate each country’s total remittance receipts across possible source countries, weighting each corridor by the number of migrants living in the country of destination and by the countries’ income per capita.
The matrix is modelled, and faces two major data limitations. Firstly, migrant stock records are poor. UN DESA’s data records no Kenyans in the Gulf (a key remittance-sending region), for example, versus public estimates of around 300,000. Secondly, even remittance volume data is suboptimal. The World Bank, following IMF balance of payments data, estimates US$898 billion received in 2024, but only US$622 billion paid. The matrix is thus indicative—but much better than nothing.
Changes in flows and geographies from 2021 – 2024
From 2021 to 2024 global remittance receipts rose by US$160 billion, or 22 percent, and increased for nearly three-quarters of countries. Twenty-eight countries recorded growth in flows above 50 percent; twelve saw remittance inflows more than double. Ethiopia’s rose by a startling 1,500 percent (US$6.7 billion) after a deliberate push to move remittances into formal channels, an approach Nigeria is also following. India’s receipts grew by nearly US$50 billion.
The geography of remittance flows changed little. The United States is by far the largest source, accounting for 26.1 percent of modelled outflows, followed by Saudi Arabia (6.3 percent) and the United Arab Emirates (5.5 percent). (The US–Mexico corridor alone, worth US$65 billion, makes up 7.3 percent of all flows worldwide.) Between regions, the largest flows run from North America to Latin America and the Caribbean (US$129 billion) and from the Middle East and North Africa to South Asia (US$112 billion). Roughly 37 percent of modelled remittance flows are intra-regional (Figure 1).
Many remittance-receiving countries are dependent on one or two sources
More than a quarter of the 51 remittance-receiving countries receive more than half of their remittances from a single country. Twenty-one receive more than three quarters of their remittances from one country. The median remittance recipient receives 38 percent of its remittances from its largest source. Some countries are extraordinarily dependent on one source (Figure 2): Mexico receives nearly 97 percent of its remittances from the United States; the Marshall Islands and El Salvador (on the US), Papua New Guinea (on Australia), and Tajikistan (on Russia) are similarly dependent.
This level of concentration remained very stable from 2021 to 2024, and during the period just 9 of 181 remittance recipients saw their top modelled source change. This suggests two things. Firstly, remittance corridors are structural: they follow migration patterns which are likely to change relatively slowly. Secondly, some remittance source countries can have significant leverage over recipients (as the United States demonstrated when it introduced a remittances excise tax), and policy tweaks on immigration, labour markets, or transaction management may have major externalities elsewhere.
Macroeconomic exposure to negative remittance shocks
Remittance-receiving countries’ dependence on a small number of remittance-sending countries is riskiest when inflows are large relative to the recipient’s economy. In 2024, 16 bilateral corridors were worth more than 10 percent of the recipient’s gross national income (GNI), and 27 were worth more than 5 percent (Figure 3). These are not necessarily the biggest corridors in absolute terms: the US–Mexico corridor equals just 3.6 percent of Mexico’s GNI, while France–Comoros, at US$265 million, is worth 18.3 percent of Comoros’ GNI.
The corridors that matter most relative to GNI fall (very broadly) into clusters: from the United States to Latin America and the Caribbean; from the Russian Federation to former Soviet states; from Australia, New Zealand and the United States to Pacific island states; and from larger to smaller economies in Southern Africa. The Gulf is a troubling exception. No single Gulf corridor exceeds 5 percent of recipient GNI, but that is largely because migrant stock data for the region is poor. Collectively, the Gulf is an important source: Gulf sources together send remittances equal to more than 5 percent of GNI to each of Nepal, Pakistan, Jordan and Egypt, and more than 1 percent to 9 countries. A serious disruption in the Gulf, as the Iran war has threatened, would hit remittance-receiving economies from Nepal to Egypt.
Low-income countries are largely left out of remittance networks
Low-income countries receive relatively fewer remittances. For low-income countries remittances are only modestly larger than ODA, at US$24.5 billion and US$19.7 billion respectively. Across all 70 low- and lower-middle-income countries receiving both remittances and ODA, by contrast, remittances exceeded assistance for 48 in 2024: as income levels increase, countries receive relatively less ODA and can send more migrants. With aid now falling, that number has likely risen.
Citizens of low-income countries face barriers against emigration to high-income countries, and so have less opportunity to send large remittances. Modelled flows from high-income to low-income countries are the smallest of any flows sent from high-income countries: just US$14.7 billion in 2024, under 2 percent of the global total, even though high-income countries send 85.6 percent of all remittances.
In 2024 fewer than 9 million people from low-income countries lived in high-income countries, against around 65 million from lower-middle-income and 70 million from upper-middle-income countries. Emigrants from the median low-income country also live in poorer places: their destinations have an average GNI per capita of about US$24,900, against US$48,800 for lower-middle-income and US$64,200 for upper-middle-income countries. The good news is that high- to low-income flows rose by almost two-thirds between 2021 and 2024, albeit from a low base—and they are the flows most directly shaped by destination-country policy.
Takeaways for policy and data
Remittances are of enormous (and growing) importance, and are of increasing interest to policymakers.
There are three key policy implications which follow from the new matrix:
- Remittances are macroeconomically important, especially in countries receiving inflows equivalent to a high proportion of GNI from a single remittance-sending country. High dependency creates high exposure. Just as commodity exporters must navigate exposure to single global market prices, countries relying on remittances from one source must track, and try to hedge against, shocks from source country policy or economic downturns.
- Remittance-receiving countries may want to try to diversify their migrants’ destinations, through bilateral labour agreements, skill partnerships, or regulation of recruitment. This is a form of hedging or insurance against shocks, although it will take a long time to bear fruit and may involve shorter-term trade-offs.
- Countries of migrant destination should recognise that their migration and transaction policies can have major effects elsewhere. Development-minded governments can recruit proactively from low-income countries, for example through targeted schemes in agriculture and other shortage occupations, raising remittance incomes where they can have development impact.
Finally, this exercise also demonstrates the need for better data. With KNOMAD gone, there is a dearth of bilateral remittance data. The World Bank remains responsible for the SDG indicator on remittance costs, and IFAD’s RemitSCOPE initiative works with central banks. But the IMF may be best placed to take up the gauntlet: remittances are a balance-of-payments item within its macroeconomic remit, and the IMF already has the data relationships and the surveillance mandate to use them. Bilateral remittance data is a relatively low-cost public good that no single country can easily produce alone. Given the sums involved, even marginally better policy would repay it many times over.
As remittances rise in importance, they must be taken more seriously.
DISCLAIMER & PERMISSIONS
CGD's publications reflect the views of the authors, drawing on prior research and experience in their areas of expertise. CGD is a nonpartisan, independent organization and does not take institutional positions. You may use and disseminate CGD's publications under these conditions.
Thumbnail image by: USDA/Bob Nichols