Recommended
Blog Post
How Many Lives Does US Foreign Aid Save?
Blog Post
Breaking Down Prime Minister Starmer’s Aid Cut
2025 will likely go down in history as the year donors set fire to their international development commitments. Countries across the OECD’s Development Assistance Committee (DAC)—those who traditionally provide Official Development Assistance (ODA)—have slashed their aid budgets and signalled their priorities lie elsewhere. Cuts have already started, and will steepen into 2026.
In this blog, we use projections of bilateral ODA flows—aid provided directly to countries rather than through multilateral organisations like the World Bank—to visualise how donors are shifting their approach and which low- and lower-middle-income countries (LMICs) will be most affected.
These cuts will have major negative impacts. In their preparation and wake, a more coordinated approach to foreign assistance must be developed. Greater collaboration, and a greater focus on comparative advantage among donors, will be crucial if key areas of need are not to be abandoned.
How much are donors cutting?
The current wave of aid reductions accelerated in January, when the Trump administration announced a near-total suspension of disbursement by the United States Agency for International Development (USAID). There is currently very little certainty as to how much US aid has been or will be permanently cut.
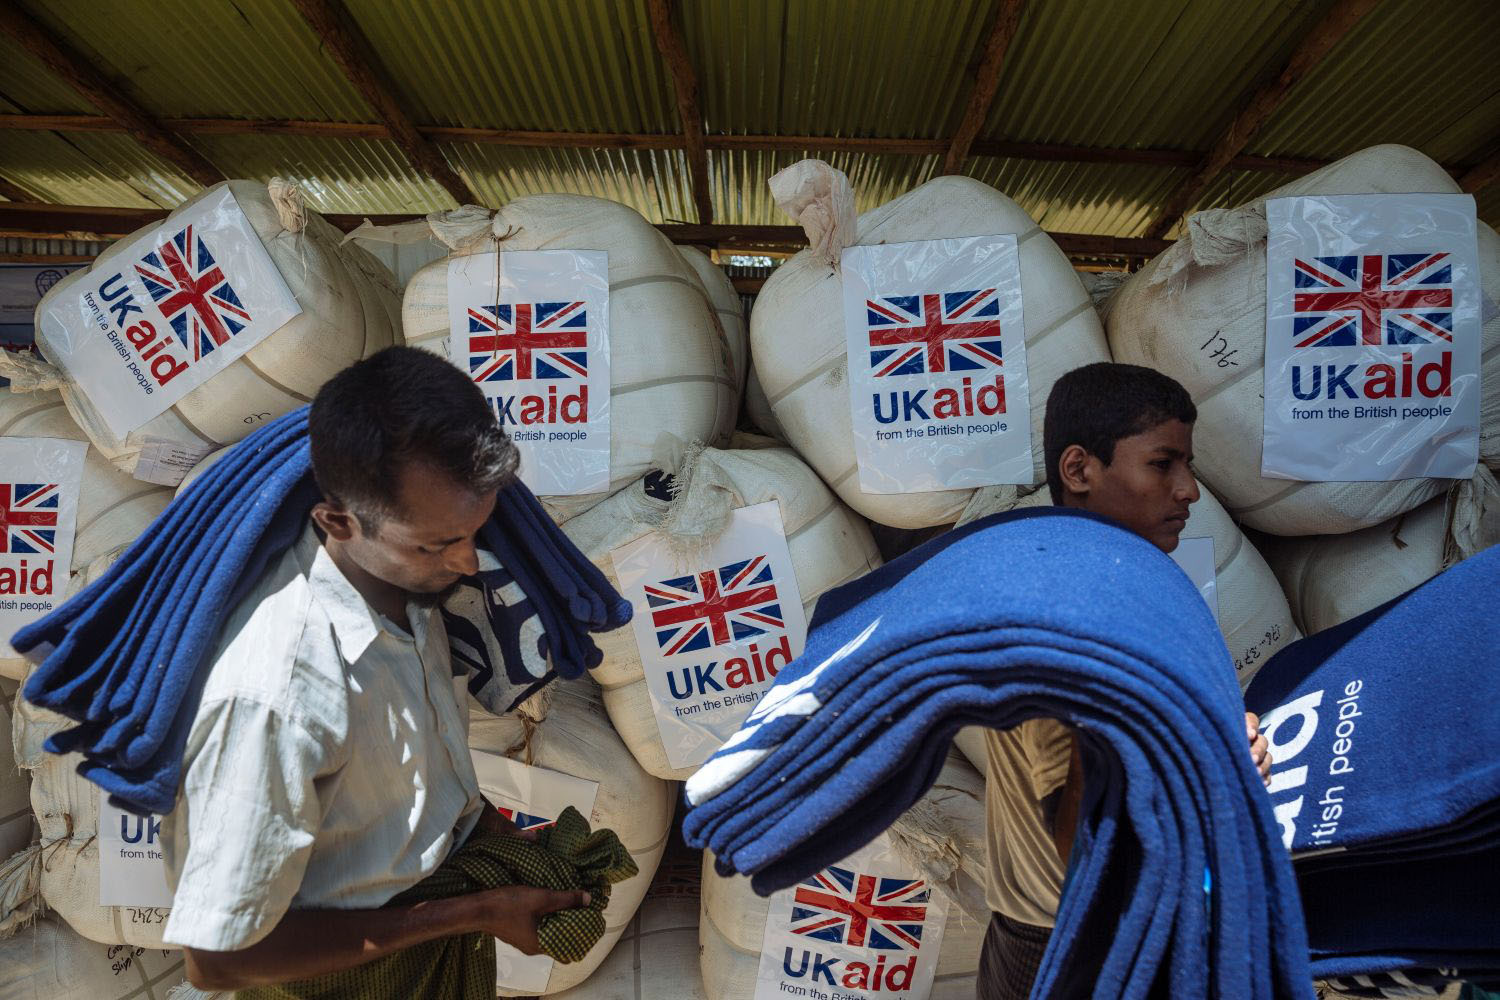
Other countries have followed suit. The United Kingdom announced a reduction in aid spending from 0.5 percent of GNI to 0.3 percent to offset increased defence expenditure, and the tide of ODA cuts has continued in France, Germany, Switzerland, and elsewhere.
For this blog, we use projections of aggregate aid cuts from the Donor Tracker initiative - derived from government statements and economic forecasts. Figure 1 shows estimates of ODA from 2023 – 2026, also comparing each donor’s 2026 ODA levels to those of 2023.
Figure 1
Not all countries are cutting: some, such as Korea and Italy, are expected to increase their ODA budgets. The US, unsurprisingly, is expected to cut the most: its 2026 ODA is projected to fall by 56 percent from 2023 levels. (Though as Donor Tracker note, it might fall by far more—or by less.). It is also worth noting that US and other donors’ ODA in 2023 was particularly high due to large contributions to Ukraine; and that in-donor refugee costs siphon increasingly large amounts away from low- and middle-income countries.
Counting losses: Which countries are projected to be hit hardest?
At this point, we have a reasonable idea of aggregate cuts for 2025-2026, but we do not know precisely where the cuts will fall. Here we distribute projected cuts across recipient countries in proportion to 2023 spending (the most recent year for which we have data). We do this by assuming that when a donor cuts its total aid, its bilateral aid is cut at the same rate as the total pot and then distributed in the same proportions as in 2023. We are doing some crystal ball-gazing here. Diplomatic interests, growth rates, and crises will inevitably mean that spending in 2026 is not identically proportionate to spending in 2023. But for now, this approach offers the best available estimate.
This analysis only assesses bilateral ODA flows and does not include the effects of cuts to multilateral funding. Where Donor Tracker does not provide estimates of ODA budgets, we use donors’ 2023 commitments and assume they remain stable (and so probably overstate some budgets). In Figure 2, we show aid received by LMICs in 2023 and 2026 in nominal terms at the national and per capita level.
Figure 2
Syria was the highest recipient of bilateral ODA among low- and lower-middle-income countries in 2023, receiving US$8.7 billion. It is projected to receive US$7.9 billion in 2026. This equates to US$337 per capita—very high, but far less than several small island countries. The Democratic Republic of the Congo received nearly US$2 billion in 2023 and is projected to receive US$1.2 billion in 2026. South Sudan’s ODA per capita was US$110 in 2023 and is projected to be slashed to US$68.
For many countries, the reductions are startling. In Figure 3, we map projected losses of bilateral ODA in absolute terms and as a percentage versus 2023 levels.
Figure 3
In nominal terms, Ethiopia is projected to lose the most in 2026—nearly US$1.1 billion versus 2023, followed by Jordan (US$896 million), Afghanistan (US$859 million), and the Democratic Republic of Congo (US$814 million). In percentage terms, the country losing the greatest share of ODA is projected to be Lesotho, losing 52 percent, followed by Micronesia (51.2 percent) and Eswatini (46 percent). (Micronesia may be a special case: it receives most of its US ODA through the Department of the Interior as a member of a Compact of Free Association. This ODA should in theory be unaffected by USAID cuts, but it is unclear whether the US intends to honour Compact commitments.)
One striking takeaway is that some countries are projected to lose large amounts of ODA simply because of who their main donors are—while others are projected to lose very little. These losses are independent of the needs of the country. Yemen, for example, is projected to lose ‘only’ 19 percent of its ODA between 2023 and 2026, while across the Gulf of Aden, its neighbour Somalia is projected to lose nearly 39 percent. So donors may need to reprioritise to fill gaps and respond to newly unmet needs in the most affected countries.
For many countries, these nominal reductions translate into significant losses as a proportion of the country’s total economy (Gross National Income, or GNI). Figure 4 shows the GNI equivalent lost due to the cuts across LMICs.
Figure 4
Nineteen countries are projected to lose the equivalent of more than 1 percent of their 2023 GNI to ODA cuts in 2026. Micronesia is projected to lose the equivalent of 11.2 percent of 2023 GNI in 2026 ODA losses, followed by Somalia at 6.1 percent, Afghanistan at 5 percent, and the Central African Republic at 3.7 percent. These are severe decreases that will have major effects, including on growth rates.
For most recipient countries, the lion’s share of their cuts are from the US, but there is some variation (Figure 5). Somalia, for example, is projected to lose the equivalent of 6.1 percent of 2023 GNI, of which 5.05 percent is attributable to the US; 0.43 percent to the UK; 0.34 percent to Germany; and 0.39 percent to others. For Lesotho, the US accounts for nearly all lost ODA.
Figure 5
We include the above chart to show the size of individual donors’ bilateral ODA cuts relative to recipient countries’ wider economies. It does not suggest that GNI will fall: GNI does not include ODA flows, and removing ODA will only affect GNI indirectly through complex impacts on growth.
To understand how ODA cuts will actually affect economic outcomes in recipient countries, we project changes in Gross National Disposable Income. This is a figure that includes GNI but adds net secondary income flows— unrequited transfers such as ODA and remittances.
Using GNDI allows us to see how much worse off aid recipients will be as a result of cuts. We compare projected GNDI after cuts to GNDI with 2023 ODA levels maintained in Figure 6. The decrease in total disposable income is stark in many LMICs: in some countries—such as Somalia and the Central African Republic— we project a sharp relative fall. Seventeen low- and lower-income countries are projected to suffer a relative decrease in GNDI of more than 1 percent; nine lose more than 2 percent; five lose more than 3 percent. Growth trajectories will mean that over the period the relative effect of successive ODA losses will shrink (if GDP growth is positive) or increase (if negative).
Figure 6
Moving forward: The coordination challenge
In several low- and lower-middle-income countries, the aid cuts will likely change who the largest bilateral donor is (see Figure 7). For example, Portugal is projected to overtake the US in Angola; Japan to replace France in Egypt; and Germany to overtake the US in Ghana. This matters because when the largest donor to a country changes—especially during a period of overall cuts—it can lead to major shifts in what gets funded and how. Different donors have different priorities, ways of working, and relationships on the ground. A new lead donor may not continue the same programs, may take time to get established, may struggle to reallocate resources to fill a gap, or may lack the resources to fill gaps at all. Shifts in relative responsibility risk creating disruptions.
Figure 7
As overall aid budgets fall and the lead donor changes in many countries, donors will need to prioritise carefully and coordinate with one another. Discussions on how to do more with less are only just starting. They must be accompanied by questions on where to use resources—both geographically and thematically— to avoid spreading funds too thinly and leaving gaps in which vulnerable populations go without support.
Where a bilateral donor is cutting heavily and other donors are retaining significant support for a country, it may need to exit support entirely or provide less predictable support through a regional model. Conversely, where a large donor (like the US) is scaling down support for a low-income country that has historically been dependent on their ODA, others may need to step in— even if they have limited experience there. (In these cases the identification of high-impact but cut interventions could be valuable in smoothing the transition.)
Conclusion
Fundamentally, the shifting landscape will require careful reprioritisation. Donor countries should carefully assess their comparative thematic and geographical advantage. They should also communicate their intentions openly with other donors, to allow an assessment of where the application of that advantage would have the greatest impact. In a landscape of scarce resources, donors must avoid both duplicating each other’s efforts and creating “orphan” countries or sectors by simultaneous exits.
The 4th International Conference on Financing for Development (FfD4) conference, taking place in Seville later this month, will provide a valuable chance to increase coordination.
We will endeavour to update this analysis as better projections become available. Thank you to Erin Collinson and Mikaela Gavas for helpful feedback.
Topics
DISCLAIMER & PERMISSIONS
CGD's publications reflect the views of the authors, drawing on prior research and experience in their areas of expertise. CGD is a nonpartisan, independent organization and does not take institutional positions. You may use and disseminate CGD's publications under these conditions.
Thumbnail image by: WFP/Ahmed Basha