
Recommended


1. Introduction
Every year, the public employment services of the EURES (European Employment Services) countries report to the European Labour Authority the occupations they consider in shortage and in surplus (European Labour Authority, 2026). I use that data and match the roughly 400 occupations in the 2025 report to the green classification (defined in Section 2). Green occupations are substantially over-represented on the shortage side. The average green occupation is reported in shortage by 6.6 countries, against 5.4 for all other occupations, and it is less likely to appear on surplus lists (4.1 versus 4.8 countries). Nearly a third of green occupations are in widespread shortage, reported by ten or more countries, roughly double the rate of everything else. Figure 1 plots this analysis. As shown, building electricians are reported in shortage by 21 of the 28 countries, more than any other occupation in Europe, and plumbers and pipe fitters by 20 countries. Other green occupations high on the list include sheet-metal workers, bus and tram drivers, electrical engineers, carpenters and joiners, air-conditioning and refrigeration mechanics, roofers, and insulation workers. More generally, 13 of the 31 occupations reported in shortage by 14 or more countries are green.
Figure 1. The 20 occupations most frequently reported in shortage by EURES countries' public employment services, 2025
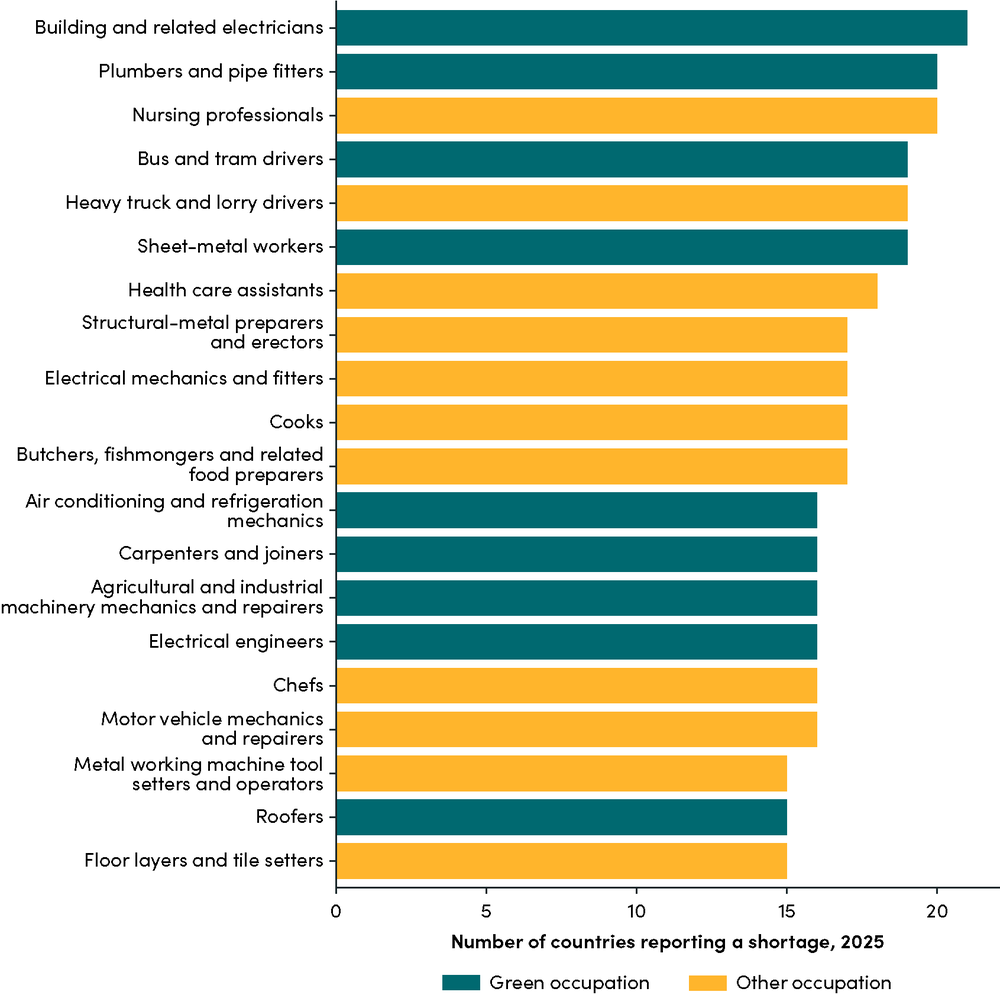
Note: Teal bars are occupations in the green classification. Source: European Labour Authority (2026); author's matching to ISCO-08 and the O*NET green occupation list.
However, using the word “shortage” in labor markets requires an explanation. In a functioning market where wages adjust through market clearing there is no such thing as a permanent shortage. When a type of worker is scarce, then you should see wages that are rising. In other words, if employers cannot find electricians at 25 euros an hour, they should offer 30, and at some price the market will clear. This is an old critique, going back to Kenneth Arrow and George Stigler in the 1950s (Blank and Stigler, 1957; Arrow and Capron, 1959), and it remains the instinctive reaction of most labor economists when an industry association warns of millions of unfilled jobs. The fact that employers would prefer not to raise wages does not make a shortage but rather a reluctance to pay more when demand outpaces supply.
But the theory somewhat simplifies a number of important nuances. For instance, training an electrician requires time, often years. Further, wages in many European countries are set through collective bargaining and adjust slowly, so they do not necessarily follow the market dynamics that a theoretical model would predict. And while the EU has a common market, the supply of electricians in Spain, for instance, does not automatically fulfill demand in Bavaria (though it should do that more often than if there was not a common market). When a large cohort of experienced workers retires over a short period, no wage increase can conjure up their thirty years of accumulated skill overnight. Nor is raising wages free of trade-offs: with Europe's working-age population shrinking, a premium for green work largely moves workers from one sector to another, for instance from residential construction to solar farms, so meeting climate targets could come at the expense of other goals, such as affordable housing.
In a companion paper on the United States (Bahar, 2026), I’ve argued that the useful question is not "is there a shortage?" but rather "what patterns in the data are consistent with labor market strain?" That means looking at several indicators at once, such as employment quantities, relative wages, and the age composition of different occupations. When they all point in the same direction, the case for labor market pressures becomes hard to dismiss.
In this paper I bring that framework to Europe and find that the overall picture in the old continent is rougher than in the United States, and somewhat more worrisome. In what follows, I present the analysis and key results.
2. Data and definitions
Employment comes from Eurostat's annual Labour Force Survey aggregated by detailed occupation, covering more than 30 countries from 2011 to 2024, for employed persons aged 15 and older, excluding the armed forces. For the demographic analysis, I rely on Eurostat age detail only at the one-digit level for nine broad groups of occupations.
In order to identify “green occupations”—and to allow comparison between Europe and the United States—I use the United States Department of Labor's O*NET Green Economy taxonomy (Dierdorff et al., 2009). I crosswalk the American classification (SOC) to the international ISCO-08 classification using the correspondence built by Hardy, Keister and Lewandowski (2018).[1]
The O*NET list is more detailed than the European occupation classification, so each European occupation group mixes green and non-green occupations. To handle this, I compute for each ISCO group the share of its employment accounted for by green occupations, weighting by American employment from the Bureau of Labor Statistics' 2024 National Employment Matrix. O*NET decides which occupations are green; the BLS data only supply the employment weights. I call this metric the group's green intensity.
In the analysis I define occupations as green-intensive when they are in the top quartile of the green intensity measure. As expected, the green-intensive occupations include science and engineering professionals, building trades, electrical and electronic trades, construction and transport laborers, and two small agricultural groups. The implicit assumption is that the green share of, say, electricians is similar in Europe and the United States (see appendix for more information).
3. Stylized facts
Fact 1: Green employment and wages are growing, but no faster than in the rest of the labor market
Is Europe employing more people in green-intensive occupations than it used to? The answer is yes, but barely, and more slowly than everywhere else in its labor market. Between 2011 and 2024, employment in green-intensive occupations in the EU-27 grew 7.2 percent, against 11.1 percent for all other occupations (Figure 2).[2] Part of that gap comes from subsistence farmers (ISCO 63), a small group counted as green-intensive whose recorded employment all but vanishes over the period, from about 660,000 to 13,000. Excluding all agricultural occupations from both sides of the comparison, green-intensive employment grew 10.8 percent against 13.6 percent for everything else, so the gap narrows but does not close.
Figure 2. Employment in green-intensive vs all other occupations, EU-27, 2011–2024 (index, 2011=100)
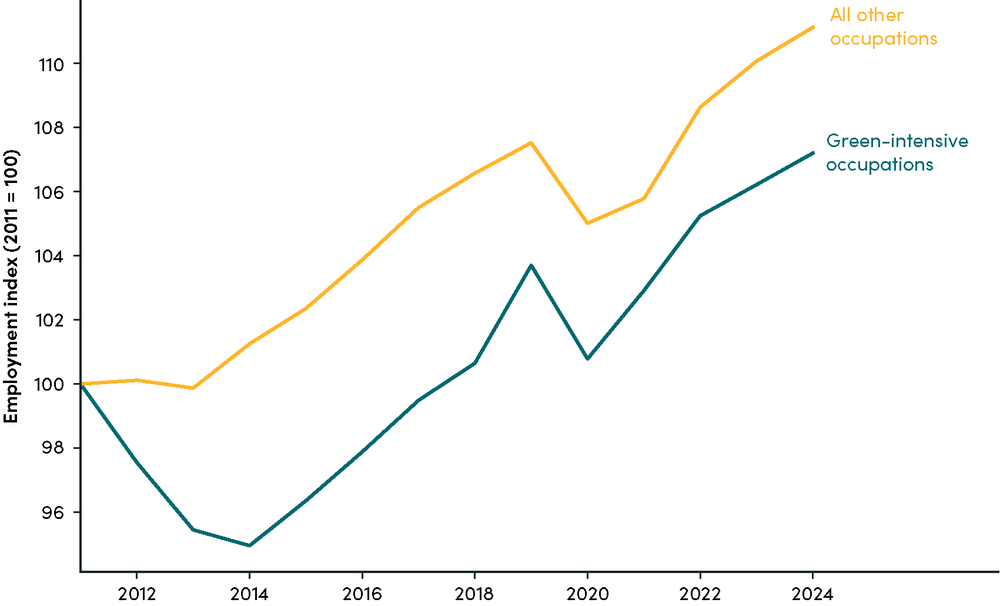
Note: Green-intensive occupations are the top quartile of two-digit occupation groups by green intensity. Source: Eurostat LFS (lfsa_egai2d); armed forces excluded.
To appreciate how striking this is, consider the American comparison laid out in Bahar (2026). In the United States, employment in green occupations grew faster than the rest of the labor market over the same period, which is what you would expect in an economy pouring hundreds of billions of dollars into clean energy through the Inflation Reduction Act that became law during the Biden administration. However, Europe legislated more aggressively than the United States on climate, with binding targets rather than subsidies, and yet its green-intensive workforce is growing more slowly than other occupations in the economy. But quantities alone cannot tell us the full picture. This could be weak demand for these workers, or rather it could be that employers want them and cannot find them.
If green-intensive employment was growing slowly because of lack of demand, then we should see relative wages that are flat or even falling. To explore the evolution of wages, I use earnings data from the Structure of Earnings Survey, which is public only for nine broad occupation groups, so I cannot apply the same two-digit green-intensity weighting behind Figure 2. Instead, I classify as “green-leaning” the four major groups with green intensity of at least 0.20, namely managers, agricultural workers, craft and trades workers, and elementary occupations; these are coarser cuts of the same underlying measure used in Figure 2, and Table A1 in the appendix reports the full distribution and explains the 0.20 cutoff.
Using this measure, Figure 3 shows the wage trends for a sample of 31 European countries observable in both the 2010 and 2022 waves of the survey.[3] The figure indexes each country's mean annual earnings to 2010 and plots the cross-country median, wave by wave, for green-leaning groups and for all other groups. The sample covers firms with ten or more employees, the survey's standard scope.
In the figure, green-leaning earnings pull ahead in the mid-2010s, but by 2022 the two lines end up nearly in the same place. That is to say, for the median country, green-leaning earnings grew 31 percent in nominal terms between 2010 and 2022, against 30 percent for other occupations. Overall, workers in green-leaning occupations earned about 8 percent more than the rest in 2022, a modest premium and slightly smaller than the 10 percent of 2010. Comparing within each country tells the same story: green-leaning pay grew faster than the rest in only 13 of the 31 countries. This does not depend on which groups count as green-leaning: dropping managers or agricultural workers leaves relative earnings growth in the median country within about two percentage points of zero (see appendix).
Figure 3. Mean annual earnings of green-leaning vs all other occupation groups: cross-country median of within-country indexed earnings (2010=100), 31 countries
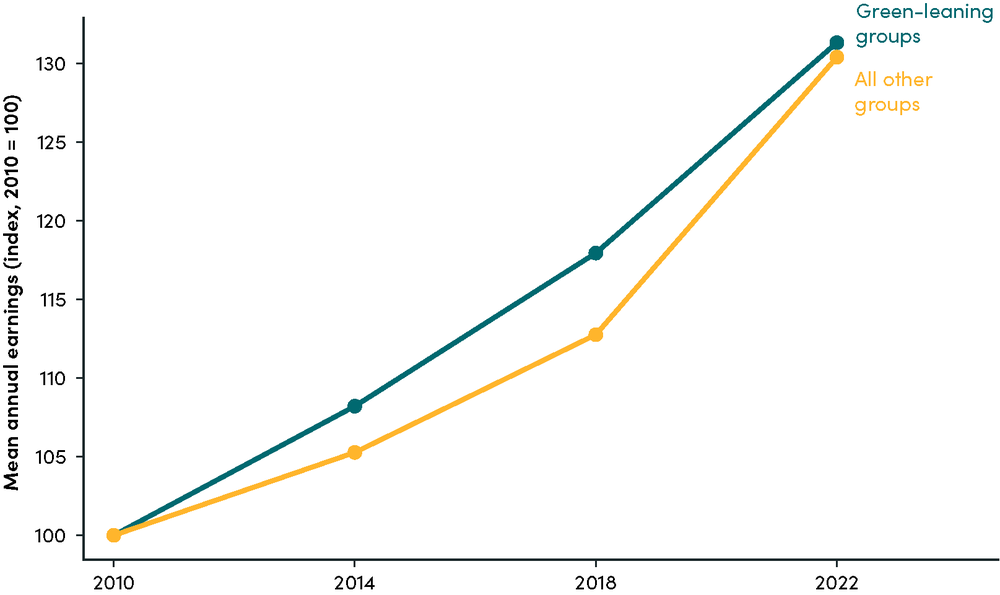
Source: Eurostat Structure of Earnings Survey.
Fact 2: The averages hide enormous variation across countries
So the EU-wide picture is one of quantities lagging while relative wages barely move. But EU-wide medians can hide a lot of variation across countries, so the natural next step is to compare, country by country, the employment growth and the wage growth of green occupations relative to the rest of each labor market.
Only in 13 of the 32 countries with complete data did green-intensive employment outgrow the rest of the labor market between 2011 and 2024 (Figure 4). The dispersion is wide. The cross-country variation matters for policy because it hints that the constraint is not uniform. While some countries appear able to grow their green workforce, others do not. Prices could, in principle, help interpret this dispersion. Figure 5 plots, for the 31 countries with earnings data, each country's relative green employment growth against its relative green earnings growth. The two are essentially unrelated, with a correlation of −0.16: countries where green-intensive employment outpaced the rest did not systematically see green-leaning pay pull ahead. The three largest economies show the range. In Germany, green-intensive employment grew 13 percent less than the rest of the labor market while green-leaning pay grew 8 percent more (2 percent excluding managers), the combination one would expect from a supply constraint. In France, green-intensive employment outgrew the rest by 10 percent, with a 4 percent relative pay gain. Italy shows a large relative pay gain (24 percent) with flat relative employment, but that gain comes from managers; excluding them, relative pay fell by about 4.5 percent.
Figure 4. Employment growth 2011–2024 in green-intensive vs all other occupations, by country
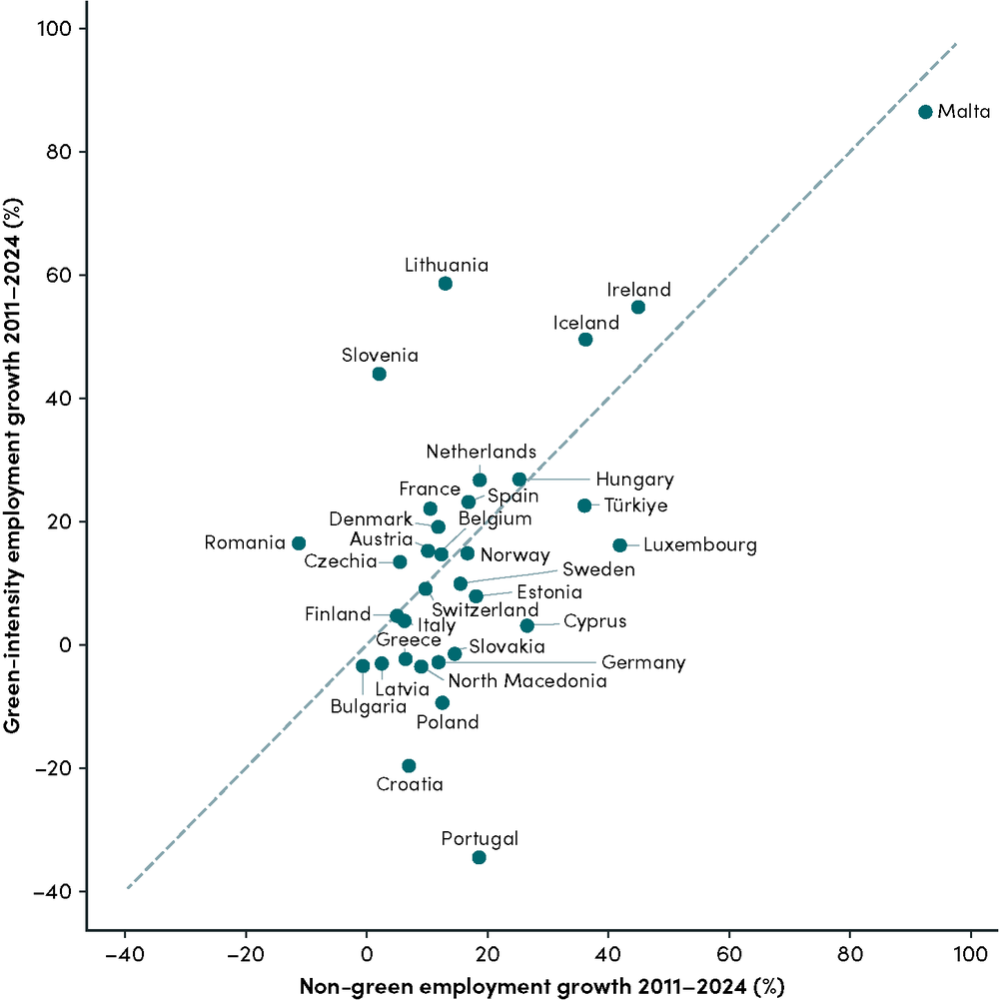
Note: Dashed line indicates equal growth. Source: Eurostat LFS.
Figure 5. Relative employment growth (green-intensive vs rest, 2011–2024) against relative earnings growth (green-leaning vs rest, 2010–2022), by country
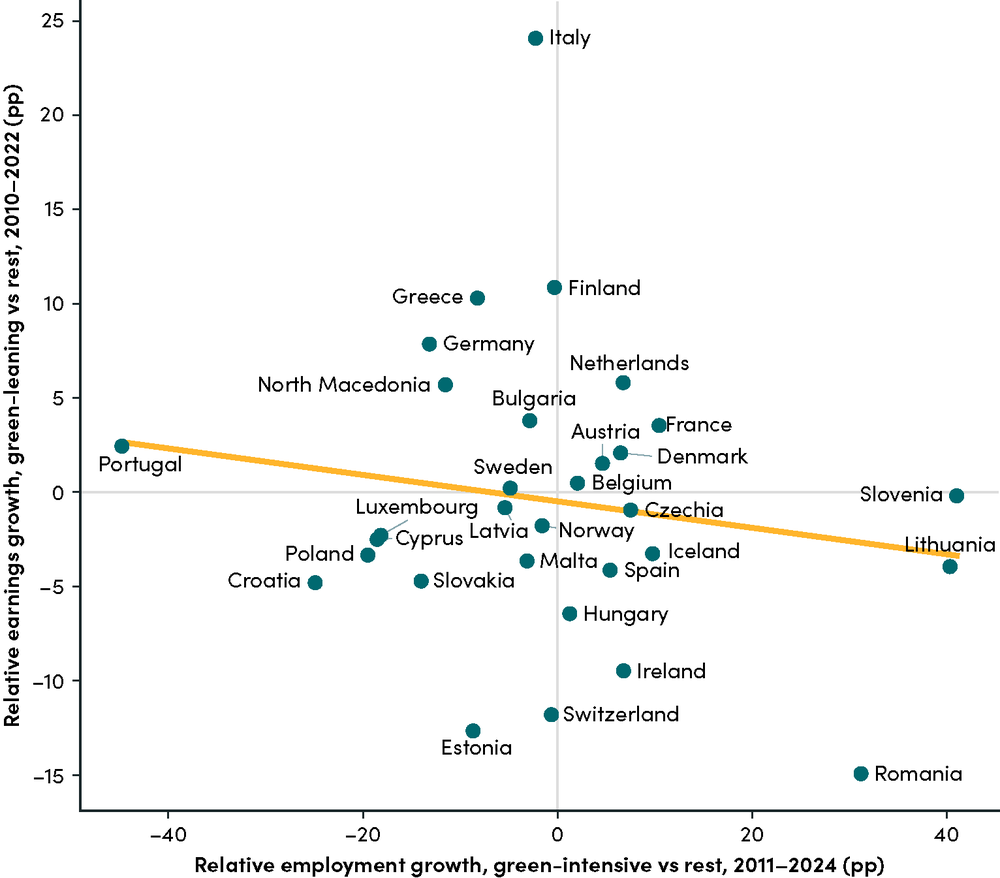
Note: Gold line is the linear fit. Sources: Eurostat Labour Force Survey and Structure of Earnings Survey.
The absence of a clear relationship, however, could well be an artifact of the aggregation of the earnings data, which is an important limitation of the analysis so far. An electrician is just one occupation inside a major group that also contains bakers and tailors, so a genuine price signal in the shortage trades would be diluted precisely where the public employment services keep reporting the shortages.
Fact 3: Online postings show wages rising modestly
To overcome the limitations of the public data, I use the universe of online job postings assembled by Revelio Labs, a workforce data provider that collects postings from company websites and job boards, classifies each posting into detailed occupations and attaches a model-based salary estimate. For the 18 European countries with adequate coverage this yields posting volumes and posted-salary estimates for each of the 58 green occupations, which is a more appropriate level of granularity for the analysis. Two important caveats, however, are that the salaries posted are estimated by a model rather than advertised pay, and that the sample is stable only from 2021 to 2024, so I limit the analysis to that time period (see appendix for more details). A third caveat is that many jobs in the construction trades are filled through word of mouth and personal networks and never posted online, so coverage is weakest for some of the occupations that matter most here.
Using this data, green occupations account for about one in ten European online postings, a share that stayed pretty much flat over the four-year period (at around 10 percent). At the same time, the median posted salary in green occupations went from about 10 percent above non-green postings in 2021 to about 20 percent above in 2024, and the gap widened in 14 of the 18 countries. Part of that, however, is composition, because the mix of green postings shifted toward better-paid roles. When we hold each occupation fixed, the median green occupation's posted salary grew 4.6 percent between 2021 and 2024, against 0.3 percent for non-green postings in the median country. Figure 6 takes one more step and asks whether, across green occupations, these salary gains line up with the growth of posting volumes, as they would if demand expansion were driving them. Across the 44 green occupations with sufficient data, the correlation between postings growth and posted-salary growth is slightly negative. Posted salaries accelerated in occupations where posting volumes grew and where they shrank alike, which is consistent with tight supply in specific occupations rather than with a demand boom. With model-based salaries and 44 occupations, though, this is suggestive rather than conclusive.
Figure 6. Growth of posting volumes against growth of median posted salaries within each green occupation, 2021–2024 (medians across countries with at least 500 postings in both years; occupations with data in at least three countries)
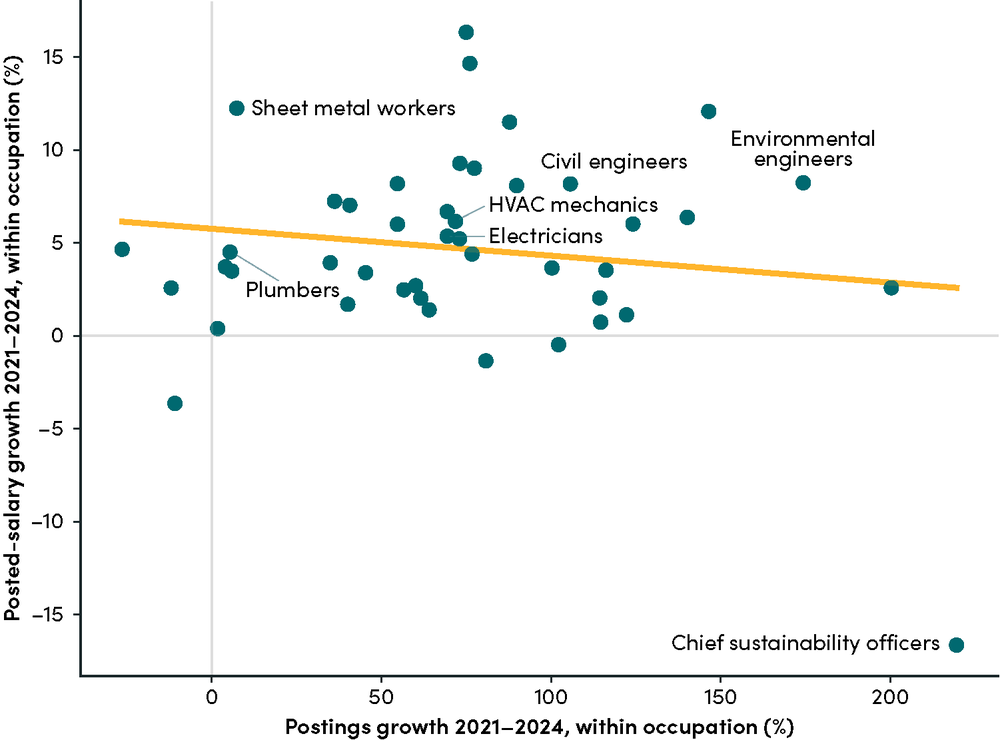
Note: Gold line is the linear fit. Source: Revelio Labs via Wharton Research Data Services (WRDS).
Fact 4: Green-intensive occupations are aging out, everywhere
An important and strong signal of coming pressures in the labor market is not only about today's hiring but rather the retirement pipeline of these occupations. In 2011, 17.7 percent of workers in green-leaning occupation groups in the EU-27 were aged 55 or older. By 2024 that share had reached 25.3 percent, one in four workers, and within a decade of typical retirement ages (see Figure 7). The rest of the labor market is aging too, from 14.3 to 21.5 percent over the same period, but the green-leaning groups have stayed consistently three to four percentage points older. Agricultural workers, the oldest of all occupation groups, account for part of that gap. Excluding them, the gap in levels is smaller, but the remaining green-leaning groups aged faster than everyone else: their share of workers aged 55 and older rose by 9 percentage points (from 15.4 to 24.4 percent), against 7 points for the rest of the labor market.
Figure 7. Share of employed persons aged 55 and older, green-leaning vs all other occupation groups, EU-27, 2011–2024
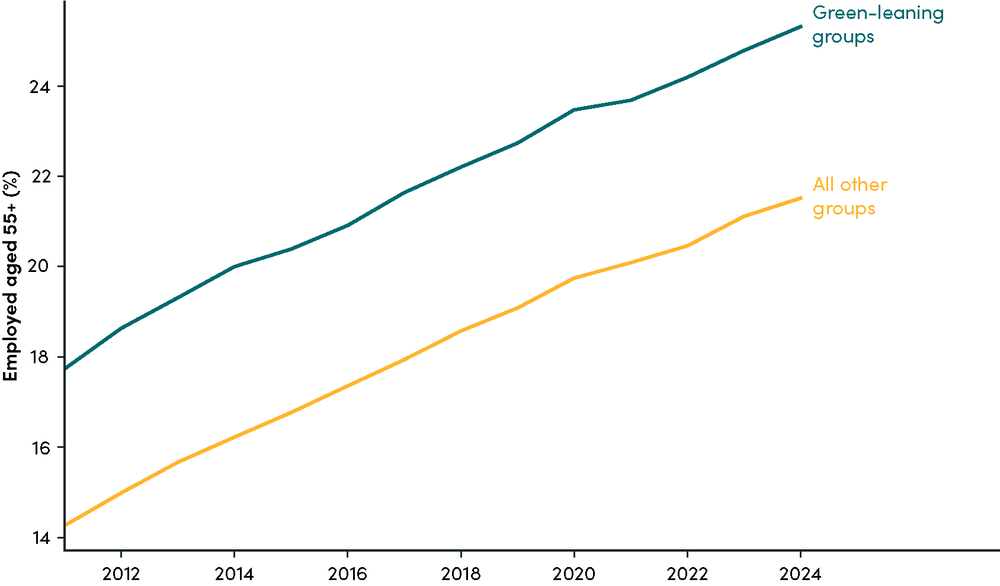
Source: Eurostat LFS (lfsa_egais).
Interestingly, a similar gap shows up in the United States data in Bahar (2026). And this is a consequence of the aging prospects of rich countries even if they have very different institutions and migration regimes. All this suggests the aging is a structural feature of these occupations where, disproportionately, across the rich world young people have been choosing university degrees over apprenticeships for decades.
4. Final reflection
In Europe, the workers the green transition needs most are a slow-growing and rapidly aging group, and while the official earnings data show no relative wage gains, online postings point to some tightening of this labor market. When the workers that are needed now require four-year apprenticeships, there is the need for quicker and effective solutions if Europe is to achieve its climate goals.
To the extent that the binding constraint on Europe's green transition heavily relies on a supply of mid-skill technical workers, then the marginal euro is probably better spent on scaling up labor migration for occupations on the shortage lists and investing into systems that allow for faster cross-border recognition of trade certifications, for instance through Global Skill Partnerships, which train workers in countries of origin for jobs both at home and abroad (Clemens, 2015).
References
Arrow, Kenneth J., and William M. Capron. 1959. “Dynamic Shortages and Price Rises: The Engineer-Scientist Case.” Quarterly Journal of Economics 73 (2): 292–308.
Bahar, Dany. 2026. “Do We Have Enough Green Workers? The Challenge of Identifying Labor Shortages in a Transitioning Economy.” Working paper, Brown University and Center for Global Development.
Blank, David M., and George J. Stigler. 1957. The Demand and Supply of Scientific Personnel. New York: National Bureau of Economic Research.
Clemens, Michael A. 2015. “Global Skill Partnerships: A Proposal for Technical Training in a Mobile World.” IZA Journal of Labor Policy 4: 2.
Dierdorff, Erich C., Jennifer J. Norton, Donald W. Drewes, Christina M. Kroustalis, David Rivkin, and Phil Lewis. 2009. “Greening of the World of Work: Implications for O*NET-SOC and New and Emerging Occupations.” Raleigh, NC: National Center for O*NET Development.
European Labour Authority. 2026. EURES – Report on Labour Shortages and Surpluses – 2025. Luxembourg: Publications Office of the European Union.
Hardy, Wojciech, Roma Keister, and Piotr Lewandowski. 2018. “Educational Upgrading, Structural Change and the Task Composition of Jobs in Europe.” Economics of Transition 26 (2): 201–231.
Revelio Labs. 2026. Revelio Labs Workforce and Job Postings Data. Accessed via Wharton Research Data Services.
U.S. Bureau of Labor Statistics. 2025. Employment Projections 2024–2034: National Employment Matrix. Washington, DC: U.S. Department of Labor.
Appendix. Data sources and measurement choices
Green intensity. The starting point is the 58 green occupations (of 61 in the taxonomy) defined at the six-digit level of the American SOC classification. Each occupation's 2024 employment from the BLS National Employment Matrix is allocated to its ISCO-08 four-digit matches from the Hardy, Keister and Lewandowski (2018) crosswalk, splitting employment equally when one occupation maps to several ISCO codes. A group's green intensity is the green share of the employment allocated to it, computed at the four-, three-, two-, and one-digit levels. The implicit assumption is that the within-group green composition of employment is similar in Europe and the United States.
Continuous versus binary. The main text classifies as green-intensive the top quartile of two-digit groups with nonzero intensity (threshold 0.31): science and engineering professionals (ISCO 21), building trades (71), electrical and electronic trades (74), mining, construction and transport laborers (93), and the small agricultural groups 62 and 63. The continuous alternative weights every group by its intensity instead of splitting; results under that weighting are reported in footnote 2.
One-digit green-leaning groups. Age and earnings data are public only at the one-digit level. Green-leaning groups are those with intensity of at least 0.20: managers (intensity 0.225), skilled agricultural workers (0.444), craft and related trades workers (0.269), and elementary occupations (0.259). One judgment call deserves flagging: at this cutoff the managers group counts as green-leaning, because the O*NET list includes many management occupations such as industrial production managers and construction managers. A 0.25 cutoff drops managers. Under that definition the aging pattern is unchanged (24.9 versus 21.9 percent aged 55 and older in 2024), relative earnings growth in the median country stays close to zero (−0.2 percent, against −0.9 percent in the baseline), and the cross-country correlation in Figure 5 remains negligible (0.01, against −0.16). Table A1 reports the full one-digit distribution; the four selected groups are separated from the remaining five by a clear gap, from 0.22 to 0.09, so the classification is insensitive to any cutoff inside that range. In other words, each of the four green-leaning groups is at least twice as green-intensive as the economy-wide average of about 10 percent, while the remaining five groups are all at or below that average.
Agricultural occupations. Agricultural groups score high on green intensity, but European farm employment has been shrinking and aging for long-standing structural reasons, which could drive part of Facts 1 and 4. Removing all agricultural groups (ISCO 61, 62, 63, and 92) from both sides of the two-digit comparison, green-intensive employment grew 10.8 percent between 2011 and 2024, against 13.6 percent for the rest. Much of the original gap comes from subsistence farmers (ISCO 63), whose recorded employment in the EU-27 fell from about 660,000 to 13,000. At the one-digit level, dropping skilled agricultural workers (ISCO 6) lowers the green-leaning share of workers aged 55 and older to 15.4 percent in 2011 and 24.4 percent in 2024, against 14.3 and 21.5 percent for the rest, and leaves the correlation in Figure 5 close to zero (−0.15). Agricultural laborers (ISCO 92) sit inside elementary occupations and cannot be separated in the public one-digit tables. Dropping both agricultural workers and managers leaves relative earnings growth in the median country at 2.0 percent.
Table A1. Green intensity of ISCO-08 major groups: share of 2024 US employment in each group accounted for by the 58 O*NET green occupations. Sources: BLS National Employment Matrix; O*NET; IBS crosswalk.
| ISCO-08 major group | Green intensity |
|---|---|
| 6 Skilled agricultural, forestry and fishery workers | 0.44 |
| 7 Craft and related trades workers | 0.27 |
| 9 Elementary occupations | 0.26 |
| 1 Managers | 0.22 |
| 3 Technicians and associate professionals | 0.09 |
| 2 Professionals | 0.09 |
| 8 Plant and machine operators and assemblers | 0.005 |
| 5 Service and sales workers | 0.003 |
| 4 Clerical support workers | 0.00 |
Structure of Earnings Survey. The SES is an employer survey run every four years (2006, 2010, 2014, 2018, 2022) covering firms with ten or more employees in NACE sectors B through S excluding O; public tables reach the one-digit occupation level. The country sample used in the text comprises the 31 countries reporting mean annual earnings in euros for firms with ten or more employees in both the 2010 and 2022 waves: Austria, Belgium, Bulgaria, Croatia, Cyprus, Czechia, Denmark, Estonia, Finland, France, Germany, Greece, Hungary, Iceland, Ireland, Italy, Latvia, Lithuania, Luxembourg, Malta, the Netherlands, North Macedonia, Norway, Poland, Portugal, Romania, Slovakia, Slovenia, Spain, Sweden, and Switzerland. The ten-plus figure is used for every country because it is the survey's harmonized scope; some countries also publish an all-firm figure, but mixing the two would compare different universes of employers. Figures are nominal; because all growth comparisons are within country, deflation leaves the green-versus-rest comparison unchanged.
Growth of medians versus median of growths. Tracking the cross-country median earnings level wave by wave (growth of medians) mixes country composition into the trend, since the median country can differ across waves and between the green-leaning and other groups; this method yields 5 versus 10 percent growth over 2010–2022. Computing each country's growth first and taking the median (median of growths) yields 31 versus 30 percent. The text uses the latter throughout.
Online job postings (Revelio Labs). Postings are classified by Revelio Labs into O*NET-SOC occupations, which map to the 58 green occupations directly by code, with no crosswalk. Salaries are Revelio's model-based estimates rather than advertised pay. Coverage by source varies over time; the analysis uses 2021–2024, the window with a stable source mix across the 18 countries used, and occupation-country cells with at least 500 postings in both endpoint years. Online postings over-represent formal-sector, online-recruiting employers, so levels should be read as the online segment of the market rather than the labor market as a whole.
Country coverage. Coverage differs by source. The shortage lists (Figure 1) come from the 28 EURES countries reporting to the European Labour Authority for 2025. The employment analysis (Figures 2 and 4) covers 32 countries: the 27 EU member states plus Iceland, Norway, Switzerland, North Macedonia, and Türkiye; the aging analysis (Figure 7) uses the EU-27 aggregate. The earnings analysis covers the 31 countries listed above. The online postings analysis covers 18 countries: Austria, Belgium, Czechia, Denmark, Finland, France, Germany, Greece, Hungary, Ireland, Italy, the Netherlands, Poland, Portugal, Romania, Spain, Sweden, and the United Kingdom. Earnings data are limited to firms with ten or more employees, so they miss the smallest employers, which are common in the construction trades.
[1] O*NET defines as green those occupations whose work is affected by green economy activities and technologies, in three categories: occupations that see increased demand, occupations whose skill requirements change, and new and emerging occupations. There is no official European list of green occupations: the EU's ESCO classification labels green skills and knowledge rather than occupations, and is in any case built on ISCO-08, the classification in which European labor statistics are reported.
[2] An alternative to the binary split is to weight every occupation group by its continuous green intensity; on that definition, green-weighted employment grew 5.1 percent between 2011 and 2024, against 11.4 percent for the rest: the same picture. The appendix lists the green-intensive groups.
[3] The sample includes the 31 countries reporting mean annual earnings in euros, for firms with ten or more employees, in both the 2010 and 2022 waves of the public SES tables; the appendix lists them.
Claude Opus 5.5 and Fable 5.1 (Anthropic) were used to assist with data analysis and drafting. The author reviewed and revised the output and takes full responsibility for the final content.
Topics
CITATION
Bahar, Dany. 2026. Where Are Europe's Green Workers? Employment, Aging, and Earnings in Green-Intensive Occupations Across the EU. Center for Global Development.DISCLAIMER & PERMISSIONS
CGD's publications reflect the views of the authors, drawing on prior research and experience in their areas of expertise. CGD is a nonpartisan, independent organization and does not take institutional positions. You may use and disseminate CGD's publications under these conditions.
Thumbnail image by: Joan Sullivan / Climate Visuals Countdown