Recommended

Few questions in labor economics are as analytically slippery as whether a country has “enough” workers. In any given year, industry associations may point to unfilled vacancies as evidence of crisis, while trade unions might consider that a healthy market. Economists tend to be skeptical: in a market economy, if employers can’t find workers, they should raise wages until they can. In competitive labor markets—and there is no evidence of monopsony in construction or utilities, the sectors where green workers are most concentrated—employers who cannot match market wages risk losing workers to competitors. The data in this note confirm that something is indeed happening on wages in the green-skilled sector, even if the signal has been modest so far. But the concept of a labor “shortage,” in the textbook sense, is almost a contradiction in terms.
And yet the question persists, and for good reason. Across high-income countries, aging populations and declining birth rates are creating a structural mismatch between the workers an economy has and the workers it needs (Kenny and Yang 2024). In Germany, more than half of companies report labor shortages, with the German Chambers of Commerce and Industry (DIHK) estimating that roughly 1.6 million vacancies cannot be filled long-term. Japan’s construction industry faces a chronic labor crisis: about a third of construction workers are 55 or older, and the jobs-to-applicants ratio exceeds 5 to 1. South Korea, Australia, and the United Kingdom all report similar dynamics (OECD 2024). This is not a cyclical problem that will resolve when the next generation enters the workforce—the next generation is smaller than the last.
The green transition adds urgency to this demographic reality. Global climate commitments require a massive scale-up of physical infrastructure—solar panels, wind turbines, heat pumps, electric vehicle charging networks, grid upgrades, building retrofits—at precisely the moment when the workforce capable of building and maintaining that infrastructure is shrinking. Crucially, the green transition appears durable even in the face of political headwinds: global investment in the energy transition exceeded $2.1 trillion in 2024—a new record—driven by economics as much as policy. The critical point is that this demand is overwhelmingly concentrated in high-income countries—precisely the countries where working-age populations are shrinking. The countries that need green workers most are the countries least able to produce them domestically. Notably, while political support for the green transition has faced headwinds in the United States, global investment momentum has proved more durable than any single administration’s priorities—driven by energy economics, corporate sustainability commitments, and the scale of infrastructure already deployed.
There is another important dimension. Much of the public discussion about the future of work centers on automation and artificial intelligence (AI) displacing human labor. But the green economy is, to a large extent, an exception to this narrative (at least for now). The occupations most critical to the green transition—electricians, HVAC technicians, solar installers, wind turbine mechanics, construction workers—are fundamentally physical and manual. They require hands-on skills, spatial judgment, and on-site problem-solving that remain difficult to automate. While AI may transform white-collar work in the short term, it is unlikely to install a heat pump or wire a solar array (that is, until robotics proves us wrong). This makes the supply of green workers a genuinely binding constraint on the transition, not one that technology can easily substitute away.[1]
This note takes on the question directly for the United States (US), using 15 years of the American Community Survey—the largest annual household survey in the country—covering nearly 15 million green economy workers across 61 occupations and all 50 states (plus the District of Columbia). Using this data, we look for signs of demand outpacing supply: Are wages for green workers rising faster than for comparable non-green workers? Is the workforce growing, and if so, who is entering? How fast are experienced workers approaching retirement, and does this vary across states? There is no single metric that cleanly answers “is there a shortage?” but by examining wages, employment growth, demographic composition, retirement rates, and geographic variation side by side—and comparing green occupations systematically to the rest of the American labor market—we can build a diagnosis.
The picture that emerges is nuanced. The widely cited green wage penalty is entirely a composition effect—it reflects who holds green jobs, not what green jobs pay. After adjusting for worker characteristics, green workers earn a small premium that has been remarkably stable for 15 years, suggesting that the market has remained in balance so far. It is worth noting that the raw wage comparison does show green workers earning less on average—as much of the existing literature documents—but this reflects the demographic and occupational composition of who holds green jobs, not what those jobs actually pay; the Mincer decomposition controls for these differences and reveals the underlying market valuation of green work. But the pipeline that has sustained this balance is under mounting pressure: nearly a third of green workers are approaching retirement, the workforce’s expansion has been heavily reliant on immigration, and the states with the tightest labor markets are those where supply growth has stalled. The situation calls for proactive investment, not panic—but the window for action is narrowing.
The puzzle: Can you have a shortage if prices adjust?
Across the clean energy industry, the same story keeps repeating in the media. Companies receive funding, sign contracts, and line up customers—but then struggle to find the workers to deliver. The Interstate Renewable Energy Council (IREC) Solar Jobs Census found that in 2023, 86 percent of solar employers reported some difficulty hiring qualified workers, with electricians and heating, ventilation, and air conditioning (HVAC) technicians among the hardest positions to fill. The US Department of Energy’s 2024 Energy and Employment Report confirmed that clean energy employment grew by 142,000 jobs in 2023 alone—at more than twice the rate of overall US employment growth—yet employers continued to report persistent recruiting challenges. The Labor Energy Partnership, a joint initiative of the Energy Futures Initiative and the labor union AFL-CIO, has estimated that the Inflation Reduction Act (signed into law in August 2022, directing approximately $370 billion toward energy and climate investments) will create nearly 1.5 million additional energy jobs by 2030 (though it is unclear if the current administration will follow through on this or not). But across the country, the ambitions of the green transition seem to be running headlong into a workforce wall.
The natural reaction is to declare a “labor shortage.” But if a solar company cannot find electricians at $30 an hour, the textbook answer is straightforward—offer $35. Or $40. At some wage, workers will come. As the economists David Blank and George Stigler argued in 1957, there is no such thing as a permanent shortage, only a price that is too low.
This logic is sound in theory. But it is incomplete in practice: Workers cannot be trained overnight. Electricians do not materialize because wages rose last quarter. And when an entire generation of experienced tradespeople retires within a decade, no amount of wage adjustment can instantly replace their skills and knowledge.
This brings us to the core analytical challenge. If demand is truly outpacing supply in green occupations, we should observe it in prices—specifically, in wages rising faster for green workers than for comparable non-green workers. If wages are not rising, either supply is keeping pace with demand, or something in the composition of the workforce is masking the signal. Both possibilities are informative. And even if wages are stable today, the underlying dynamics—who is entering and leaving these occupations, how fast, and from where—can reveal whether the current equilibrium is sustainable or fragile.
That is the approach of this analysis: building a diagnosis from multiple indicators rather than relying on any single metric.
Data and approach
Data. All data come from the American Community Survey (ACS), the largest annual household survey in the US, covering over 3 million households per year. We use the one-year samples from 2010 through 2024, accessed through IPUMS USA, and adjust all wages for inflation using the Consumer Price Index to express values in constant 2024 dollars. To isolate what is specific to the green economy, we compare green workers to all other employed workers in the US economy.
Green occupations. We define green occupations using the O*NET Green Economy taxonomy from the US Department of Labor, which identifies 61 occupation categories critical to the green transition. These range from wind turbine technicians and solar installers (occupations created by the green economy); to electricians, HVAC mechanics, and environmental engineers (existing occupations whose work has been transformed by sustainability demands); to construction laborers and bus drivers (occupations where green investment is increasing employment). Collectively, these occupations employed 14.8 million workers in 2024—roughly 7 percent of the US workforce.
Measuring the wage premium. Simply comparing average wages between green and non-green workers can be misleading, because the two groups differ in education, age, gender, race, and location. To isolate what the market actually pays for green work, we estimate a standard Mincer wage regression—the workhorse model of labor economics (named after Jacob Mincer, who pioneered the approach in 1974).
The idea is simple: wages depend on the workers’ characteristics. By estimating the relationship between wages and workers’ characteristics—for all green and non-green workers together—and then comparing what green workers actually earn to what we would predict given their characteristics, we can isolate the market’s specific valuation of green work. A positive residual means the market pays a premium for green skills; a negative one means it pays a penalty.[2]
Finding 1: The green workforce is aging fast
The share of green workers aged 55 or older—those approaching retirement within the next decade—has surged from 22.2 percent in 2010 to 29.5 percent in 2024. That is an increase of more than 7 percentage points in just 14 years (Figure 1).
The broader labor force is aging too, but more slowly. The retirement-age share among non-green workers rose from 26.3 percent to 31.7 percent over the same period—an increase of 5.4 percentage points. What is striking is the convergence: in 2010, the green workforce was substantially younger than the non-green workforce. By 2024, the gap had nearly closed.
Figure 1. Share of workers aged 55+ in green and non-green occupations, 2010–2024

Source: ACS via IPUMS USA and author’s calculations.
Note: The shaded area shows the converging gap.
In concrete terms, approximately 4.4 million green workers are now within a decade of typical retirement age. In some occupations, the concentration is notably high: 44 percent of farmers and ranchers are over 55, as are 40 percent of construction inspectors and 34 percent of electrical engineering technicians. These are occupations that require years of training and certification—you cannot replace a retiring master electrician with a freshly minted graduate, regardless of the wage on offer.
The retirement challenge is not uniform across the country. In some states, the share of green workers aged 55 or older exceeds 39 percent—roughly 10 percentage points above the national average (Figure 2). South Dakota (SD), Vermont (VT), and Iowa (IA) stand out as states where the green workforce is approaching a demographic cliff. These are predominantly rural areas where construction, agriculture, and energy infrastructure jobs are essential, but attracting young workers has been a persistent challenge; high rates of out-migration from rural areas may compound these pressures—further thinning the pipeline of young workers entering the local labor market—though testing this hypothesis rigorously is beyond the scope of this brief.
Figure 2. States with the highest share of green workers aged 55+

Source: ACS via IPUMS USA and author’s calculations.
Note: Diamond markers show the non-green retirement share for comparison.
This is arguably the most predictable source of future workforce strain. Unlike wages, which can adjust relatively quickly, demographic shifts unfold over decades. The workers who will retire in the 2030s are already 55 today. The workers who could replace them need to begin training now.
Finding 2: Green jobs are booming—supply is responding
Here is the good news: the green workforce is growing. From 11.7 million workers in 2010 to 14.8 million in 2024, green employment expanded by 27 percent. Over the same period, non-green employment grew by just 12 percent (Figure 3).[3] Green jobs are being created at more than twice the rate of the rest of the economy—a pattern also documented by Environmental Entrepreneurs (E2)’s Clean Jobs America report and the Department of Energy (DOE)’s annual energy employment surveys.
Figure 3. Employment growth indexed to 2010

Source: ACS via IPUMS USA and author’s calculations.
Note: 100 for green and non-green occupations.
The green workforce grew by more than 3 million people. This supply expansion is the key to understanding why the green labor market has not (yet) overheated: demand for green workers has surged, but supply has responded. The question is how—and whether that response can be sustained.
Finding 3: The changing face of the green workforce
If supply has expanded so rapidly, who are the new workers? The answer reveals a dramatic demographic transformation—one that explains both the strength of the supply response and its vulnerability (Figure 4).
Between 2010 and 2024, the share of White non-Hispanic workers in green occupations fell from 64 percent to 54 percent—a decline of 10 percentage points in just 14 years. Over the same period, the Hispanic share rose from 22 percent to 28 percent, and the female share grew from 12 percent to 16 percent. On the education front, the share with a bachelor’s degree or higher rose from 16 percent to 23 percent, while the share with less than a high school diploma fell from 19 percent to 15 percent.
Figure 4. Demographic and educational composition of the green workforce, 2010–2024

Source: ACS via IPUMS USA and author’s calculations.
Notes: Panel (a) shows the declining White non-Hispanic share and rising Hispanic and female shares. Panel (b) shows rising college attainment.
This diversification matters for interpreting wage data. Green and non-green workers are very different kinds of people—they differ in education, age, gender, race, and where they live. When we simply compare average wages without accounting for these differences, we are comparing apples to oranges. The growth of the Hispanic share from 22 percent to 28 percent, for instance, mechanically pulls down the average green wage—not because green jobs pay Hispanic workers less, but because Hispanic workers earn less on average across the entire economy due to well-documented wage gaps. The same logic applies to the growing female share. The raw wage gap tells us about the changing composition of the green workforce, not about how the market values green work.
This composition shift also has a clear policy implication. The supply expansion documented in Finding 2 has been substantially driven by the entry of Hispanic workers into green trades. This makes the green transition’s workforce pipeline vulnerable to immigration policy changes—a point I return to below.
Also, in 2024, 24.2 percent of green workers were foreign-born, compared to 19.3 percent of non-green workers—a gap of nearly 5 percentage points. The foreign-born share of the green workforce has risen from 22.1 percent in 2010 to 24.2 percent in 2024. In absolute terms, the number of foreign-born green workers grew from 1.6 million to 2.6 million—meaning that immigrants accounted for roughly 28 percent of the net increase in the green workforce over this period. The green transition’s workforce relies on the immigrant workforce.
Finding 4: What the market actually pays for green work
The average green worker earned $32.48 per hour in 2024 (in constant dollars), compared to $38.39 for workers in non-green occupations—an hourly wage penalty of about 15 percent. This gap has been widening: it was roughly 10 percent in 2010. At first glance, this looks like the opposite of a shortage—if employers were desperately competing for green workers, we would expect wages to be rising faster, not slower.
But as the previous findings make clear, raw wage comparisons conflate two distinct things: the price the market puts on green work, and the characteristics of the workers who hold green jobs. Using the Mincer wage regression described above, I compare the average wage residual for green workers to that of non-green workers. The residual captures what green workers earn relative to what we would predict given their observable characteristics: it isolates the market’s valuation of green work, net of composition.
The result is striking. After controlling for worker characteristics, the 15 percent raw penalty disappears entirely (Figure 5). In fact, it reverses: green workers earn approximately 2 percent more per hour than observationally equivalent non-green workers—about $0.65 per hour. This conditional premium has been remarkably stable over the entire 2010–2024 period, hovering between 1 percent and 4 percent, with a brief spike to 3.7 percent in 2019 before returning to 2.1 percent in 2024.
Figure 5. The raw wage gap (left) versus the conditional wage premium (right), 2010–2024

Source: ACS via IPUMS USA and author’s calculations.
Note: After controlling for education, demographics, and geography, the 15 percent penalty reverses into a small, stable premium.
Figure 5 tells the entire story in two panels. On the left, the raw hourly wage gap widened from –10 percent to –15 percent between 2010 and 2024—a pattern that seems alarming. On the right, the conditional premium—what the market actually pays for green work, after adjusting for worker characteristics—has been positive and flat. The widening of the raw gap is not driven by the market devaluing green work. It is driven by the compositional changes documented in Finding 3: a rapidly diversifying workforce whose new entrants earn less on average across the economy.
Two caveats on interpretation. First, the exact magnitude of the conditional premium depends on the controls included and the regression specification. The Mincer decomposition here is descriptive, not causal: its purpose is to demonstrate that workforce composition accounts for most of the observed wage gap, a qualitative conclusion that is robust to mild modifications in the specification or sample.
Second, the level of the premium—approximately 2 percent—tells us that the market values green skills, but modestly. More informative for the shortage question is the trend. If demand were rapidly outpacing supply, we would expect the premium to be rising as employers bid up wages. Instead, it has been essentially flat for fifteen years—suggesting that supply, through the expansion and diversification documented above, has kept pace with demand in aggregate. If pressure is there, the data suggest that the market is adjusting to it as we would expect.
Finding 5: Where supply is tight, markets pay more
The most compelling evidence for the supply story comes from subnational variation. If demand is indeed resulting in a higher supply of workers, we should see faster premium growth in states where the green labor has expanded. And that is exactly what the data show.
Figure 6 plots each state’s green employment growth against the change in its conditional premium from 2010 to 2024 (measured as the change in mean Mincer residual for green workers). The positive correlation confirms the intuition: states where employment grew faster also saw faster growth in what the market pays for green work. This is consistent with demand pulling wages up in states where the green economy is booming. This state-level pattern is the clearest evidence that while supply and demand dynamics are operating as expected, the heterogeneity in these dynamics fails to show up in the national averages seen above.
Figure 6. State-level green employment growth vs. change in conditional wage premium, 2010–2024

Source: ACS via IPUMS USA; Mincer regression with state and year fixed effects.
Notes: States with faster employment growth also saw faster premium growth (r = 0.29), consistent with demand pulling wages up where the green economy is expanding. Bubble size reflects green workforce size.
Implications for policy
What do the data tell us? The US green workforce is aging rapidly, with a retirement wave already underway. Supply has responded to rising demand—outpacing non-green employment growth by more than two to one—but this expansion has been driven by demographic diversification and, critically, by the entry of foreign-born workers into green trades. The conditional wage premium is small and flat, suggesting the market is roughly in balance at the national level, though subnational dynamics show how wages are reacting to higher demand across different states.
Overall, there are two risks that we identify worth paying attention to:
The retirement wave. As documented in Finding 1, 4.4 million green workers are within a decade of retirement—and this share is growing faster than in the broader economy. These workers took years to train and their institutional knowledge cannot be easily replaced. The pipeline of new entrants must not only continue but accelerate to offset these departures.
The immigration dependency. Nearly one in four green workers (24.2 percent) is foreign-born—five percentage points higher than in the non-green workforce. The number of foreign-born green workers grew from 1.6 million to 2.6 million between 2010 and 2024, accounting for roughly 28 percent of the net increase in the green workforce. Much of the supply expansion in fast-growing states like Florida and Texas has been driven by immigrant workers entering construction and green trades. While the supply has been able to adjust so far, it is unclear whether this can continue—especially given the current policy direction on immigration. A significant restriction would constrain exactly the pipeline that has allowed supply to keep pace with demand.
If the evidence points to a supply pipeline under pressure rather than an acute crisis, the response should be proactive rather than panicked. Three priorities stand out:
1. Invest in training pipelines now
The 3–5 year lag between starting a training program and producing a qualified tradesperson means that investments made today will produce graduates just as the retirement wave peaks. Community colleges, apprenticeship programs, and vocational training in green trades—electricians, HVAC technicians, solar installers—deserve increased funding and public attention.
2. Create managed international pathways for green-skilled workers
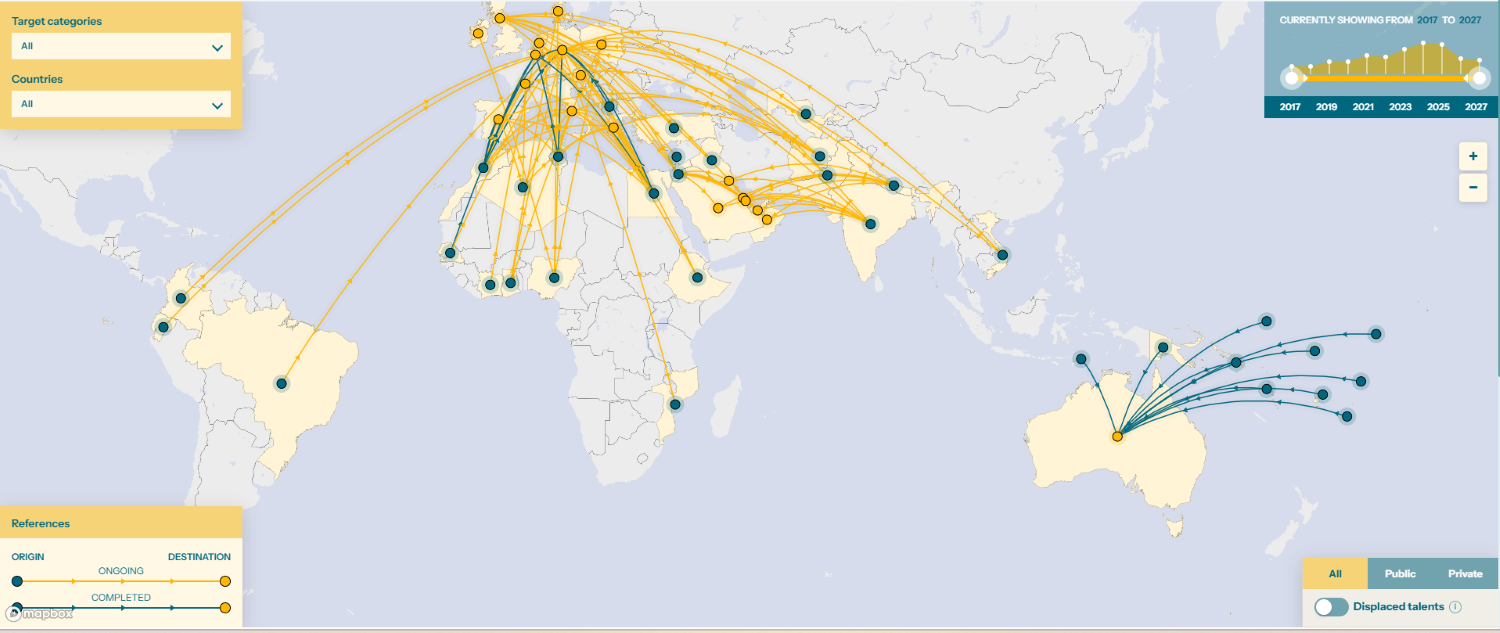
The demographic arithmetic in high-income countries is stark: aging populations and declining birth rates make it very difficult to produce enough domestic workers for the scale of the green transition within the required timeframe. Meanwhile, the demographic picture in many low- and middle-income countries is the mirror image. According to the UN World Population Prospects, sub-Saharan Africa’s population is projected to double by 2050, with a median age of just 19. India, the Philippines, Bangladesh, and Indonesia all have large, young populations—and high rates of youth unemployment. Bilateral agreements with these countries to jointly invest in green skills training could create a genuine win-win: countries of destination gain the workers they need, while countries of origin gain employment, skills development, and remittance flows (see Dempster and Huckstep, 2024, for a guide to partnership models). Several models already exist: A recent mapping by my colleagues at the Center for Global Development identifies at least 26 projects across 54 countries that pair green skills training with international labor mobility, spanning solar installation, energy efficiency, and sustainable construction—most launched since 2023. These should be designed as partnerships, with fair wages and pathways to permanent residency, not as guest worker programs that extract labor without building human capital.
3. Target geographic hotspots
A national program is a blunt instrument for what is fundamentally a local problem. States with high retirement shares and limited supply growth—particularly rural states—may need targeted incentives: relocation assistance, housing subsidies, student loan forgiveness tied to green employment, or expedited licensing reciprocity so that an electrician licensed in Ohio can work in Montana without starting over.
Conclusion
The language of labor shortages is politically convenient but analytically imprecise. The Mincer decomposition at the heart of this brief offers a cleaner lens: the widely cited green wage penalty is a composition artifact, and the conditional premium—what the market actually pays for green work—has been small and stable for fifteen years. The market is not devaluing green skills; it is absorbing a rapidly diversifying workforce.
But stability is not the same as security. The supply expansion that has kept the conditional premium in balance depends on continued in-migration, on training pipelines that are not yet accelerating, and on a generation of experienced workers who are steadily approaching retirement. The indicators are flashing yellow, not red. The time to act is before they turn red—because by then, the workers needed will take years to train, and the climate timeline does not wait. A caveat applies to the US context: the current administration may scale back some of the investment commitments made under the Inflation Reduction Act, which could soften near-term demand for green workers. But the light remains yellow, not red. Green energy economics and long-run decarbonization pressures are not going away, and policy priorities on clean energy tend to cycle back. If and when they do—and experience suggests this is a matter of years, not decades—the skills challenge will return, and workers will still take years to train.
This is not just an American problem. It is a high-income country problem—one driven by the same demographic forces playing out across Europe, East Asia, and Oceania. And it is a problem that low- and middle-income countries, with their young and growing populations, may be uniquely positioned to help solve. The question is whether we will build the institutions and partnerships needed before the shortage becomes undeniable—or after.
View the methodological appendix here.
Note: This note was edited with assistance from AI and reviewed by the authors and a human editor before publication.
[1] In addition, the AI-driven massive investment in data centers also needs these same skills, so the demand for green skills is to some extent underestimated if not accounting for that.
[2] Refer to the methodological appendix for more details on how the Mincer regression was estimated.
[3] Using 2010 as baseline, which was the trough of the Great Recession, could inflate growth rate of construction employment which was particularly depressed. However the core finding is robust to computing this growth rate changing the baseline year: national green employment growth falls from 52 percent (2010 baseline) to 47 percent (2012) or 43 percent (2013), but still far exceeds non-green growth over the same period. The state-level pattern also holds: the positive correlation between employment growth and conditional wage growth is r = 0.29 using 2010, r = 0.38 using 2012, and r = 0.29 using 2013. If anything, the relationship strengthens when the Great Recession trough is excluded.
References
Blank, D.M. & Stigler, G.J. (1957). The Demand and Supply of Scientific Personnel. National Bureau of Economic Research. https://www.nber.org/books-and-chapters/demand-and-supply-scientific-personnel
BloombergNEF (2025). “Global Investment in the Energy Transition Exceeded $2 Trillion for the First Time in 2024.” Energy Transition Investment Trends. https://about.bnef.com/insights/finance/global-investment-in-the-energy-transition-exceeded-2-trillion-for-the-first-time-in-2024-according-to-bloombergnef-report/
Bureau of Economic Analysis. Gross Domestic Product (GDP) Per Capita. US Department of Commerce. https://www.bea.gov/data/gdp/gross-domestic-product
Bureau of Labor Statistics. Consumer Price Index for All Urban Consumers (CPI-U). US Department of Labor. https://www.bls.gov/cpi/
Consoli, D., Marin, G., Marzucchi, A., & Vona, F. (2016). Do green jobs differ from non-green jobs in terms of skills and human capital? Research Policy, 45(5), 1046–1060. https://doi.org/10.1016/j.respol.2016.02.007
Curtis, E.M. & Marinescu, I. (2023). Green energy jobs in the US: What are they, and where are they? Environmental and Energy Policy and the Economy, 4(1), 202–237. https://doi.org/10.1086/722390
Dempster, H. & Huckstep, S. (2024). Options for Green-Skilled Migration Partnerships: A Guide for Policymakers. CGD Policy Paper 330. https://www.cgdev.org/publication/options-green-skilled-migration-partnerships-guide-policymakers
E2 (2024). Clean Jobs America 2024. Environmental Entrepreneurs. https://e2.org/reports/clean-jobs-america-2024/
Euronews (2023). “More than half of German companies report labour shortages.” January 12, 2023. https://www.euronews.com/next/2023/01/12/germany-economy-labour-shortages
German Bundestag (2023). Fachkräfteeinwanderungsgesetz [Skilled Workers Immigration Act], as amended. https://www.loc.gov/item/global-legal-monitor/2023-08-24/germany-new-skilled-workers-immigration-act-enacted/
International Energy Agency (2023). World Energy Employment 2023. https://www.iea.org/reports/world-energy-employment-2023
Kenny, C. & Yang, G. (2024). The Implications of a Declining Labor Force. CGD Working Paper. https://www.cgdev.org/publication/implications-declining-labor-force
Interstate Renewable Energy Council (2024). National Solar Jobs Census 2024. https://irecusa.org/programs/solar-jobs-census/
IPUMS USA, University of Minnesota. American Community Survey 1-year samples, 2010–2024. Steven Ruggles et al. https://usa.ipums.org
Labor Energy Partnership (2022). LEP Analysis of the Inflation Reduction Act: Key Findings on Jobs, Inflation, and GDP Growth. Energy Futures Initiative & AFL-CIO. https://laborenergy.org/fact-sheets/lep-analysis-of-the-inflation-reduction-act-key-findings-on-jobs-inflation-and-gdp/
Mincer, J. (1974). Schooling, Experience, and Earnings. National Bureau of Economic Research. https://www.nber.org/books-and-chapters/schooling-experience-and-earnings
O*NET Resource Center. Green Economy Occupations. US Department of Labor. https://www.onetcenter.org/dictionary/27.0/excel/green_occupations.html
OECD (2024). "Understanding Labour Shortages: The Structural Forces at Play." In OECD Economic Outlook, Volume 2024 Issue 2. OECD Publishing, Paris. https://doi.org/10.1787/d8814e8b-en
Statista (2024). Construction industry in Japan—statistics & facts. https://www.statista.com/topics/7308/construction-industry-in-japan/
United Nations, Department of Economic and Social Affairs, Population Division. World Population Prospects 2024. https://population.un.org/wpp/
US Department of Energy (2024). United States Energy & Employment Report 2024. https://www.energy.gov/articles/doe-report-shows-clean-energy-jobs-grew-more-twice-rate-overall-us-employment
Vona, F., Marin, G., Consoli, D., & Popp, D. (2018). Environmental regulation and green skills: An empirical exploration. Journal of the Association of Environmental and Resource Economists, 5(4), 713–753. https://doi.org/10.1086/698859
Topics
CITATION
Bahar, Dany, and Greg C. Wright. 2026. Do We Have Enough Workers? The Case of Green Skills in the US. Center for Global Development.DISCLAIMER & PERMISSIONS
CGD's publications reflect the views of the authors, drawing on prior research and experience in their areas of expertise. CGD is a nonpartisan, independent organization and does not take institutional positions. You may use and disseminate CGD's publications under these conditions.
Thumbnail image by: teerawat/ Adobe Stock