Recommended

TESTIMONY
Oral Evidence at the International Development Committee
It is well understood that the same amount of aid makes a bigger difference to peoples’ lives when their incomes are lower. And Development Minister Andrew Mitchell has rightly emphasised a “focus on the poorest and most vulnerable” in the UK’s development activities.
With significant cuts to the UK’s aid budget since 2020, we might have expected remaining resources to become more focussed on the poorest. However, the latest official data for 2021 shows that the trend of moving resources away from the poorest countries—with average recipient incomes having risen over the last decade—has actually accelerated.
In this note, we show that this trend is not being only driven by the predisposition of recent governments to allow other departments to spend a significant portion of the aid budget, but by the Foreign Commonwealth and Development Office (FCDO) and its predecessor themselves becoming significantly less pro-poor in aid allocation.
We find that today, the income of the typical recipient of UK aid is in line with the average income of the poorest 50 percent of people in the world. But a decade ago, UK aid was far more focused on the very poorest—with the typical recipient's income coming in at roughly the average for the poorest 30 percent. The focus on the poorest and most vulnerable has unquestionably been lost. How then, can we get it back?
We recommend that Development Minister Andrew Mitchell commits to reversing this change, and of returning the average recipient income of UK aid to below the average income of the world's poorest 40 percent. This is something he could tackle head on through the “star chamber” scrutinising the quality of aid spend across government with the Chief Secretary to the Treasury.
The 2021 UK aid cuts hit the poorest hardest
With a smaller aid budget, we might expect that every pound should be better targeting those in need. But as the National Audit Office warned, the speed and scale of the 2021 aid cuts posed value for money risks; and the latest Statistics on International Development (SID) confirm that the cuts were regressive.
The 2021 SID shows that the sharpest cuts to the UK’s bilateral aid fell on the group of least developed and low-income countries (LDCs and LICs). Finance provided to these 47 countries fell by 40 percent, compared to 29 percent for 39 lower-middle income countries (LMICs), and 17 percent for 56 upper-middle income countries (UMICs).
Figure 1. UK aid by recipient income group, with steep fall in the amount to the lowest income
UK country-specific bilateral aid by income group, 2009-21 (nominal GBP millions)
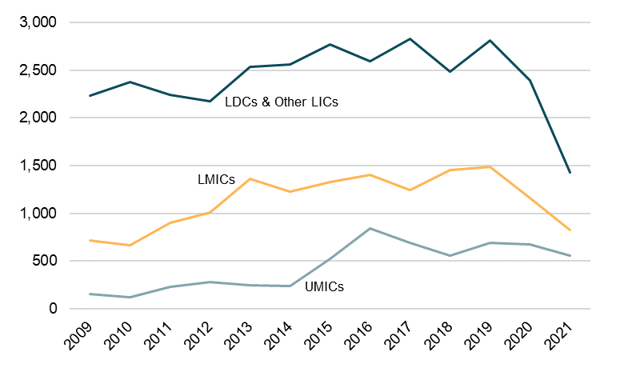
Source: UK Statistics on International Development
This means that 51 percent of UK bilateral aid with a recipient country specified was allocated to LDCs/LICs in 2021; down from a 56 percent share before the cuts in 2019, and a 66 percent share a decade ago in 2011. Such figures based on income groupings are striking; but they are also limited. In this note we calculate a more accurate measure of poverty focus.
A more accurate measure of poverty-focus
In this note, we estimate the average recipient income of the UK’s bilateral aid based on the GNI per capita of recipient countries and regions, weighted by the funds provided to each. This provides a more accurate measure of the poverty focus of UK aid than just looking at the share of funds to different income groups, which misses changes in allocation within these groups (and excludes spend recorded with a region as recipient rather than country).
One challenge for this calculation is the significant and rising share of the UK’s bilateral aid that is recorded with an unspecified recipient. Over half was recorded this way in 2021. Most of this unspecified spend (54 percent) was not assigned a recipient due to programmes having multiple beneficiaries which could not be disaggregated, or due to funds being channelled through other organisations with undesignated recipients. But a large share (39 percent) was recorded this way because it was actually spent inside the UK, for instance on refugees, asylum seekers, scholarships, and administrative costs.
We take two approaches to deal with this unspecified spend. First, spend with an unspecified recipient has been excluded (see Panel A of Figure 2). And second, it has been assigned the average GNI per capita of low- and middle-income countries (see Panel B).
The FCDO is far more pro-poor than other departments spending aid money, yet its share of the budget is falling
Figure 2 shows that the FCDO is far more pro-poor in its bilateral aid allocation than the UK’s other extending agencies. The average income of FCDO recipients was $7,569 in 2021, compared to $10,368 for other extending agencies (Panel B). And if we only consider spend with a specified recipient, the difference is even more stark: $5,190 for the FCDO and $9,598 for others (Panel A).
Figure 2. Average recipient income of UK bilateral aid by extending agency, 2009-21

Notes: (i) Mean recipient GNI per capita is weighted by the volume of ODA provided to each recipient country/region. (ii) A significant share of the UK’s bilateral ODA is recorded with an unspecified recipient. In Panel A, spend with an unspecified recipient has been excluded. In Panel B it has been assigned the average GNI per capita of low- and middle-income countries. (iii) The “FCDO” series combines both DFID and FCO for years prior to the 2020 merger.
Source: CGD analysis, based on the UK’s Statistics on International Development and the World Bank’s World Development Indicators
Yet the FCDO share of bilateral ODA has fallen significantly since 2015, when the UK’s aid strategy set out to increase the amount administered by other government departments. The FCDO controlled 87 percent of the bilateral ODA budget in 2015, falling to 62 percent in 2021 (Panel B); or from 92 to 76 percent of the budget with a specified recipient (Panel A).
Both the FCDO and other departments have also both become less poverty-focussed
To make things worse, the portfolios of both the FCDO and other extending agencies have also become less focused on poverty over time. Considering all spend (Panel B), the average income of FCDO recipients’ income consistently rose each year between 2011 and 2021, rising 61 percent over the period (from $4,697 to $7,569). The trend for other extending agencies is also clear, with the average income of their recipients also rising 53 percent over the decade (from $6,790 to $10,368).
And this is not just a matter of a rising proportion of spend with an unspecified recipient. Excluding this spend (Panel A) also shows that average recipient income for the FCDO’s bilateral aid in 2021 ($5,190) is 26 percent above its level in 2015 ($4,112), and 46 percent above its 2009 level ($3,544). Likewise, it has also risen for other extending agencies, increasing by 38 percent between 2009 to 2021 (from $6,931 to $9,598).
On both of these measures, the 2021 aid cuts significantly worsened the poverty focus of UK aid—for both within and beyond the FCDO. (For the FCDO, this confirms what we expected from plans in its annual report.) And whilst the poverty focus of FCDO and non-FCDO specified spend did improve in 2020, this was largely due to the fall in recipients’ incomes due to COVID.
The overall poverty focus of UK aid has declined, even relative to the global distribution of income
Figure 3 shows how the overall poverty focus of UK aid has declined, through the combined effects outlined above: a declining FCDO share, worsening FCDO and non-FCDO portfolios, and rise in unspecified spend. For spend with a specified recipient, average recipient income rose 65 percent between 2009 and 2021 (from $3,801 to $6,259). And when unspecified spend is included, the rise is even greater, at 79 percent (from $4,832 to $8,625).
However, one might expect this rise in recipient income simply due to most countries achieving economic growth over the period. Hence Figure 3 also includes reference lines tracking how average incomes have changed for the poorest 10 percent of the world’s population (≤P10= mean income of the poorest 10 percent), average income of the poorest 20 percent (≤P20), and so on up to the average of the bottom 70 percent (≤P70). And these show how average recipient income has also risen relative to the global income distribution.
Figure 3. UK aid recipients’ income rises in absolute and relative terms
Average recipient income of UK bilateral aid vs. average income below percentiles in the global income distribution
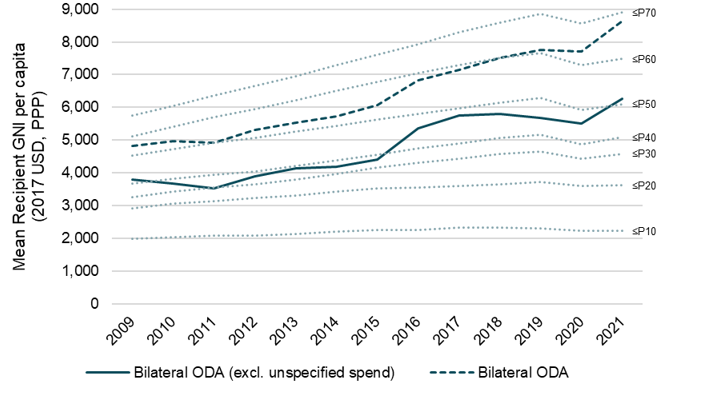
Notes: (i) Mean recipient GNI per capita is weighted by the volume of ODA provided to each recipient country/region. (ii) A significant share of the UK’s bilateral ODA is recorded with an unspecified recipient. In the upper series spend with an unspecified recipient has been assigned the average GNI per capita of low- and middle-income countries. In the lower series it has been excluded. (iii) The reference lines ≤P10 to ≤P70 show the average GNI per capita (2017 USD, PPP) across the bottom 10 to 70 percent of the global income distribution (where countries are weighted by population, and their entire population is assigned the national GNI per capita).
Source: CGD analysis, based on the UK’s Statistics on International Development and the World Bank’s World Development Indicators
A decade ago, in 2011, the average recipient income for the UK’s bilateral aid with a specified recipient matched the average income of the bottom 30 percent of the global income distribution. By 2021 it had surpassed the average of the bottom 50 percent. In particular, we see that average recipient income rose relative to the incomes of the poorest deciles after the 2015 aid strategy (which broadened the geographic focus of UK aid beyond the poorest countries), and with the 2021 cuts.
And we see a similar story if spend with an unspecified recipient is included. On this measure, average recipient income in 2011 matched the average income amongst the poorer half of world’s population. But it has since risen relative to the global income distribution; again, notably after the 2015 aid strategy and with the 2021 cuts. It is now approaching the average income of the bottom 70 percent.
Furthermore, average income has stagnated for the bottom tenth of the global income distribution: which saw just 12 percent cumulative growth from 2009 to 2021. This compares to a 65 percent rise in average income of the specified recipients of UK aid; a rise which has also outpaced economic growth amongst the bottom fifth of the global income distribution (24 percent).
In combination, the decline in the FCDO’s share, the rise in average recipient incomes in the portfolios of both the FCDO and other extending agencies, and the growing share of spend with an unspecified recipient have led to a long-term and significant decline in the poverty focus of the UK’s bilateral aid—even relative to the global income distribution. The recent 2021 aid cuts have exacerbated and accelerated this; but it is important to recognise that they also represent a continuation of a general trend.
Reinstating the UK's focus to where aid has most impact
To ensure the UK’s aid is impactful and effective, it will need to be refocussed on the poorest countries. Minister Mitchell’s new ‘star chamber’ with the Chief Secretary to the Treasury has a remit to “maximise value for money” of ODA. As our colleague Charles Kenny points out, “any aid used in upper middle-income countries needs the potential to generate returns that are multiples of those expected in poor countries.”
We propose that the star chamber applies this principle, and also takes on a goal for both the FCDO and other departments share of spend towards poorer countries. In the next two years we suggest that this is expressed in terms of the global income distribution both to avoid the imprecision of broad country groupings, and also to improve transparency and clarity with the public. We recommend that UK aid is re-focussed on the poorest 40 percent in the global income distribution (as it was prior to the 2015 aid strategy; see Figure 3). This would ensure the greatest impact, re-establish the UK’s leadership on poverty-focus, and also strengthen the case with the public that spend its focussed on countries and people that really need it.
Topics
CITATION
Hughes, Sam, and Ian Mitchell. 2023. How to Reverse the Decline in the Poverty Focus of UK Aid. Center for Global Development.DISCLAIMER & PERMISSIONS
CGD's publications reflect the views of the authors, drawing on prior research and experience in their areas of expertise. CGD is a nonpartisan, independent organization and does not take institutional positions. You may use and disseminate CGD's publications under these conditions.