Recommended
CGD NOTE
A Review of Key Approaches to ODA Reform
This week, international organizations will meet in New York to prepare for next June’s UN Conference on Financing for International Development.
One item on the agenda, is Official Development Assistance’ (ODA); and the conference next year could eventually lead to reforms. We have already created an alternative measure—Finance for International Development (FID)—which is a better guide to the funding that matters to development. In this blog, we highlight five insights from that measure; and use it to highlight where ODA is expanding unhelpfully with items barely relevant to developing countries.
We find that FID has increased over the five years to 2023, with all but six of the 27 countries we examine increasing their international finance effort relative to their economy since 2018.
ODA has increased more quickly but six providers are spending at least a third of their ODA domestically. Refugee hosting costs are the main driver; though administrative costs have also risen, with the US reporting more administration costs than all other providers combined, and double the level it reported in 2018.
We argue that ODA has become polluted with items of limited relevance to developing countries welfare; and urge the parties to consider proposals that lead to a measure of what we care most about.
What is Finance for International Development (FID)?
FID measures the grant-equivalent of cross border finance provided to low- and middle-income countries. It was designed to measure development spending more meaningfully than reported ODA levels do, by excluding items outside that definition (see below). It also enables better comparisons with countries outside the traditional donor group (i.e., non-OECD Development Assistance Committee or DAC members). In particular, it includes all concessional finance (bringing in much more of China’s finance, for example); whereas ODA excludes some less concessional efforts. The full method is here.
In this blog, we focus only on the DAC providers; but a full update, covering all of the G20 will be included in the next edition of CGD’s Commitment to Development Index.
1. Finance for development grew, but more slowly than ODA
Total finance for international development from DAC countries grew 14 percent between 2018 and 2023, from 0.26 to 0.29 percent of providers’ economies. That’s an increase from $130 billion in 2018 to $176 billion in 2023, or 35 percent.
But the non-finance elements of ODA have increased more quickly, so that almost a fifth of ODA now does not qualify for FID (up from under a sixth in 2018).
Figure 1: FID vs ODA for DAC countries, 2018-23 (%GNI)

2. Refugee-hosting (and admin) costs are mounting up
We identify six main areas of ODA that are not cross-border finance. These are valuable activities, but they are not international development finance. Refugee hosting costs have risen dramatically, in part due to large numbers fleeing Ukraine; but also due to some providers’ “maximalist” approach to reporting.
Other elements—student bursaries, debt relief, research and development awareness—have all remained flat in nominal terms. However, administrative costs have also increased steeply, rising by almost 50 percent.
Figure 2: Non-cross-border ODA flows of DAC countries

2018-23 (USD billions, current prices)
The above estimates for spend on research done domestically are likely a significant underestimate, as we currently just capture research spend by governments where no specific sector is recorded. We hope to review this methodology to incorporate spend through NGOs, firms and universities, as well as to capture sector-specific research where it is undertaken domestically.
The increase in administrative costs is almost entirely driven by the US, as their reported costs more than doubled, rising from under $3 billion in 2018 to over $6 billion in 2023. Although its finance has increased substantially over this period—from $30 to $53 billion—its administrative costs have increased far more quickly, to 9 percent of total spend (more than all other G7 countries; and well-above the 5 percent DAC average). Indeed, the US reports more on administration than the other 26 DAC countries we analyse (and likely the other four we don’t (Estonia, Iceland, Lithuania, and Slovenia). So, the US accounts for over half of total admin costs but provides only 30 percent of the total finance.
3. Six countries spend over a third of their ODA at home
Over half of Ireland’s ODA is being spent at home; as is Czechia’s. Together with Hungary Poland, Switzerland and the UK, there are six countries spending over a third of ODA within their own borders. By contrast, Greece and the Slovak Republic report just 1 and 4 percent of their ODA being spent domestically, and seven countries in total report spending under 10 percent (inc Sweden, Australia and South Korea).
For the G7 countries, the UK spends the most at home, with fully 33 percent of its ODA budget spent domestically. Japan reports the least ODA spent at home, at just four percent.
Figure 3: Non-cross-border ODA flows for DAC countries, 2023 (%ODA)

4. The UK made by far the largest cuts, but who does the most on finance for development?
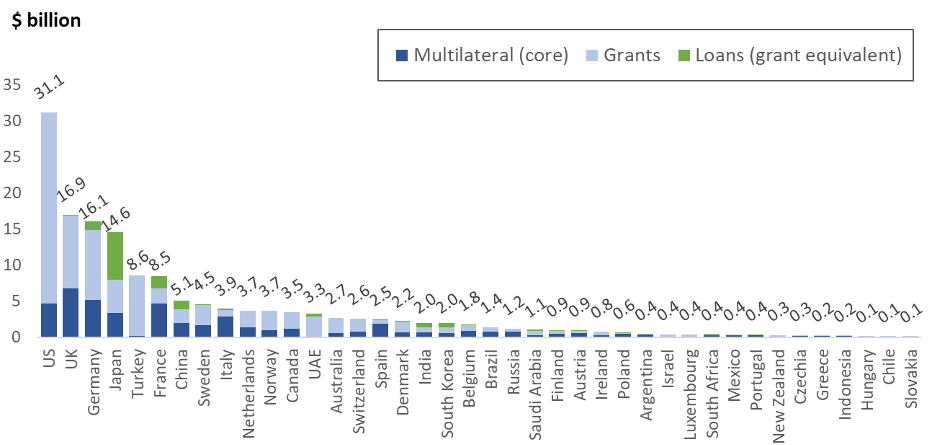
Norway provided the largest share of development finance relative to its national income, with Luxembourg, Sweden, Denmark and Germany completing the top five.
In terms of changes, only six countries have reduced their finance since 2018. The UK has made by far the largest reduction in level of financing for development with a fall of 39 per cent in the share of its national income provided as FID (-0.25 percentage points) followed by Sweden (-0.11), Hungary (-0.08), Denmark (-0.03), Australia (-0.02) and Czechia (-0.004). Several countries have materially increased their FID since 2018 too, Germany, France, Japan, the United States, Finland, Poland and Austria.
Figure 4: FID by DAC country, 2018-23 (%GNI)
5. There is a strong relationship between domestic income levels and international finance provision
Even within this group of high-income countries, there exists a clear relationship between their per head income level at home (adjusted for price levels); and the level of finance they provide.
This shows the importance of increasing prosperity to increased provision of finance.
Figure 5: Finance for development versus income per head

Source: Authors analysis
Time to reform ODA
We have argued before that ODA needs reform. The title of the UN’s financing for development process has the thing we care most about in its title. We should measure that, rather than the valuable but much-less relevant elements of ODA.
Our colleagues have submitted proposals for the way forward, suggesting we measure finance across three distinct development purposes, and CGD will be publishing a full compendium of views early next year.
Topics
DISCLAIMER & PERMISSIONS
CGD's publications reflect the views of the authors, drawing on prior research and experience in their areas of expertise. CGD is a nonpartisan, independent organization and does not take institutional positions. You may use and disseminate CGD's publications under these conditions.