Recommended
If the 52 poorest countries in the world—home to a rising population of 1.4 billion people—grow their economies rapidly, how much will they contribute to global carbon emissions in 2030? And how important will this be in our fight against climate change?
In a new analysis, we model several scenarios for CO2 emissions to 2030. We find that, even if the rest of the world makes straight-line progress towards zero emissions in 2050, and even if the poorest 52 countries grow very rapidly and achieve income per head of $6,000, those 52 countries will still only account for 11 percent of global emissions. In arguably more likely scenarios, they would account for just 6 to 8 percent—or potentially as little as 4 percent.
It’s too early to say how COVID-19 and the oil price collapse will affect emission pathways. What is clear is that the rapid growth in low income countries we model is even less likely and our findings hold that emissions from the poorest countries will remain relatively small for at least the next decade.
Even though they’ve had little role in climate change to date, the poorest countries are both more exposed and more vulnerable to its effects. There are, and will be, opportunities for these lower-income countries to take advantage of low-carbon technology (not least by avoiding coal), but for the world to halt climate change as it pledged in the Paris Agreement, it will need to focus mitigation efforts on reducing emissions in the OECD, China, and high-emission countries.
Who put the CO2 in the atmosphere?
Historically, it’s clear that the stock of greenhouse gases in the atmosphere was driven by the activity of (now) developed countries. We’ve rearranged estimates by World in Data to look at cumulative total CO2 emissions since the middle of the 18th century by income-based country groups. The poorest 52 countries have contributed just 1 percent of cumulative CO2 emissions.
Cumulative CO2 emissions 1751–2017 (million tonnes)
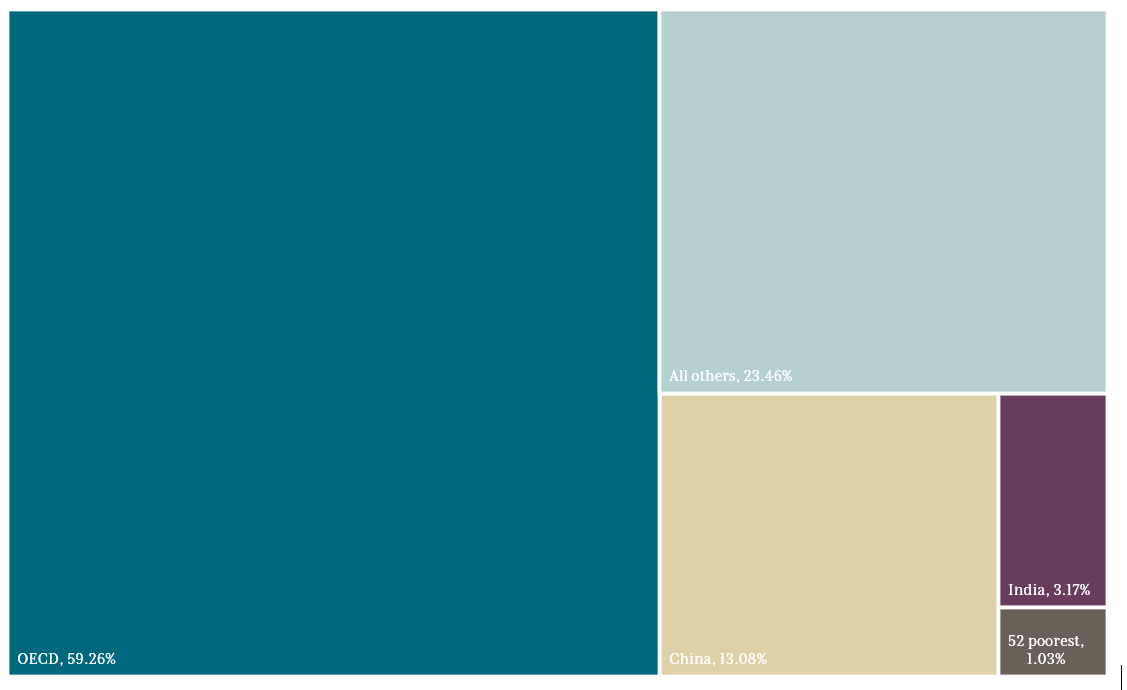
Source: Authors’ calculations using data from Our World in Data
Even in much more recent flow data, it’s clear that absolute and per head emissions are largely concentrated in the OECD countries and China.
Global distribution of annual CO2 emissions (2014)
| Country group | Gigatonnes | Share of world | Per capita (mt) |
|---|---|---|---|
| OECD members | 12.1 | 33.6% | 9.6 |
| China | 10.3 | 28.5% | 7.5 |
| India | 2.2 | 6.2% | 1.7 |
| All others | 10.9 | 30.1% | 5.6 |
| Lowest income countries | 0.6 | 1.6% | 0.4 |
Source: Authors’ analysis of World Bank World Development Indicators
Still, there is concern that if low-income countries grow quickly as we hope towards achieving the Global Goals, this will create a substantial additional source of greenhouse gas emissions.
Growth for 1.4 billion people in 52 countries
We update and build on Stephan Dercon's 2014 paper “Climate Change, Green Growth and Aid Allocation to Poor Countries,” and consider four scenarios for the future of CO2 emissions. In all of them, we assume the poorest 52 countries will grow their incomes to an average of $6,000 per year (adjusted for prices)—still $1,600 below the average for “lower-middle income” countries. This would not eradicate extreme poverty but it would be remarkable progress requiring growth of 6.6 percent per year. For those countries, we look at whether the emission intensity of their economies stays “stable” or “rises” to historically typical levels. For all other countries, we look at two scenarios: one (disappointing one) where emissions remain at current levels, and one (challenging one) where the countries make straight progress towards the goal of net zero in 2050.
The global COVID pandemic will have serious impacts both on economic output and on growth in all parts of the world. It will lower emissions and may make progress to net zero more likely. Our assumptions about economic progress in poorer countries to 2030 look even more optimistic. Our core conclusion—that even if the 52 lowest income countries did grow rapidly, they will not make a major difference to the path of climate change—remains robust.
Projected annual CO2 emissions, assuming net zero by 2050 in all but 52 lowest income countries
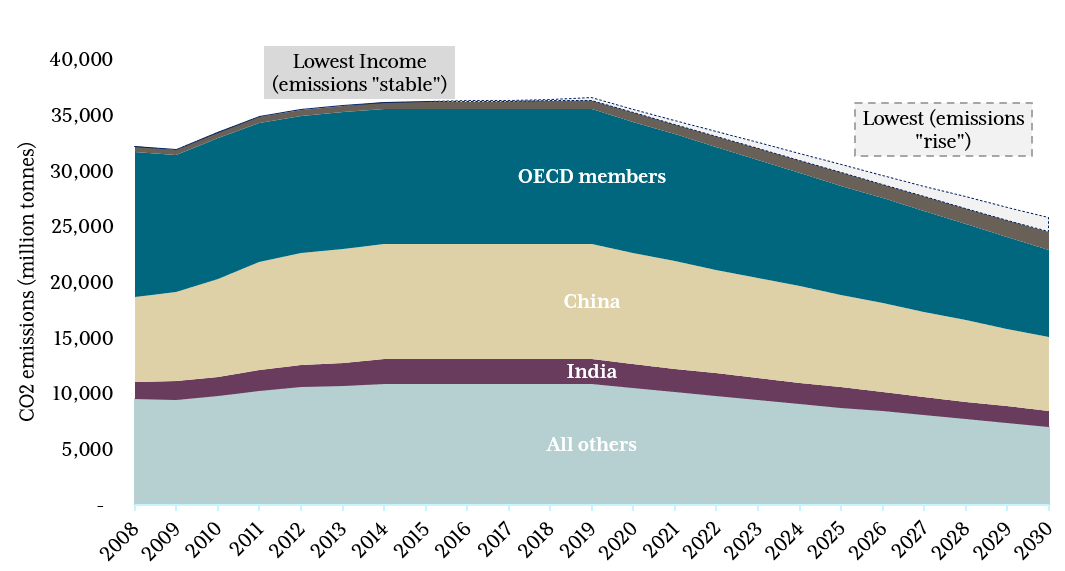
Source: Authors’ projections using World Bank data
The figure shows the results of the scenario where the world (except the 52 poorest countries) makes steady progress from 2014 to net zero emissions in 2050, and the two scenarios for the lowest income 52 (“stable” and “rise” in carbon intensity of growth). In 2030, in the stable scenario, the lowest-income 52 would account for just 6 percent of global emissions, or 11 percent if their emissions intensity rises. Even with full progress towards net zero elsewhere, and rising emissions in the 52 poorest countries, per head emissions in the poorest countries would still be less than a quarter of those in the OECD.
Achieving two sets of global goals
Our simple model shows that even if the poorest countries grow very quickly, different pathways for their emission intensity will have very small effects on whether the world can meet the Paris Agreement’s ambitions for global emissions in 2030.
Whilst there are, and will be, opportunities for these lower-income countries to take advantage of low-carbon technology (not least by avoiding coal), the vast majority of global emissions will remain in countries with higher incomes. This suggests that concerns about growth in emissions in low-income countries could be misplaced, and that efforts to materially reduce emissions will need to be concentrated elsewhere. We’ll be considering what this means for aid and climate finance in future analysis.
Preventing the advance of climate change and coping with its effects are extremely important for the world, and especially for poor countries who will be hit hardest despite having barely contributed to the problem. To prevent the worst effects of climate change, mitigation efforts need to focus on where emissions per head are highest, not on the world’s poorest countries.
We are particularly grateful to Lee Robinson for great advice on our spreadsheet model. All views and any errors remain those of the authors
Topics
DISCLAIMER & PERMISSIONS
CGD's publications reflect the views of the authors, drawing on prior research and experience in their areas of expertise. CGD is a nonpartisan, independent organization and does not take institutional positions. You may use and disseminate CGD's publications under these conditions.