
Recommended
Blog Post
Populist Rhetoric, Poverty Realities
Blog Post
The Great Indian Poverty Debate, 2.0

Blog Post
Is India’s Consumption Really Falling?
India has reduced poverty. But the World Bank’s claim that extreme poverty fell by 90 percent rests on surveys whose redesign makes it hard to be certain about the size of the decline. Estimates from other data sources tell a less dramatic story. And uneven growth, meager wage growth, a beleaguered social safety net, and widespread child malnutrition raise important questions about the credibility of claims of dramatic extreme poverty reduction. The World Bank has done some work to reconcile the surveys underlying its analysis. It should be equally clear about what remains uncertain—and show how much its headline depends on assumptions about measurement.
Since liberalizing its economy in 1991, India has made significant progress in reducing poverty. But I found myself uncharacteristically nonplussed by the claim that extreme poverty—defined as living on less than $3 per person per day in 2021 purchasing power parity terms—in India had fallen to a mere 2.6 percent in 2023, down from 27.1 percent in 2011. And I was particularly surprised to see this estimate in the World Bank’s latest Poverty and Equity Brief.
The scale of the claimed reduction is, of course, consequential for the Modi government. Its ambition of a developed India by 2047—the math behind which I have questioned previously—would gain quite a bit of credibility from the World Bank’s endorsement of a near-elimination of extreme poverty.
It would also be a truly remarkable policy achievement if the world’s most populous country and one of its poorest by income per capita reduced extreme poverty by 90 percent in 12 years, to come within 3 percentage points of eradicating extreme poverty—even as its economic engine has, well, seemingly sputtered. These are extraordinary claims and deserve serious scrutiny. There are two separate questions here. Has poverty fallen substantially? Evidence suggests it has. But does that evidence suggest that extreme poverty has fallen by as much as 90 percent? That is much less clear. The case for a reduction of that magnitude is riddled with questions about comparability and competing narratives from other data sources—and is already receiving some scrutiny.
Let’s start with comparability. The World Bank brief compares consumption data from 2011–12 and 2023–24 waves of the Indian National Sample Survey (NSS). This survey has long been considered a gold-standard example of consumption measurement in low- and middle-income countries. But between the endpoints in the brief, India substantially redesigned its household consumption survey. These changes included expanding an already detailed consumption item list (by about 17 percent), and, perhaps more consequentially, moving from one household visit to three. More detailed consumption lists can improve measurement but also increase recorded consumption without any actual increase in what the poorest households actually consume (incidentally, this work is by researchers in the World Bank’s own research department). And, shorter visits can reduce fatigue and elicit spending that respondents would otherwise omit. In other words, change in survey design can make consumption gains appear larger among the poor, even without corresponding changes in their living standards. The expanded item list and move to three visits could also reinforce each other, with more detailed prompting spread over shorter visits capturing consumption that households would have otherwise omitted. Infrequently purchased foods are particularly susceptible to omission in recall surveys (also a study involving World Bank researchers), providing a plausible mechanism for incorrectly measured increases in consumption. Even if the new survey is more accurate, the issue is that it would exaggerate the decline in poverty compared to an older survey that missed some consumption. The NSS redesign makes it difficult to disentangle real changes in consumption from artifacts of measurement in the absence of a bridge survey.
To be sure, the World Bank has made serious efforts to harmonize the surveys, including recalculating the older baseline using an independently collected 2011–12 sample that used a modified mixed reference period. But harmonizing the variables is a distant second-best to measuring both endpoints consistently. And it certainly could do more, like investigate infrequent food purchases, to document the consequences of the survey design changes. The bank’s own methodology note acknowledges the central limitation: there was no bridge survey to establish the effects of the redesign. It is surprising that the World Bank did not present this uncertainty alongside the headline poverty reduction estimate.
Gaurav Datt has previously raised another concern. First, the World Bank has also reconstructed India’s earlier poverty series by applying the relationship between two consumption recall measures observed in 2011–12 to surveys dating back to 1977–78. This assumes the shape of the relationship remained stable across decades of changing consumption patterns. Second, the bank excludes spending on durable goods, hospitalization, and some other items because richer households spend proportionally more on these items. Datt has argued that the resulting series has substantially changed the picture of historical poverty reduction and the exclusions have yielded lower measured inequality. While this does not necessarily invalidate the decline estimated in this new brief, judging the supposedly historic nature of the decline means scrutinizing the reconstruction of the earlier record, too.
A Spain-sized counting error?
A back-of-the-envelope calculation (BOTEC) illustrates: the reported decline in extreme poverty from 27.1 percent to 2.6 percent coincided with a 74 percent increase in real GDP per capita. This implies a poverty elasticity of about -4.2.* Such a large elasticity is not inherently implausible—while it is larger than historical estimates for India or China, it is comparable to estimates for Brazil. But it does raise the question of what happened across the consumption distribution. Using the World Bank’s own data, holding the shape of the 2011 distribution constant, and applying the measured growth in mean consumption reduces poverty to roughly 6 percent. From here, a measurement-induced uplift of approximately 15 percent around the poverty threshold would be sufficient to bring the extreme poverty rate down to 2.6 percent. Survey design effects of this order are not unheard of, with a randomized survey experiment in Tanzania recording 21 percent higher mean consumption using a detailed recall list versus a truncated one.
However, survey redesign is unlikely to be the entire story. According to the brief, extreme poverty halved from 5.3 percent in 2022–23 to 2.6 percent in 2023-24, while the consumption Gini fell 2.5 points, from 25.5 to 23. (Both rounds used the new survey design, so this isn’t driven by the redesign.) In contrast, the Gini fell 3.3 points over the entire preceding decade. What would explain such a sharp compression of the consumption distribution in one year? Real gains at the bottom, changes in how in-kind benefits are valued, or changes in how well the survey captures better-off households? A one-year change of this size, accounting for much of the most recent extreme poverty decline, deserves further inquiry. So too does the inequality estimate: for instance, recent World Bank research on Nepal shows that switching from consumption to income and correcting for missing top incomes transforms its apparent position from more equal than France to almost as unequal as various Latin American countries—a striking illustration of how much these comparisons depend on what is being measured.
Here’s the scale of the issue. Say if extreme poverty is closer to 6 percent than 2.6, the difference would be an undercount of roughly 50 million people—a measurement “oopsie” of more people than live in Spain or Argentina. This is why it is important to separate real poverty decline from measurement changes.
One attempt to deal with the comparability issue predicts consumption in the later employment surveys using relationships between consumption and household characteristics from the 2011–12 survey. Its estimates put poverty at 16–18 percent in 2022-23, using the Tendulkar line. This is a modeled estimate, but it is a serious effort to address the measurement changes—and the sort of competing evidence that I’d have hoped the World Bank would have engaged with in presenting its more dramatic estimates.
The curious case of the conflicting World Bank estimates
But as in all good Bollywood movies, there is another twist (or a few). India conducted an NSS consumption survey in 2017–18 but did not release the results, citing data quality concerns. Reporting based on the draft survey suggested that real per capita consumption had fallen by 3.7 percent nationally and 8.8 percent in rural areas since 2011–12. Those reports cannot be independently verified without the data, and research published by CGD has questioned whether consumption could have really fallen by quite as much as these reports suggest. Nor would a decline between 2011–12 and 2017–18 rule out subsequent recovery. But withholding the survey leaves us with an apples-to-oranges comparison of endpoints across a major redesign.
The missing 2017–18 survey is not the only reason to question the gradient of India’s poverty reduction. The 2022 version of the World Bank’s flagship Poverty and Shared Prosperity Report estimated 23 and 56 million additional people living in extreme poverty in India during the pandemic.
So, on the one hand, we have a new World Bank brief telling us that Indian extreme poverty fell by 90 percent between 2011-12 and 2023-24. On the other hand, we have reporting from an unreleased round of the same consumption survey potentially suggesting a decrease in consumption between 2011-12 and 2017-18, and the same institution’s flagship report on poverty estimating a meaningful pandemic setback in 2020.
Unbreak my brain, World Bank poverty experts, and please explain how these earlier findings fit with the timing and magnitude of the gains implied by your latest estimates.
What do other data sources tell us about poverty reduction in India?
My colleagues at CGD have long raised concerns about World Bank estimates of Indian poverty numbers. In 2022, a working paper by Roy and van der Weide used private household survey data to document substantial poverty reduction, but meaningfully less than earlier national accounts-based projections suggested. In a CGD blog, Justin Sandefur questioned whether even those consumption gains could be reconciled with falling consumer goods production and rural real wages. Justin’s question remains relevant: How well do the estimated gains fit the other evidence on households’ economic circumstances? (Roy and van der Weide’s paper has since been published in the Journal of Development Economics.)
I am afraid that, at least to me, the answer is “not entirely.” This brings me to the issue of competing narratives. Preliminary findings from the NCAER-University of Maryland India Human Development Survey put poverty at 21.2 percent in 2011–12 and 7.1 percent in 2022–24, using the inflation-adjusted national poverty line, aka the Tendulkar poverty line. The Tendulkar poverty line is lower than the World Bank’s poverty line—approximately INR 53-62 per person per day in 2024 prices, compared with roughly INR 69 for the World Bank’s line, according to my BOTEC.** (Note that the IHDS authors themselves recommend using the NSS to estimate poverty levels, given their survey’s smaller sample and shorter consumption questionnaire. A comparison using a common poverty line and harmonized consumption definitions would be more informative.)
Figure 1: Poverty has fallen, but 4 in 10 remain vulnerable
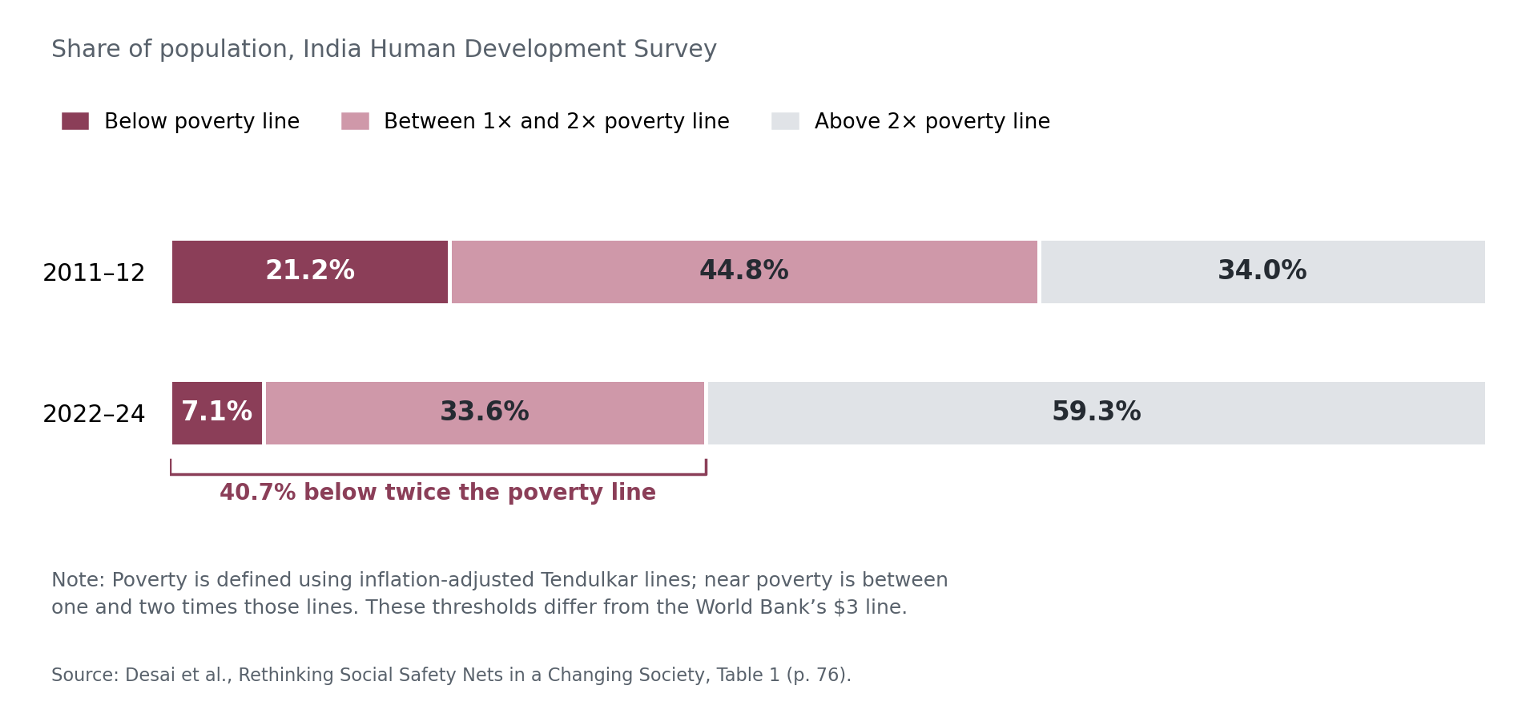
Figure 1 illustrates that the IHDS data also show substantial progress, ruling out a wholesale dismissal of Indian poverty reduction. But they also show 7.1 percent still under the Tendulkar poverty line and another 33.6 percent as “near poor.” Again, this is using a lower threshold than the bank’s and thus is a conservative estimate of the gap (recall again that estimates can range as high as 16–18 percent as discussed above).
What does another way of measuring deprivation suggest?
The evidence on how child nutrition has fared in this period raises other questions. The National Family Health Surveys (NFHS) show real progress on some measures: child stunting fell from 35.5 percent to 29.3 percent, and severe wasting is down from 7.7 percent to 5.2 percent. Severe wasting occurs when extremely inadequate nutrition and disease leave children dangerously thin, weakening their immune systems, and increasing their risk of dying from common childhood infections.
Other measures barely moved. Underweight prevalence currently stands at 31.8 percent, barely below 32.1 percent in 2019-21. The latest NFHS figures also put wasting among children under five at 19.8 percent in 2005-06, 21 percent in 2015-16 and 19 percent in 2023-24.
These measures cannot tell us whether the incidence of extreme poverty is 2.6, 7, or 18 percent. And my own work (with Caitlin Brown and others) shows that child nutrition in India also depends on more than just household consumption. Still, the fact that nearly one in three Indian children under five is stunted or underweight and one in five is wasted should give us pause when we are presented with the suggestion that severe deprivation has largely receded.
What policies would have driven such a dramatic poverty decline?
Look, large reductions in poverty can happen. For instance, Martin Ravallion’s estimate of poverty elasticity (-4.3) in Brazil is comparable to my BOTEC for India here. But falling inequality, stabilization, and an increasingly effective social safety net played important roles there. Social transfers played a key role in prior poverty reduction episodes in India, too. However, the current Indian government’s record on social protection is more uneven than its poverty triumphalism suggests. A parliamentary committee documented inadequate funding, delayed wages, and technological barriers to accessing its public works program, NREGA. Food assistance expanded during the pandemic, but the expansion ended in December 2022 (although households were extended some benefits at a lower price), while the coverage ceiling remained anchored to the 2011 census.
Further, the World Bank’s 2026 Poverty and Shared Prosperity Report points to the role of more and better-paid jobs in driving poverty reduction. If anything, recent Indian wage evidence hardly points to a boom for workers in low-paid occupations. Jean Drèze and Arindam Das use Indian Labour Bureau data to show that between 2014 and 2024, real wages grew by a percent or less annually for agricultural and construction labor, and were essentially stagnant for non-agricultural labor. Still, household incomes can rise if more members work—and there is some evidence of such a channel. But this makes a decomposition exercise more valuable: Which households gained more or better jobs in India in this period? How much did these employment and earning gains contribute to the estimated extreme poverty decline?
I find it hard to reconcile the picture that all these pieces paint of India—mediocre growth, stagnant wages, a struggling safety net, persistently high child malnutrition, and a pandemic that caused a lot of economic pain—with the one painted by the World Bank brief’s story of 90 percent reduction in extreme poverty in a dozen years. What changes in earnings, subsidies, or other transfers explain the measured improvement at the bottom of the distribution, despite these problems? By what other means did these households move out of poverty? And which children experienced these gains if not those who remain stunted, underweight, or wasted?
The questions this raises about the state of research at the World Bank
This is also a question of what the World Bank’s research is for. As Charles Kenny and I have argued, its researchers must be able to challenge client governments and the bank’s own management. We cited the World Bank’s willingness to publish uncomfortable findings on poverty in India during the pandemic as an example of that independence serving the development community. That same rigor should mean that if changes in measurement leave uncertainty about how much poverty has fallen, the bank should clearly present that uncertainty alongside the headline numbers. Equally, the question of how to reconcile these numbers with other data sources and welfare measures deserves a serious answer.
At a minimum, the World Bank could (go beyond my BOTEC to) show how much of the estimated decline comes from growth in mean consumption and how much from changes in its distribution, with and without the consumption exclusions questioned by Datt. It should show how sensitive the headline estimate is to various plausible assumptions about the effects of the survey redesign on measured consumption, how infrequent food purchases changed between the two survey rounds, etc.—along with the sensitivity checks it already reports. It should compare the results with IHDS using a common poverty line and consistent definitions of consumption. And it should present the remaining uncertainty clearly. India’s statistical authorities can help by releasing the 2017-18 NSS round alongside a detailed account of its quality problems.
India’s progress deserves to be measured credibly and accurately. And a knowledge bank’s credibility depends on its willingness to ask difficult questions of its own blockbuster findings.
With thanks to Jed Friedman and Justin Sandefur.
* Here’s my poverty elasticity BOTEC \epsilon=ln(H_2023/H_2011)/ln(y_2023/y_2011)=ln(2.6/27.1)/ln(1.74)=-4.23
**Here’s my Tendulkar-to-World Bank (WB) poverty line BOTEC: I converted the WB’s poverty threshold from 2021 prices to 2024 price multiplying the WB’s poverty threshold in 2021 (INR 58/USD 3 per person per day) by the WB’s own estimates of Indian inflation for each of the intervening years (2022, 2023, 2024): 58 × 1.0670 × 1.0565 × 1.0495 =INR 68.62. Multiplying by 365/12 gives approximately INR 2,087 per person per month. The Tendulkar poverty line is INR 1600–1900 per person per month.
Topics
DISCLAIMER & PERMISSIONS
CGD's publications reflect the views of the authors, drawing on prior research and experience in their areas of expertise. CGD is a nonpartisan, independent organization and does not take institutional positions. You may use and disseminate CGD's publications under these conditions.