Recommended
Blog Post
USAID Cuts: New Estimates at the Country Level
Blog Post
Update on Lives Lost from USAID Cuts
Blog Post
How Many Lives Does US Foreign Aid Save?
We now have full fiscal year 2025 (FY2025) data for sectoral- and country-level spending administered by USAID (from October 1, 2024, to September 3, 2025). The data cover the last three months of the Biden administration and the first nine months of the Trump administration. Compared to FY2024, the aggregate picture is of a 23 percent decline in spending (outlays) and a 43 percent decline in commitments to future spending (obligations). The largest absolute sectoral decline is in humanitarian support, where spending fell from $8.0 billion in 2024 to $5.8 billion in 2025 and obligations fell from $9.2 billion to $3.5 billion. That is reflected in spending collapses in several countries facing humanitarian crises.
Note that the USAID data exclude some significant foreign assistance spending through the State Department for migration and refugees, the Centers for Disease Control and Prevention (CDC) for HIV/AIDS, and the Department of Agriculture for food aid. The data for the full fiscal year from ForeignAssistance.gov are not yet available in these cases.
Health and humanitarian aid were not spared
Looking at the USAID data, “Protection, Assistance and Solutions”—aka, humanitarian support—is historically the largest sectoral category, and it saw sharply reduced spending: a 27 percent decline in outlays and a 62 percent decline in obligations. According to USAspending.gov, the State Department Migration and Refugee Assistance account (not included in this analysis) also saw outlays decline from $4.6 billion in FY2024 to $3.2 billion in FY2025 and obligations fall from $5.7 billion to $2.9 billion. Other budgetarily significant sectors that saw USAID obligations decline by more than 50 percent include private sector, governance, agriculture, and basic education (Figure 1 and Table 1).
HIV/AIDS saw a 34 percent decline in outlays, consistent with evidence of significant disruption to service provision in the middle quarters of FY2025, which were thankfully largely reversed by the end of the fiscal year. Other global health categories, including maternal and child health, nutrition, malaria, and tuberculosis, saw smaller but significant declines in outlays and minimal cuts or even increases in obligations.
Figure 1. USAID spending by sector, FY2024-FY2025 in US$ millions (log scale)
At the country level (Figure 2 and Table 2), the dramatic decline in humanitarian support is reflected in far lower flows to countries including Yemen, the Democratic Republic of the Congo (DRC), South Sudan, and Somalia, which all saw spending cuts exceeding 40 percent and obligations drop more than 60 percent. Obligations to Afghanistan fell from $743 million in FY2024 to a negative amount in FY2025, reflecting previously promised funding being withdrawn.
Figure 2. USAID spending cuts by country, FY2024-FY2025 (% cut)
Cuts to outlays were somewhat smaller than we predicted a year ago, but cuts to new obligations were somewhat bigger
In March 2025, we published estimates of cuts to USAID sector and country-level programs based on a leaked list of documents covering (many but not all) USAID awards the administration intended to cancel or retain, and using obligations made to those awards in FY2024 and early FY2025 to calculate the percentage of awards by this value that had been cut. Our estimates are presented in the last column of Tables 1 and 2 as “SK predict.”
The estimates should not be expected to match the actual FY2025 data. The FY2025 data include roughly three months of outlays and obligations from before the contract and award cancellations—on an equal-yearly-spend, this suggests about a 75 percent maximum cut for the impact of the cancellations on outlays and obligations. In addition, the estimates were based on previous obligation data as a proxy and are therefore subject to error.
With these caveats, it is interesting to note that the aggregate estimate we made was for a 38 percent cut, compared to a 23 percent actual cut in outlays and a 43 percent cut in obligations. Nonetheless, there is a weak link between cancellations as measured in March 2025 and FY2025 outlays, and (only) a somewhat stronger link between cancellation estimates and FY 2025 obligations. That will reflect:
- Subsequent reversals of cancellation decisions alongside significant new obligations to contracts, thanks in part to Congressional pressure in areas including maternal and child health (leading to higher outlays and obligations).
- A significant gap between “intent to cancel” and actual cancellation, and that cancellation itself can involve significant payments under contract terms (leading to higher outlays and obligations).
- Particularly regarding humanitarian awards, these are often shorter-term, responding to emergencies, and have suffered from breakdowns in the process of making new awards (leading to lower outlays and obligations). Thankfully, there is recent evidence of some pickup in humanitarian award delivery.
Figure 3. Predicted versus actual cut to USAID, FY2024-2025 (US$ millions)
What does this mean in terms of lives lost?
We previously used the sectoral cut estimates to predict potential mortality from the cuts. A naïve reading of the actual FY2025 outlay data would suggest considerably lower-than-forecast mortality from malaria, maternal and child health, and higher-than-forecast mortality from humanitarian and HIV/AIDS cuts. However, USAID data do not reflect the full spending picture for HIV/AIDS, and recent data suggest recovery of some of the most immediately life-saving interventions. As a result, updating mortality estimates using the same approach would have limited value.
Looking at HIV/AIDS in particular, in the second quarter of FY2025, as many as 3.7 million people may have lost antiretroviral (ARV) coverage under PEPFAR-supported programs. But by the end of FY2025, coverage was broadly back to FY2024 levels. We have not seen the same recovery in spending (Figure 4). Total global health outlays under the State Department account that funded both USAID and CDC’s PEPFAR work were $3,797 million in the second half of FY2025, compared to $5,816 million in the second half of FY2024. Among explanations for this disconnect:
- With a reduced budget, PEPFAR has prioritized antiretroviral drugs and their delivery. Other activities have declined, including treatment initiation, testing (which saw a decline of 14 million tests last year), and staffing (which saw a 22 percent reduction). (The antiretroviral drugs themselves have become a comparatively small part of overall costs. For example, in Uganda in 2022, ARVs accounted for 16 percent of HIV program costs and 8 percent of direct PEPFAR costs.) If continued, the declines in staffing, testing, and enrollment will have a significant impact on coverage, especially of harder-to-reach communities (including adolescent girls) and future mortality and morbidity.
- Recipient governments (in particular South Africa) have stepped up to cover some of the services that PEPFAR has dropped (governments may also have redirected staff from other services), but across countries, the financial response has been both delayed and limited.
- Some providers may have been spending down money or resources disbursed before the full force of the cuts took effect—outlays have always been subject to considerable quarterly fluctuation. That suggests slack in the delivery system to keep services operational, but that slack may have been used up.
Figure 4. USAID HIV/AIDS spending versus PEPFAR antiretroviral therapy coverage within-fiscal-year change from prior Q4
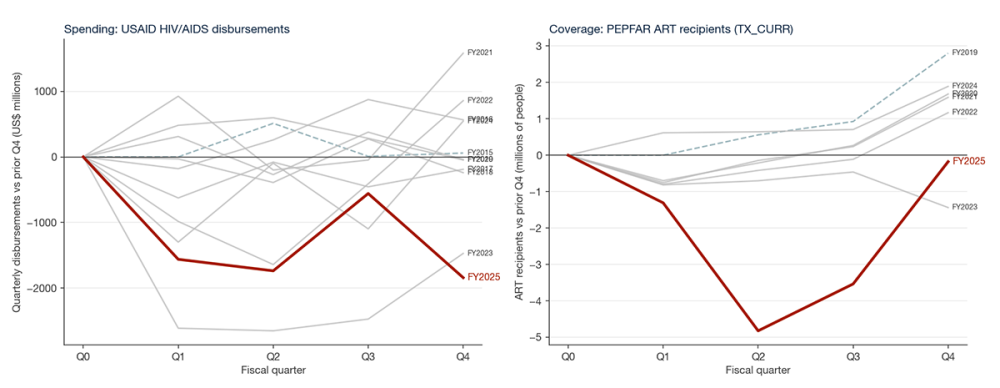
Note: Some of the fluctuation in reported ART coverage is driven by under-reporting and reporting discrepancies.
The combination of the new spending data and the additional available information on delivery suggests that the overall mortality impact in FY2025 at least, is likely to be much lower than implied by our earlier forecast, with the potential (and possibly considerable) exception of mortality in humanitarian settings. There is also reason for concern for the future regarding the sustainability and impact of service provision around HIV/AIDS.
Table 1. Sectoral-level cuts in FY2024 and FY2025
| Disbursements | Obligations | SK Predict | |||||
|---|---|---|---|---|---|---|---|
| 2024 | 2025 | % cut | 2024 | 2025 | % cut | % cut | |
| Protection/ assistance | 7,993 | 5,817 | 27 | 9,152 | 3,483 | 62 | 13 |
| Macroeconomic/growth | 5,368 | 5,228 | 3 | 5,574 | 5,078 | 9 | 12 |
| HIV/AIDS | 4,656 | 3,085 | 34 | 5,250 | 2,900 | 45 | 20 |
| Direct Administrative Costs | 3,842 | 2,925 | 24 | 3,864 | 2,370 | 39 | 94 |
| Agriculture | 1,152 | 855 | 26 | 1,161 | 363 | 69 | 81 |
| Malaria | 904 | 738 | 18 | 863 | 1,244 | -44 | 36 |
| Maternal and child health | 893 | 672 | 25 | 893 | 794 | 11 | 92 |
| Basic education | 785 | 528 | 33 | 833 | 364 | 56 | 99 |
| Good governance | 752 | 491 | 35 | 839 | 278 | 67 | 97 |
| Disaster readiness | 622 | 472 | 24 | 681 | 105 | 85 | 43 |
| Private sector comp | 600 | 441 | 27 | 715 | 148 | 79 | 100 |
| Family planning and reproductive health | 525 | 335 | 36 | 515 | 278 | 46 | 94 |
| Pandemic /emerging threats | 491 | 606 | -23 | 747 | 590 | 21 | 84 |
| Infrastructure | 485 | 468 | 3 | 872 | 540 | 38 | 100 |
| Nutrition | 448 | 289 | 35 | 450 | 409 | 9 | 39 |
| Rule of law and human rights | 418 | 280 | 33 | 409 | 208 | 49 | 85 |
| Conflict mitigation | 415 | 232 | 44 | 303 | 134 | 56 | 99 |
| Civil society | 414 | 262 | 37 | 386 | 107 | 72 | 100 |
| Water supply and sanitation | 399 | 344 | 14 | 447 | 148 | 67 | 86 |
| Tuberculosis | 349 | 249 | 29 | 365 | 424 | -16 | 56 |
| Other public health threats | 210 | 150 | 29 | 262 | 72 | 73 | 64 |
| Higher education | 190 | 139 | 27 | 230 | 132 | 43 | 96 |
| Political competition | 179 | 103 | 43 | 182 | 51 | 72 | 96 |
| Policies and regulations | 153 | 77 | 50 | 109 | 36 | 67 | 88 |
| Trade and investment | 130 | 104 | 20 | 217 | 48 | 78 | 87 |
| Other | 107 | 78 | 28 | 120 | 16 | 86 | 96 |
| Total | 32,482 | 24,968 | 23 | 35,439 | 20,322 | 43 | 38 |
Table 2. Country-level cuts in FY2024-FY2025
| Disbursements | Obligations | SK Predict | |||||
|---|---|---|---|---|---|---|---|
| 2024 | 2025 | % cut | 2024 | 2025 | % cut | % cut | |
| Ukraine | 5,413 | 5,215 | 4 | 6,053 | 4,693 | 22 | 15 |
| Jordan | 1,236 | 1,173 | 5 | 1,306 | 1,164 | 11 | 61 |
| Ethiopia | 1,202 | 838 | 30 | 1,209 | 743 | 39 | 30 |
| DRC | 1,196 | 693 | 42 | 1,343 | 428 | 68 | 34 |
| South Sudan | 786 | 466 | 41 | 705 | 251 | 64 | 8 |
| Somalia | 757 | 388 | 49 | 474 | 180 | 62 | 22 |
| Nigeria | 739 | 598 | 19 | 763 | 519 | 32 | 23 |
| Sudan | 671 | 696 | -4 | 791 | 543 | 31 | 8 |
| Yemen | 622 | 265 | 57 | 753 | 45 | 94 | 15 |
| Kenya | 601 | 480 | 20 | 630 | 386 | 39 | 46 |
| Afghanistan | 597 | 427 | 28 | 743 | -5 | 100 | 36 |
| Syria | 568 | 350 | 38 | 512 | 166 | 68 | 13 |
| Mozambique | 546 | 381 | 30 | 586 | 332 | 43 | 47 |
| Uganda | 406 | 360 | 11 | 510 | 368 | 28 | 66 |
| Colombia | 385 | 237 | 38 | 261 | 192 | 26 | 82 |
| Bangladesh | 372 | 289 | 22 | 448 | 310 | 31 | 56 |
| Zambia | 346 | 266 | 23 | 409 | 252 | 38 | 59 |
| Tanzania | 334 | 306 | 9 | 438 | 319 | 27 | 38 |
| Haiti | 318 | 248 | 22 | 417 | 218 | 48 | 50 |
| South Africa | 285 | 186 | 35 | 318 | 151 | 53 | 89 |
| Malawi | 285 | 208 | 27 | 274 | 229 | 17 | 64 |
| Zimbabwe | 270 | 241 | 11 | 359 | 100 | 72 | 35 |
| Mali | 249 | 208 | 17 | 300 | 136 | 55 | 66 |
| Palestine | 248 | 481 | -94 | 918 | 549 | 40 | 29 |
| Lebanon | 225 | 177 | 21 | 220 | 245 | -11 | 29 |
| Niger | 225 | 179 | 20 | 263 | 100 | 62 | 34 |
| Burma | 224 | 186 | 17 | 238 | 77 | 68 | 34 |
| Burkina Faso | 219 | 208 | 5 | 314 | 189 | 40 | 18 |
| Pakistan | 208 | 86 | 59 | 116 | 99 | 15 | 85 |
| Madagascar | 201 | 111 | 45 | 191 | 77 | 60 | 54 |
| Egypt | 200 | 176 | 12 | 215 | 182 | 15 | 84 |
| World | 32,482 | 24,968 | 23 | 35,439 | 20,322 | 43 | 38 |
Topics
DISCLAIMER & PERMISSIONS
CGD's publications reflect the views of the authors, drawing on prior research and experience in their areas of expertise. CGD is a nonpartisan, independent organization and does not take institutional positions. You may use and disseminate CGD's publications under these conditions.
Thumbnail image by: USAID in Africa/ Flickr