Recommended


Recent discussions on climate finance have primarily focused on who should pay and how much, with less attention given to impact or effectiveness. But we’ve shown before that the effectiveness of climate finance can be questioned, and have urged a greater focus on quality, not just quantity. This is even more important with growing pressure on official development assistance (ODA) budgets. The new collective quantified goal agreed in Baku last November was disappointing, but it does at least “recognize the importance of … the impacts, results and outcomes of climate finance” (para.30). In this blog, we look at how the UK reports the results of its international climate finance, what it tells us about climate finance effectiveness, and how this reporting could be improved.
We find that the UK’s efforts to measure and report climate finance results are comprehensive, and results appear to improve over time. However, the government does not report the amount spent on achieving these results, making it difficult to assess effectiveness and value for money. We urge the government to include spending levels and project-level results to encourage analysis of the best ways to tackle climate. We also recommend a more concerted and coordinated approach across donors to assessing the impact and effectiveness of climate finance spend.
Reporting results of UK climate investments
UK International Climate Finance (ICF) was launched in 2011 with commitments amounting to £3.9 billion from 2011/12 to 2015/16 (ICF1), £5.8 billion from 2016/17 to 2020/21 (ICF2), and £11.6 billion from 2021/22 to 2025/26 (ICF3). All UK ICF is ODA. For programmes where climate mitigation and/or adaptation is the principal objective, typically 100 percent of programme costs will be counted as ICF. For others, where climate is a significant but not the principal objective, it will be less, recently averaging around 50 percent. For a programme to qualify (in full or in part) as ICF, it should include at least one ICF key performance indicator (KPI) in its objectives and expected results.
The UK government monitors ICF results as part of its commitment to understanding and measuring the impact of its investments. It has produced an annual ICF results publication since at least 2016, reporting what ICF investments have achieved against these KPIs. The initial set of six KPIs have evolved; there are now 15 indicators, or 17 given that two have two components: 12 standard KPIs and five technical assistance (TA) KPIs, which were first published in 2023 (see table below).
Each year’s publication reports cumulative results achieved since 2011 across all ICF programmes for each KPI, as well as total expected programme benefits against each KPI (as many of these programmes will continue to deliver further benefits into the future, including after they have ended).
An annual results collection exercise (run over the period March to September) requires programme managers to report against each KPI addressed by their programme. Detailed methodological notes provide guidance on how this should be done, and results are quality assured centrally before aggregation and publication in the annual ICF results report, typically published in October.
The annual results publication has grown from four pages in 2016, to 14 pages in 2021 (when it was still limited to the six main KPIs), to over 40 pages in 2022 (when additional KPIs were first included in the report) and over 90 pages in 2024, with results increasingly disaggregated by sex, age, disability, and geography. In addition, downloadable spreadsheets containing cumulative results (but not annual or total expected results) for the standard KPIs have been published since 2022, with the TA KPIs added in 2023.
Table 1. Cumulative ICF results achieved from April 2011 to March 2024
Notes: Figures are cumulative results since 2011/12 until the year given in each column, except for KPI 15 where figures only relate to the year in column heading (see also note ^ below), and for penultimate column, which presents total expected results as reported in latest (2024) annual results publication. The six core KPIs that were the focus of the annual results publication until 2020/21 are KPI 1, 2.1, 6, 7, 11 and 12 (highlighted). All figures greater than 10,000 have been rounded down to the nearest whole thousand. Data for most KPIs are sourced from the data file for the period 2011/12-2023/24 (and incorporate any revisions to historical figures). The exceptions are: (i) ^ KPI 15, which reports the % of programmes in that year (not cumulatively) that were scored in one of the top two points on a five-point scale, and was derived from two separate online data files covering (a) the period 2011/12-2021/22, and (b) 2022/23-2023/24 (when the methodology was changed from a 0-4 to a 1-5 scale with some changes in definition, so the data are not strictly comparable); (ii) TA KPI 01, which is not provided in any downloadable file but has been extracted from individual annual results publications. Our analysis is available on request.
What do they tell us?
A few points are worth highlighting:
First, there has been a substantial increase in cumulative results achieved across the board. Annual results achieved (estimated by subtracting the previous year's cumulative total from each year's cumulative total) have also increased over each ICF period for almost all KPIs, often significantly so, as ICF spend has risen. However, there has been some reduction in the ICF3 period for KPIs 1 and 4 (and 10, although with only three programmes reporting this can be discounted), which may suggest a reduced focus on adaptation and resilience in recent years. Estimating cost effectiveness metrics, however, is not possible (see below). It should also be noted that ICF results publications caution against inferring annual results in this way due to data lags, nonaligned reporting cycles, and revisions to previous years.
Second, a comparison of these latest figures (drawn from the most recent report and data files published in October 2024) with earlier results publications reveals that previously reported figures are invariably revised, typically by 5-10 percent though sometimes by more than 50 percent (particularly for earlier years, with revisions largest for KPIs 6,7,11, and 12). Figures on mobilised finance (KPIs 11 and 12) are typically revised downwards, while those on numbers of people supported to adapt to climate change (KPI 1) are typically revised upwards, with other KPIs more mixed. This illustrates the difficulties of accurately reporting results in real time and suggests that each year’s results should be treated with caution.
Third, total expected results (final two columns in table above) are significantly larger than cumulative results to date: most are around twice as large, and some are many multiples higher as benefits are expected far into the future. This is especially the case with those covering ecosystems (KPIs 8 and 10), sustainable management practices (KPI 17), and emissions reductions (KPI 6). Yet it is these estimates of expected results around which there is most uncertainty, with important implications for how effectiveness and value for money might be assessed.
Fourth, the result publications also report the number of programmes reporting against each KPI and (in most years), the total number of programmes reporting. These have increased substantially, with the total number of programmes reporting ICF results up from almost 200 in 2015/16 to 350 in 2023/24. Many programmes report against more than one indicator, with an average of about two per programme: in 2023/24, the sum of the number of programmes reporting against each KPI was 729, with 466 for the six core KPIs alone.
Are they any good?
The ICF results publications provide an increasingly systematic and comprehensive compilation of key results achieved with UK ICF that allows consistent tracking over time. The methodological guidance notes and the quality assurance process underpinning them appear pretty rigorous (although the “expected results” are subject to much greater uncertainty and lighter review), and the publications arguably represent a more complete and transparent set of results than for other areas of UK development spend. They certainly represent (as intended) a useful tool for understanding developments in the portfolio and communicating results, and compare favourably with the outputs of other cross-government ODA funds and most other bilateral climate finance providers (as noted in the Independent Commission for Aid Impact (ICAI) review of 2019, with the results publications significantly enhanced since then).
However, there are a number of limitations:
First, large though some of the results may seem, it is hard to judge whether numbers are big or small or represent good value for money. Unit costs and effectiveness of spend cannot be quantified because no financial information is provided. In principle, such information could be accessed through DevTracker (the annual publication has since 2022 listed all projects that have ever reported ICF results), but attempts to estimate unit costs per KPI would still be difficult, if not impossible, because the specific contribution of individual projects to each KPI are not reported. Even with that information, it would be difficult because project costs are rarely allocated to specific KPIs in project documentation (though that problem may be fixable in time).
Second, the annual results publication is primarily used for transparency and communications purposes, rather than for informing programme identification and design or improving effectiveness of climate finance spend. This point was highlighted in the 2019 ICAI review and remains a challenge. Other tools and analysis are required. The UK government does have a separate cross-departmental ICF monitoring, evaluation, and learning (MEL) programme that is designed to help maximise impact and value for money of ICF. Three independent evaluations were conducted for example between 2018 and 2020 to address evidence gaps related to ICF policy and strategy, specifically on ICF integration, mobilising private finance and support for policy change, with a separate synthesis of learning from DESNZ ICF programmes in 2023. Other work has sought to review evidence to identify “best buy” mitigation and adaptation programmes (conducted in 2019 but not externally published or updated), but none of these have really analysed or used the ICF KPI data. Further work under a new MEL programme is currently being planned, including wider portfolio reviews of impact.
Third, ICF results are not official statistics and not subject to the same standards of rigour. So despite laudable attempts to improve their consistency and quality, questions remain about the independence and credibility of the reported results, especially given the limited number of independent programme evaluations and the incentives created by using the results publication as a communications and PR tool. The 2024 ICAI review of the ICF notes that the ICF KPIs are scored internally by departments responsible for spending (although some are assessed by external consultants and delivery partners), and have never been subject to external review.
Conclusions and next steps
There is much to like about the annual UK ICF results publication and the UK deserves credit for continuing to lead on this agenda. But it could still be improved in two key ways:
- Including additional information on financial spend. This would provide some indication of progress against the UK’s ICF commitments and set the results into some financial context, although fuller analysis of effectiveness and value for money would probably require separate analysis and reporting.
- Publishing online the project-specific data that underpins the publication. This would enhance transparency and enable further external analysis to help with lesson learning. ICAI’s follow up review of its 2018/19 reports noted that the government had indicated that an Excel database of ICF projects would soon be made publicly available, but so far this has only been published (since 2022) in the form of a list of qualifying projects with DevTracker programme ID.
A more concerted and coordinated approach to assessing the impact and effectiveness of climate finance spend is needed. The UK’s annual results contribution is a helpful contribution to this. But deeper analysis that goes beyond simply reporting results is needed. Developing and sharing methodologies to do this would be an important next step. In addition, much greater investment in impact evaluations is required given the dearth of existing evidence relative to other areas of development spend.
CGD is embarking on new work that aims to place value for money at the centre of bilateral and multilateral climate finance allocation and spending decisions. We will be publishing more analysis over the next 18 months and welcome suggestions from interested parties on taking this forward.
DISCLAIMER & PERMISSIONS
CGD's publications reflect the views of the authors, drawing on prior research and experience in their areas of expertise. CGD is a nonpartisan, independent organization and does not take institutional positions. You may use and disseminate CGD's publications under these conditions.
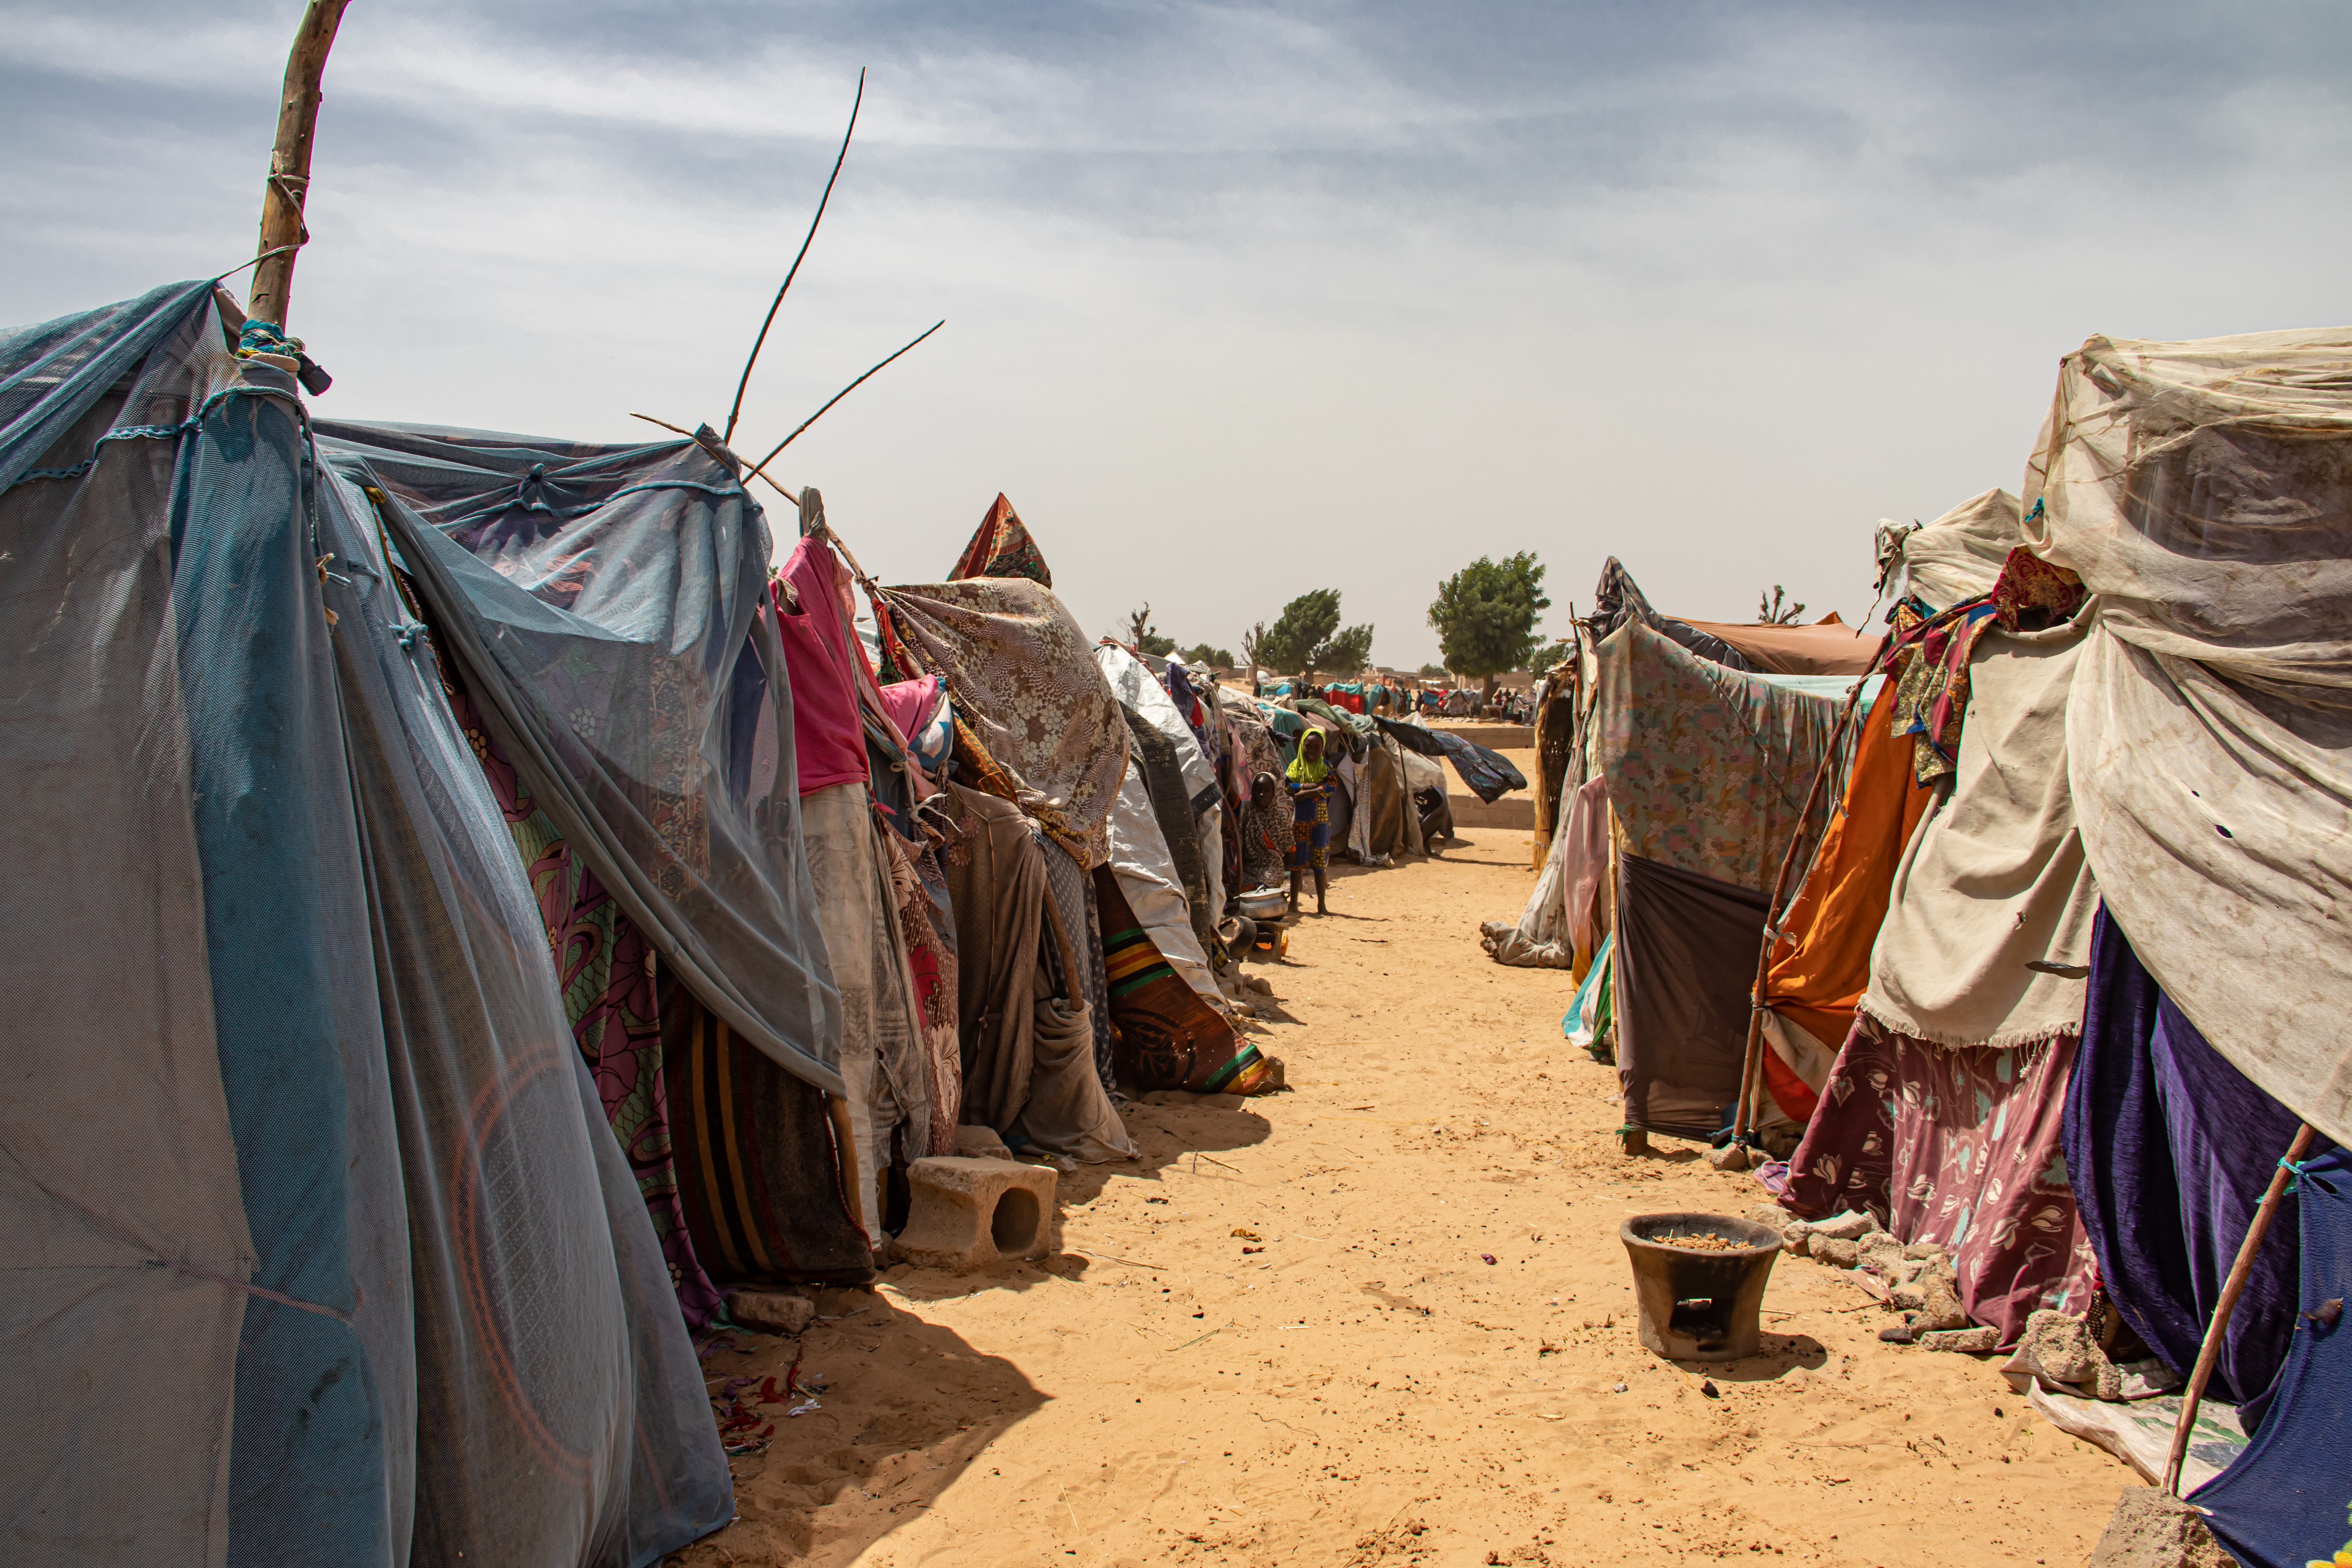
Thumbnail image by: Abbie Trayler-Smith/Panos Pictures/DFID