Recommended
Event
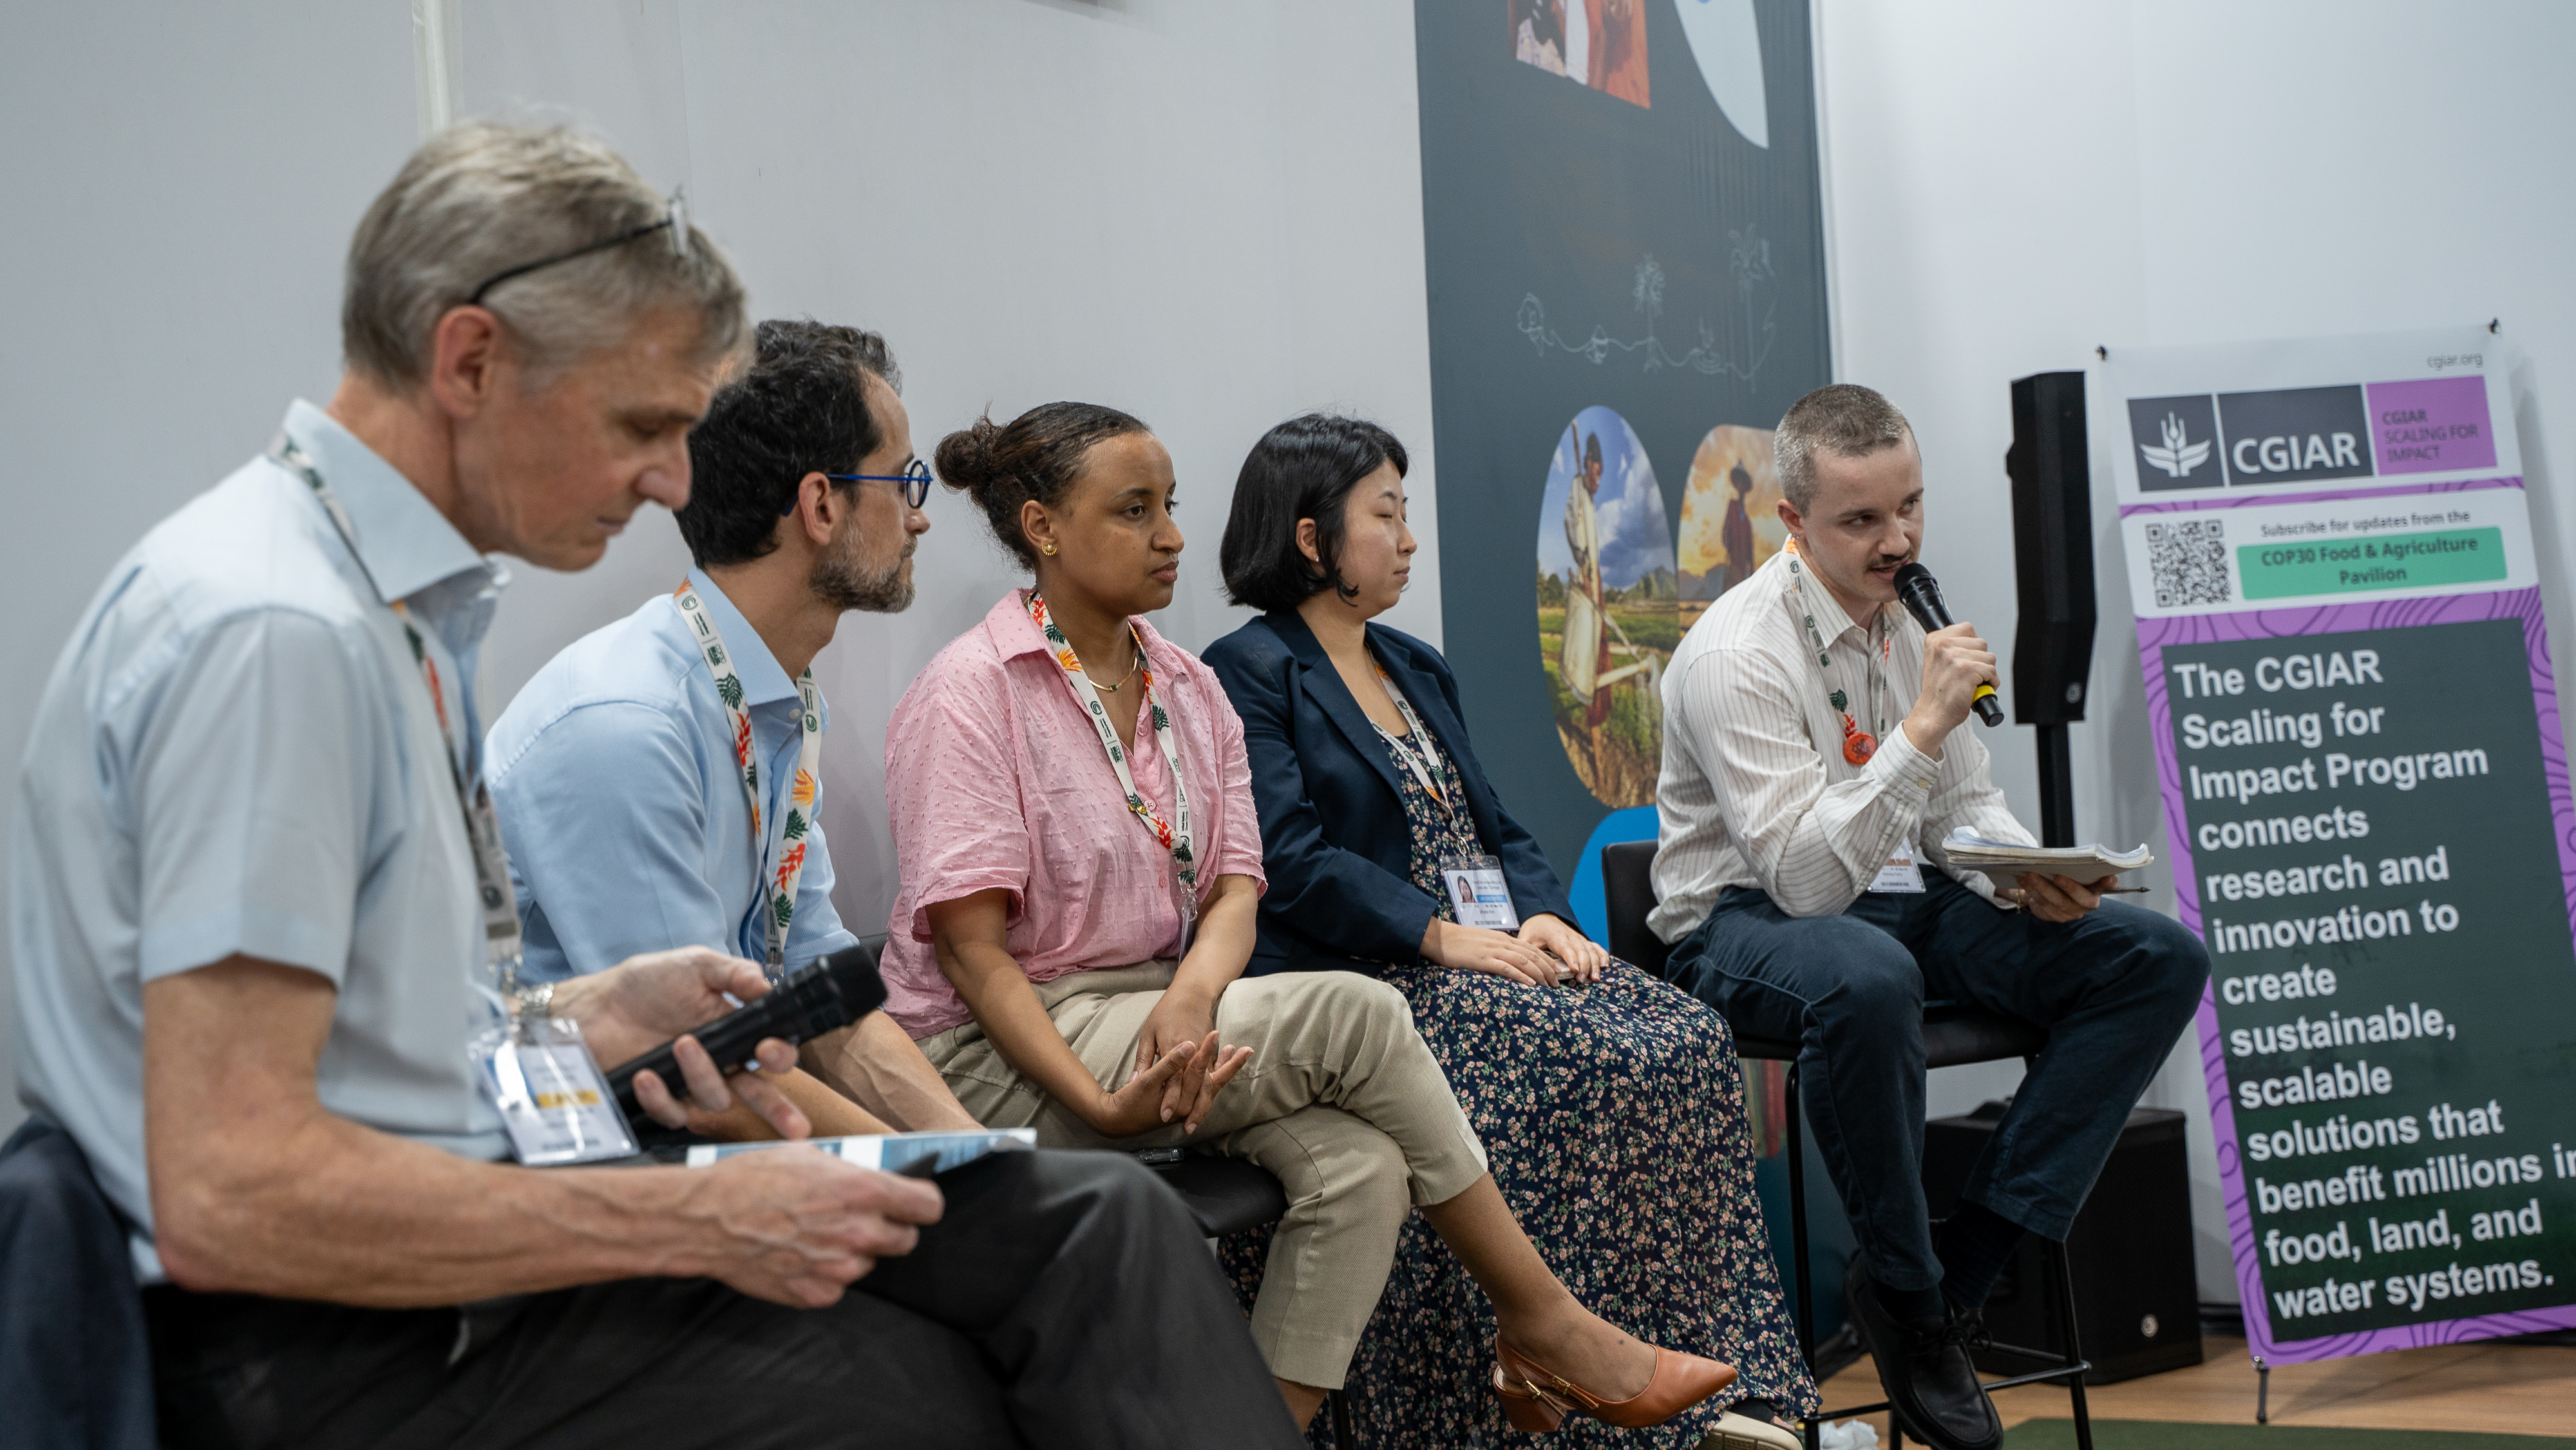
COP30 Event: Who Counts as Vulnerable? Rethinking Climate Finance Allocations
HYBRID
November 13, 2025 3:00—4:00 PM ET | 5:00 - 6:00 PM BRT Local Time Belém | 8:00—9:00 PM GMT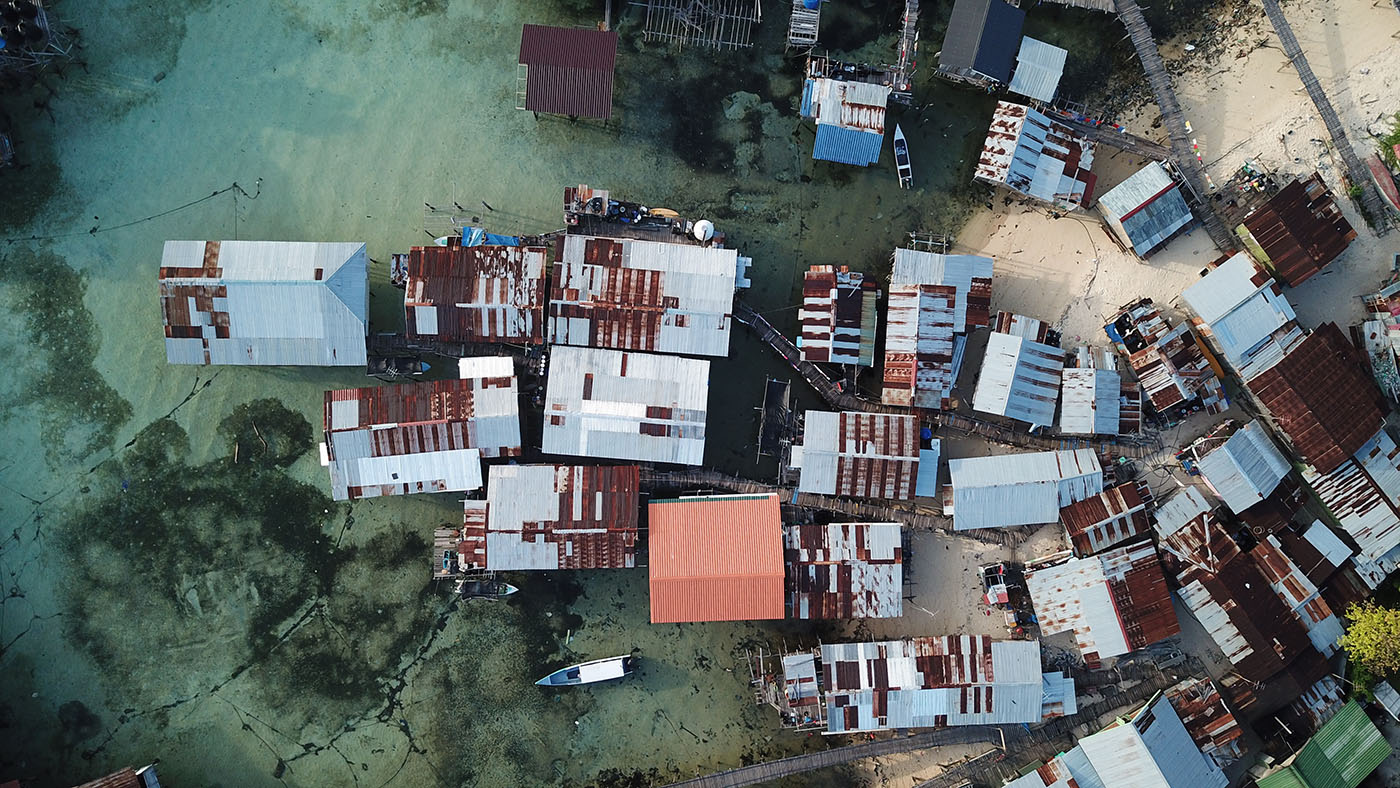
As the world gears up for what’s being billed as the “adaptation COP,” attention will again focus on the needs and priorities of those “particularly vulnerable to the adverse effects of climate change.” But who are they? In a new working paper, I find that existing vulnerability indices offer wildly different answers to this question.
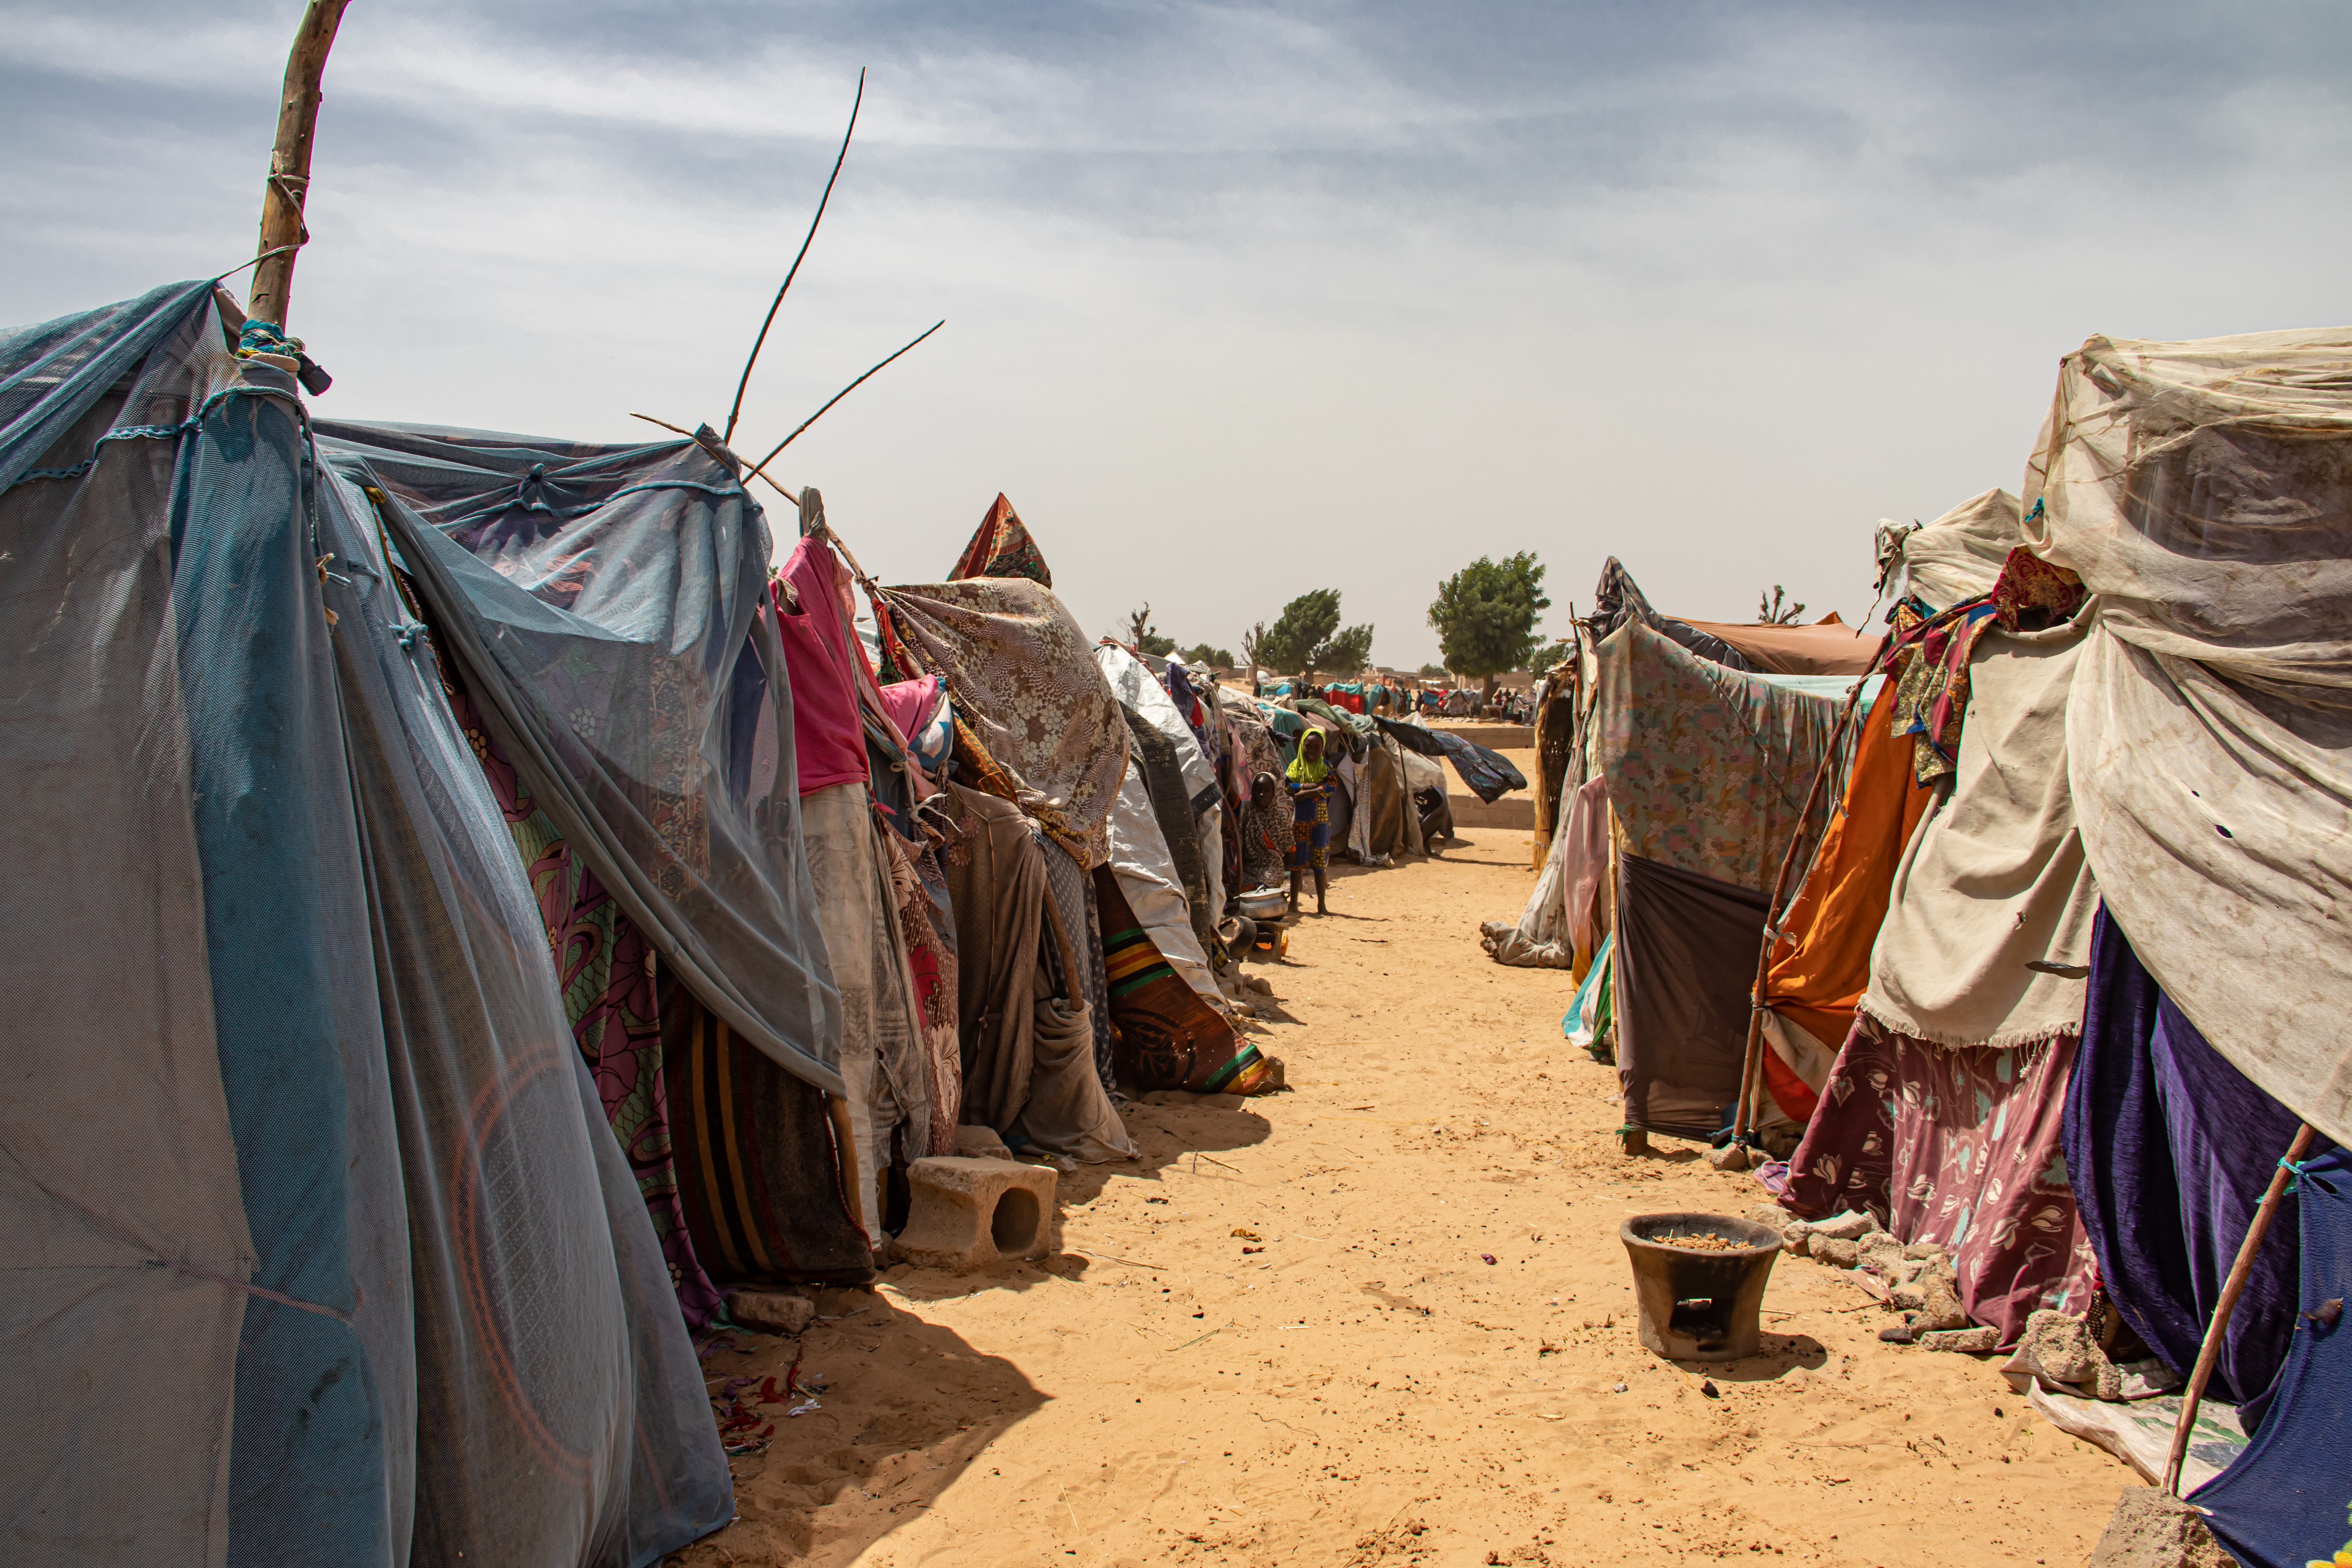
Climate agreements highlight both least developed countries (LDCs) and small island developing states (SIDS). SIDS tend to attract a lot of attention because of their obvious vulnerability to rising sea levels and tropical cyclones. Hurricane Melissa is just the latest reminder of that. But my analysis shows that, in fact, on average, SIDS rank in the bottom half of the indices on vulnerability, and LDCs appear to be the more vulnerable group.
The allocation of adaptation finance, however, is extremely unequal, ranging from less than $1 to over $2400 per person per year, with SIDS attracting by far the most per capita. More attention therefore needs to be given to LDCs when it comes to adaptation financing, although SIDS may need different forms of support, and different allocation rules are needed for loss and damage.
What do vulnerability indices say?
A number of indices have been developed to try and assess countries’ vulnerability to climate change. In my paper, I consider five of the best known (ND-GAIN, WRI, INFORM CC, MVI and PVCCI, each made up of dozens of individual indicators). I compare them at three different levels: overall risk, vulnerability, and exposure. Exposure tends to focus on the physical characteristics of climate change; vulnerability captures how sensitive a system is to those changes and, in some cases, its ability to adapt (though it can also include some exposure indicators); and overall risk tends to combine both exposure and vulnerability and may also include wider governance and institutional measures that influence a country’s ability to cope. (One index, PVCCI, measures exposure only).
The key finding is that the indices often disagree—showing little consistency across all three levels, and especially when measuring exposure to climate change. Across the 140 developing countries that appear in all five indices, there is very little overlap in which countries are judged most at risk. Just two (Somalia and Yemen) feature in the top quartile (i.e. ranked in the top 35) in all indices for overall risk, four (Chad, Niger, Somalia and Sudan) for vulnerability, and just one (Somalia) for exposure indices. They are all LDCs. None of them are SIDS.
Much of the explanation for this variability lies in the different composition and structure of each index, and the considerable variation in indicator selection at each level across all indices. This reflects differing objectives and areas of focus. The MVI for example is explicitly designed to reflect the wider set of vulnerabilities faced by SIDS and their needs for concessional support that are not captured by measures of per capita income, although there are still significant differences even when they purport to be measuring very similar indicators. But it’s not obvious that one is objectively better or worse than the others, and highlights just how difficult it is to draw conclusions based on one index.
The other key finding is that LDCs appear to be more concentrated amongst the most vulnerable than SIDS across the indices. More than half of all LDCs fall in the top quartile group of countries when looking at overall risk (51 percent) and vulnerability (58 percent), and well over a third (36 percent) at the level of exposure, when using a normalised average of our selected indices. The figures for SIDS are 8, 11 and 22 percent, respectively. For numbers of people (as opposed to numbers of countries), the concentration is even more extreme: three-quarters (75 percent) of all people living in LDCs live in top quartile countries for overall risk and vulnerability, and 48 percent for exposure. The figures for SIDS are 34, 22 and 41 percent, respectively. In fact, the average index suggests that at least half of all SIDS are ranked in the bottom half (least vulnerable) at all three levels, for both countries and people, although the picture is more variable when looking at individual indices (with only about half suggesting that most SIDS fall in the bottom half, see Table). The working paper also presents information for Africa, low-income countries, and the V20 group of vulnerable countries.
Percentage share of LDC and SIDS countries and populations that fall in the top quartile and half of rankings for each index, and for the normalised average of all indices
| OVERALL RISK INDICES | VULNERABILITY INDICES | EXPOSURE INDICES | ||||||||||||||||||
|---|---|---|---|---|---|---|---|---|---|---|---|---|---|---|---|---|---|---|---|---|
| NDGAIN (inverted) | WRI | INFORM CC | MVI | Normalised average | NDGAIN vuln | WRI vuln | INFORM cc vuln | MVI struct vuln | Normalised average | NDGAIN exp | WRI exp | INFORM CC | MVI env vuln | PVCCI | Normalised average | |||||
| Countries | ||||||||||||||||||||
| LDCs | - Top quartile (%) | 64% | 18% | 42% | 33% | 51% | 64% | 42% | 51% | 29% | 58% | 44% | 16% | 33% | 24% | 33% | 36% | |||
| - Top half (%) | 96% | 44% | 84% | 62% | 80% | 100% | 73% | 89% | 53% | 96% | 76% | 40% | 58% | 47% | 47% | 56% | ||||
| SIDS | - Top quartile (%) | 17% | 8% | 6% | 39% | 8% | 36% | 3% | 6% | 36% | 11% | 36% | 8% | 0% | 44% | 28% | 22% | |||
| - Top half (%) | 36% | 31% | 22% | 69% | 36% | 56% | 11% | 25% | 67% | 44% | 64% | 36% | 25% | 61% | 64% | 50% | ||||
| Populations | ||||||||||||||||||||
| LDCs | - Top quartile (%) | 83% | 36% | 74% | 17% | 75% | 54% | 77% | 77% | 16% | 75% | 58% | 31% | 69% | 19% | 23% | 48% | |||
| - Top half (%) | 100% | 60% | 99% | 53% | 91% | 100% | 98% | 99% | 46% | 99% | 86% | 58% | 87% | 34% | 35% | 77% | ||||
| SIDS | - Top quartile (%) | 38% | 33% | 33% | 22% | 34% | 25% | 15% | 33% | 24% | 22% | 16% | 33% | 0% | 40% | 26% | 41% | |||
| - Top half (%) | 42% | 74% | 58% | 29% | 42% | 44% | 34% | 41% | 47% | 43% | 55% | 75% | 76% | 47% | 49% | 45% | ||||
A simpler way of looking at this is to consider the average rank of countries in each country group in each index and at each level. These are reported in the table below. This shows that LDCs are more vulnerable than SIDS at all three levels using ranks based on the average of the normalised index scores, and in virtually every case when analysing individual indices (with some exposure indices and the MVI again being the key exceptions). Interestingly, low-income countries (LICs) as a group appear to be even more vulnerable than LDCs in pretty much every scenario.
Average vulnerability rank of countries in each country group
| OVERALL RISK INDICES | NDGAIN (inverted) | WRI | INFORM CC | MVI | Normalised average | |
|---|---|---|---|---|---|---|
| - LDCs | 31 | 74 | 43 | 58 | 43 | |
| - SIDS | 79 | 88 | 99 | 51 | 85 | |
| - LICs | 21 | 71 | 26 | 49 | 28 |
| VULNERABILITY INDICES | NDGAIN vuln | WRI vuln | INFORM CC vuln | MVI struct vuln | Normalised average | |
|---|---|---|---|---|---|---|
| - LDCs | 29 | 46 | 37 | 62 | 33 | |
| - SIDS | 58 | 103 | 93 | 54 | 76 | |
| - LICs | 27 | 31 | 22 | 53 | 22 |
| EXPOSURE INDICES | NDGAIN exp | WRI exp | INFORM CC | MVI env vuln | PVCCI | Normalised average |
|---|---|---|---|---|---|---|
| - LDCs | 49 | 83 | 61 | 71 | 67 | 63 |
| - SIDS | 57 | 79 | 99 | 64 | 61 | 74 |
| - LICs | 44 | 85 | 43 | 66 | 61 | 51 |
Note: Average rank out of 140 countries included in all indices.
All this suggests that not only is using individual indices to identify the particularly vulnerable fraught with difficulty, but that the SIDs category may not be a very good indicator of vulnerability to climate change. Though even if we could agree on a group of countries, we still face the problem of how best to allocate within such a group.
Where does adaptation finance currently go?
OECD reports on climate finance and the $100 billion goal show total climate finance doubling to $116 billion, and adaptation finance tripling to over $32 billion over the period 2016-2022. The shares of this adaptation finance going to SIDS and LDCs have been rising: up from 4 to 6 percent in SIDS, and from 25 to 34 percent in LDCs. But in per capita terms, SIDS benefit the most: at around $29 per head in 2022, they received six times more adaptation finance per head than all developing countries, and three times more than LDCs. This is even though they are substantially richer (with SIDS per capita income of $9700 being 60 percent higher than the developing country average, and eight times higher than LDCs).
Country-specific figures published by the OECD in its climate-related development finance dataset (based on different reporting methods so not directly comparable) confirm this picture and also allow us to explore both the variability of adaptation finance, and its correlation with vulnerability and per capita income. The results are striking.
First, they show huge variation in adaptation finance per head over the period 2016-2023. Tuvalu receives by far the highest, averaging over $2400 per head each year. SIDS dominate, with Nauru ($677/hd), Marshall Islands ($530/hd), Dominica ($326/hd), Kiribati ($286/hd), Tonga ($277/hd), Vanuatu ($260/hd), Micronesia ($233/hd), Saint Vincent and the Grenadines ($232/hd), and Grenada ($190/hd) filling the next nine positions. Tuvalu and Kiribati are also LDCs. Most developing countries received less than $10 per head, and some less than $1.
Second, there is virtually no correlation between adaptation finance per head and any of our three average vulnerability indices. Moreover, adaptation finance per head tends to be positively correlated with Gross National Income (GNI) per person (richer countries get more), although correlations are generally very weak, being high and significant only for LDCs.
These points are further illustrated in scatter plots in the working paper that plot adaptation finance per head against average index values and per capita income.
Where now? Rethinking adaptation finance
This analysis suggests that, as a group, SIDS may not be as vulnerable to climate change as LDCs, but they currently receive much higher levels of adaptation finance per head. In the context of UNFCCC discussions about the “particularly vulnerable” and a possible new adaptation finance goal, greater attention should therefore be paid to LDCs when it comes to adaptation finance.
This is not to argue that money should be taken from SIDS and reallocated to LDCs, or to diminish the very real climate threats (genuinely existential in some cases) or wider vulnerabilities that many SIDS are facing. It is also the case that per capita adaptation finance needs are higher in SIDS, partly because richer countries tend to have more assets to protect and because unit costs are especially high in SIDS. Moreover, it is typically only SIDS that can experience losses larger than 100 per cent of GDP following extreme climate-related events. But that doesn’t necessarily mean that (richer) SIDS need more adaptation finance, rather that they need a different type of help, especially risk sharing and contingent insurance, and direct support after disasters. SIDS may also well have a much stronger claim on resources for loss and damage, for which different allocation rules, and additional resources, are needed.
Further technical work on measures of vulnerability is needed, ideally tied into a political process led by the UNFCCC, however challenging that may be. But donors seeking to maximise the impact of their adaptation finance should place greater emphasis on LDCs (and LICs).
We know there should be a massive increase in available funding. Sadly, we also know that isn’t going to happen. There are analogies to be drawn with public bodies seeking to prioritise the allocation of scarce health funds (such as NICE in the UK). There just isn’t enough money to go round. Hard choices have to be made.
DISCLAIMER & PERMISSIONS
CGD's publications reflect the views of the authors, drawing on prior research and experience in their areas of expertise. CGD is a nonpartisan, independent organization and does not take institutional positions. You may use and disseminate CGD's publications under these conditions.