Recommended
WORKING PAPER
Climate Finance Allocations and Vulnerability

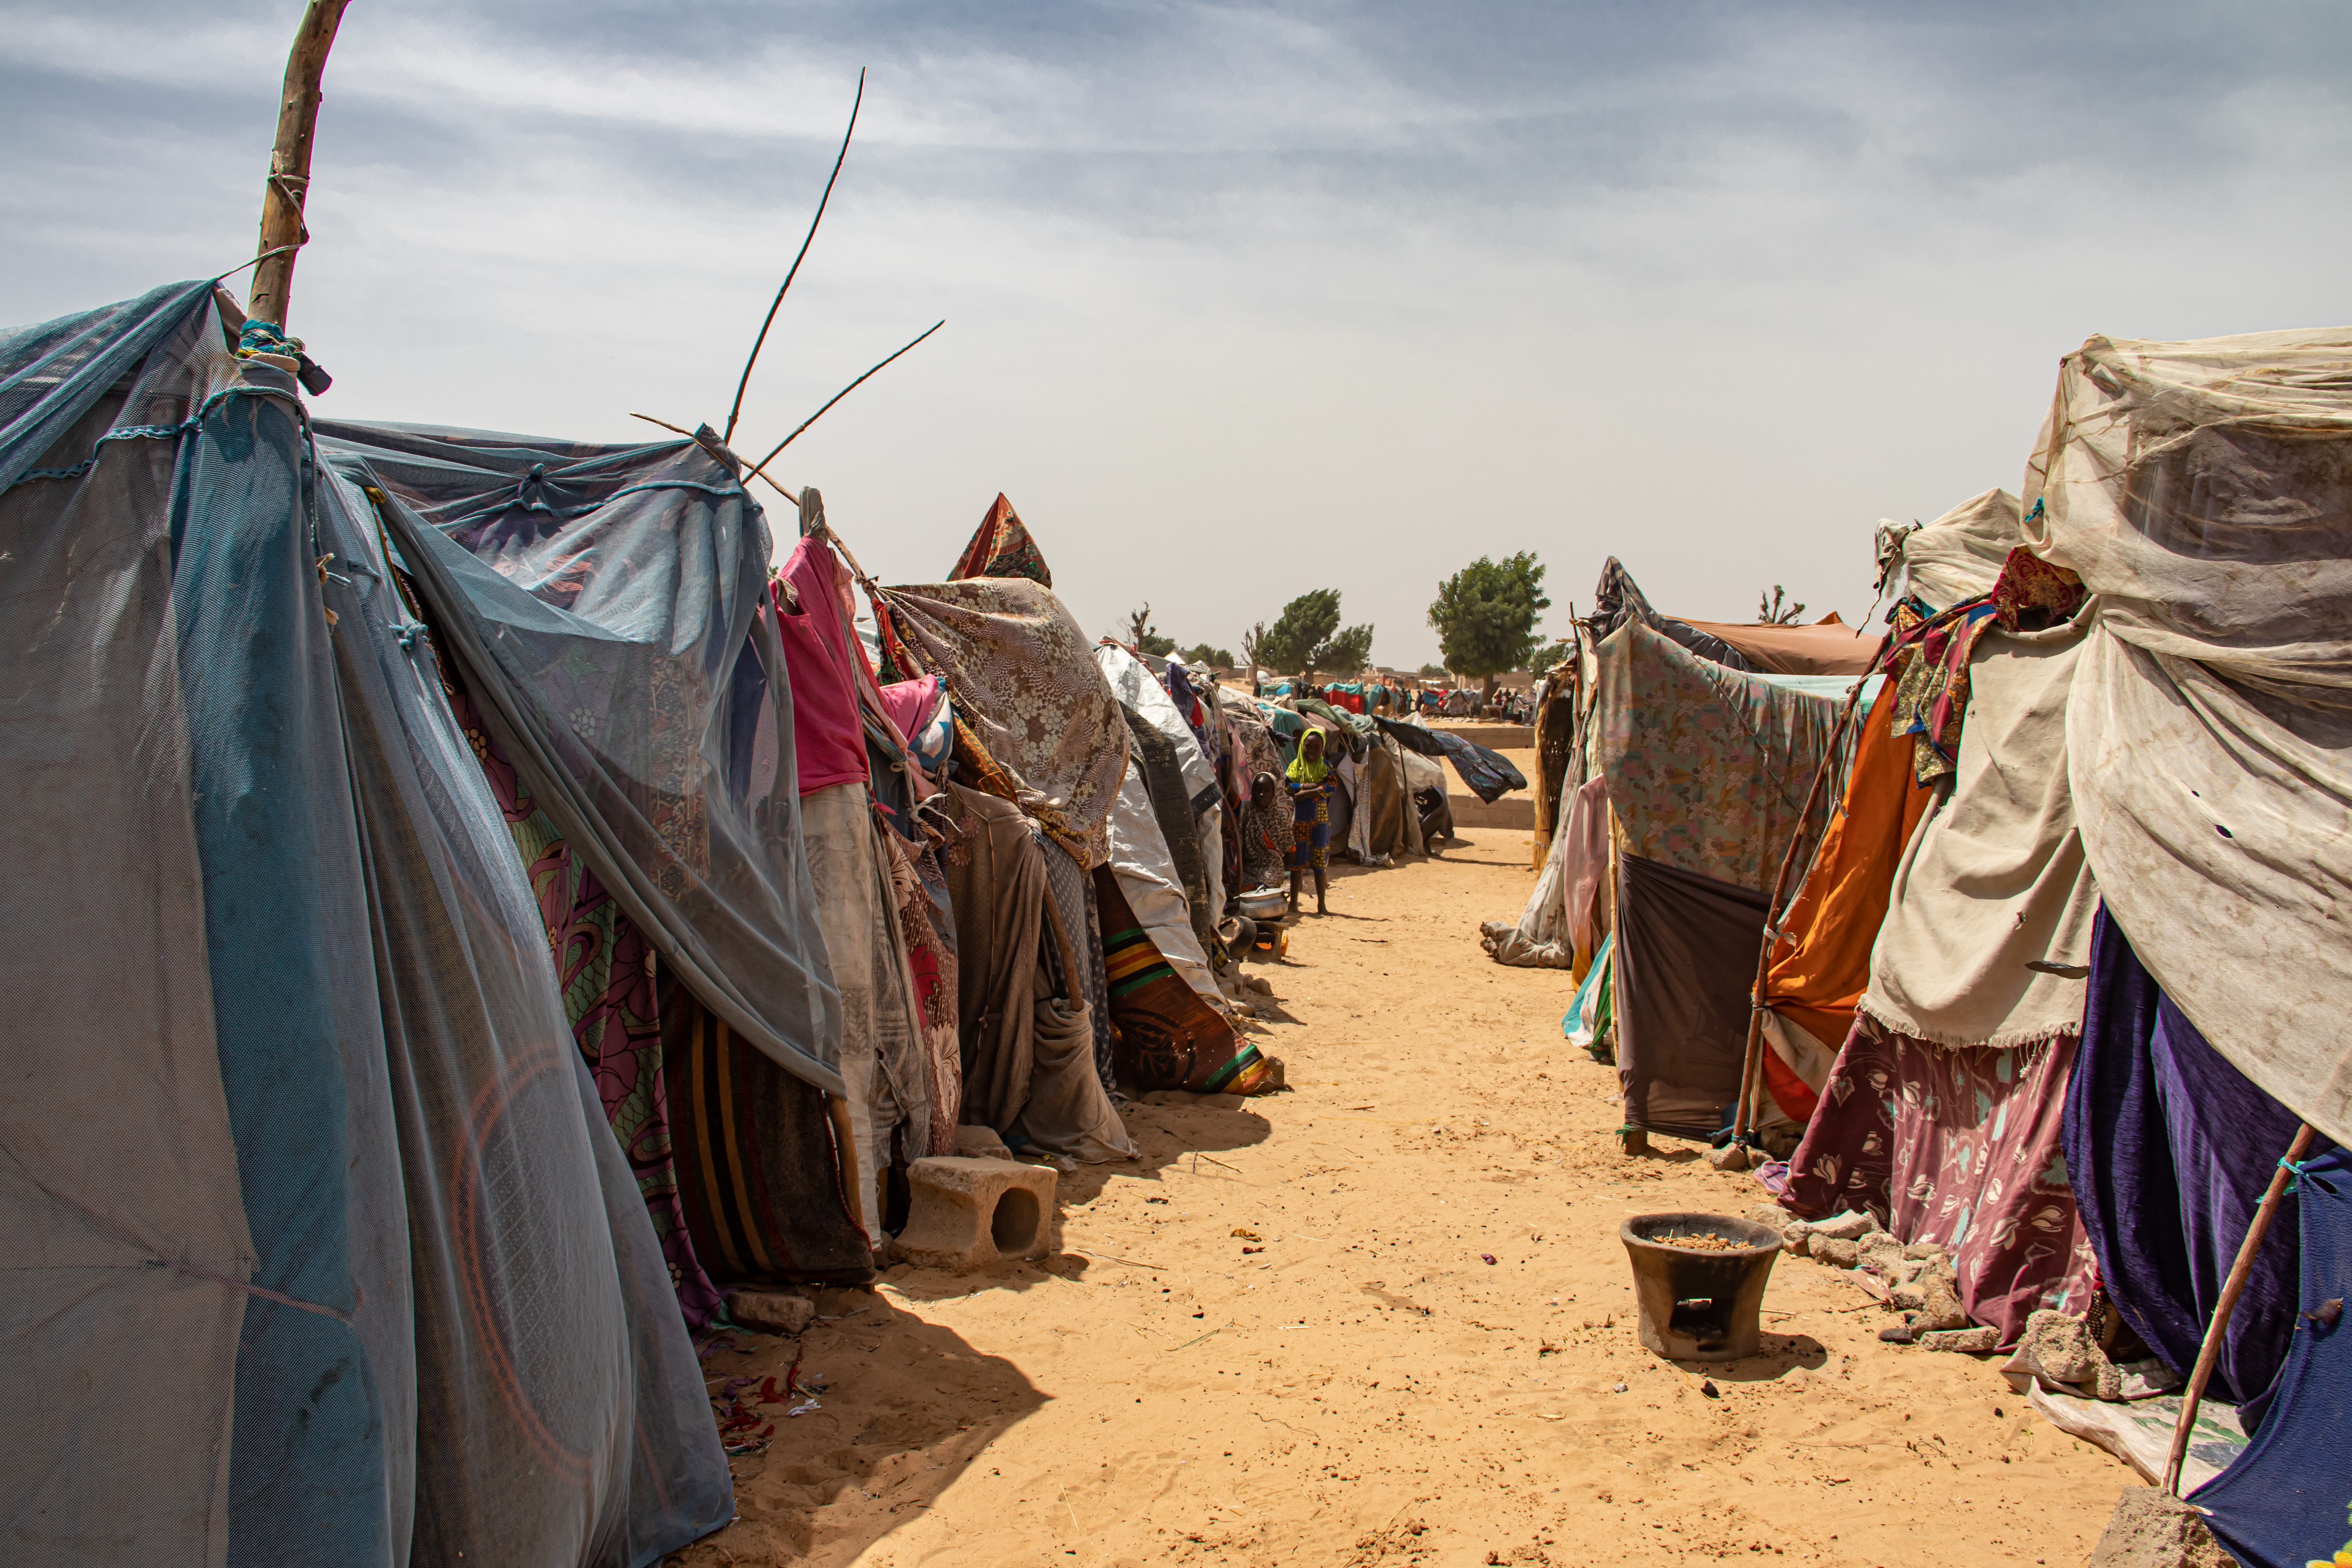
Fragile states, especially those affected by conflict or extreme fragility, are even more vulnerable to the impacts of climate change than small island developing states (SIDS) and least developed countries (LDCs), and yet they receive even less climate and adaptation finance.
Analysts and policymakers continue to grapple with questions of which countries are most vulnerable to climate change, and where climate finance resources should be allocated. The Paris Agreement and other key climate documents frequently reference the particular vulnerability and needs of small island developing states (SIDS) and least developed countries (LDCs). In a previous paper, I demonstrated that five different indices give very different rankings of vulnerability to climate change at three different levels (overall risk, vulnerability, and exposure),[1] with few countries consistently ranked in the top quartile of all. I also showed that LDCs—and low-income countries (LICs) more generally—appear to be much more vulnerable than SIDS overall, yet receive much less adaptation finance per capita.
This note extends that analysis to fragile states, which have recently attracted much attention.[2] I apply the same data on vulnerability and climate finance used in my earlier paper to fragile states, using two classifications of fragility (see table below):
- the World Bank’s list of 38 countries in Fragile and Conflict-affected Situations (FCS), comprising 21 countries in conflict and 17 countries with institutional and social fragility (ISF);
- the OECD’s list of 61 "States of Fragility" (SoF), with its subset of 18 countries described as being exposed to extreme fragility.
I also consider countries that are both fragile and LDCs, having previously noted that even if we could agree on which group of countries are particularly vulnerable, this provides little guidance on which countries within that group are the most vulnerable. Full results are set out here,[3] but the key findings are summarised below.
Fragile State Groups (67 countries)
| FCS-Conflict (21) | FCS-ISF (17) | Not FCS (29) | ||
|---|---|---|---|---|
| SoF (not extreme) (43) | Burkina Faso Ethiopia Lebanon Mali Mozambique Myanmar Niger Nigeria West Bank and Gaza | Comoros Guinea-Bissau Papua New Guinea Solomon Islands Timor-Leste Venezuela Zimbabwe | Angola Bangladesh Cambodia Côte d'Ivoire Djibouti DPR Korea Eswatini Gabon Gambia Guatemala Guinea Iran Kenya Laos | Liberia Malawi Mauritania Nicaragua Pakistan Rwanda Sierra Leone Tajikistan Tanzania Togo Turkmenistan Uganda Zambia |
SoF
| Afghanistan Cameroon Central African Rep. DR Congo Haiti Iraq Somalia South Sudan Sudan Syria Yemen | Burundi Chad Congo Eritrea Libya | Equatorial Guinea Madagascar | |
Not SoF
| Ukraine | Kiribati Marshall Islands Micronesia São Tomé and Príncipe Tuvalu | (none) | |
Sources: WB (FCS), OECD (SoF). Note: LDCs shown in bold
Fragile states and vulnerability
Fragile states are highly vulnerable to the impacts of climate change, more so even than LDCs. Conflict-affected fragile states are the most vulnerable of these, and countries that are also LDCs are the most vulnerable of all. The data illustrate this in several ways.
The table below reports the average rank of countries in each group for the individual indices assessed, and for the normalised average index, at all three levels. We can see that:
- FCS countries have a lower average rank (i.e., they are more vulnerable) than LDCs in all indices and at all levels (except for ND-GAIN vulnerability). In virtually every case, FCS-Conflict countries have an even lower rank, with LDC FCS-Conflict countries ranking even lower. For example, the average rank of all FCS countries is 27, compared to 33 for LDCs and 76 for SIDS using the normalised average index at the vulnerability level. The average rank for FCS-Conflict countries is 14, and just 10 for such countries that are also LDCs.
- The broader set of SoF countries have vulnerability ranks similar to those for LDCs at all levels, while the SoF “extreme” countries are very similar to the FCS-Conflict group overall (with 11 countries common to both groups), although there is greater variation when looking across individual indices (notably INFORM).
- Fragile states that are also LDCs are generally even more vulnerable than the rest of the fragile group they’re in. This is true for every fragile category using the average index, and indeed all individual indices except WRI, at all three levels in the table below (and indeed for all other categories except WB FCS with institutional and social fragility, as shown in Table 6 in attached tables).
Average vulnerability rank of countries in each country group
| OVERALL RISK INDICES | NDGAIN (inverted) | WRI | INFORM CC | MVI | Normalised average | |
|---|---|---|---|---|---|---|
- LDCs - SIDS - LICs | 31 79 21 | 74 88 71 | 43 99 26 | 58 51 49 | 43 85 28 | |
- FCS - FCS-Conflict - SoF - SoF (extreme) | 29 24 35 21 | 66 57 63 53 | 38 13 39 21 | 45 49 61 39 | 30 18 40 19 | |
- FCS & LDC - FCS-Conf. & LDC - SoF & LDC - SoF extreme & LDC | 24 16 25 9 | 72 59 66 53 | 35 9 34 17 | 43 47 56 31 | 29 12 33 11 |
| VULNERABILITY INDICES | NDGAIN vuln | WRI vuln | INFORM CC vuln | MVI struct vuln | Normalised average | |
|---|---|---|---|---|---|---|
- LDCs - SIDS - LICs | 29 58 27 | 46 103 31 | 37 93 22 | 62 54 53 | 33 76 22 | |
- FCS - FCS-Conflict - SoF - SoF (extreme) | 35 40 47 39 | 39 13 43 25 | 32 12 38 25 | 49 49 60 35 | 27 14 39 20 | |
- FCS & LDC - FCS-Conf. & LDC - SoF & LDC - SoF extreme & LDC | 22 26 28 19 | 40 11 38 19 | 29 9 29 14 | 48 49 57 37 | 22 10 27 11 |
| EXPOSURE INDICES | NDGAIN exp | WRI exp | INFORM CC H&E | MVI env vuln | PVCCI | Normalised average |
|---|---|---|---|---|---|---|
- LDCs - SIDS - LICs | 49 57 44 | 83 79 85 | 61 99 43 | 71 64 66 | 67 61 61 | 63 74 51 |
- FCS - FCS-Conflict - SoF - SoF (extreme) | 48 56 60 61 | 76 73 71 68 | 52 21 54 33 | 68 56 73 62 | 55 50 71 54 | 49 32 65 44 |
- FCS & LDC - FCS-Conf. & LDC - SoF & LDC - SoF extreme & LDC | 36 40 49 45 | 82 76 75 71 | 51 18 52 32 | 63 48 70 53 | 50 47 65 46 | 43 23 58 33 |
Note: Average rank out of 140 countries included in all indices. The lower the rank, the more vulnerable.
From the attached tables we can also see that:
- All of the countries that appear in the top quartile across all indices are not just LDCs, but also fragile states, whether using the WB FCS or the OECD SoF classification. These are Somalia and Yemen for overall risk; Chad, Niger, Somalia, and Sudan for vulnerability; and Somalia for exposure. All (bar Chad) are in the WB FCS-Conflict group, while all (bar Niger) are also in the SoF extremely fragile sub-group. Sixteen out of 18 (89 percent) FCS-Conflict countries appear in the top quartile at the level of overall risk (based on the average index), and 17 (94 percent) at the level of vulnerability (Table 4 in the attachment).
- FCS countries are also more concentrated in the top quartile of vulnerable countries than LDCs at all three levels (with 66 percent, 71 percent, and 46 percent of FCS countries falling in the top quartile at the levels of overall risk, vulnerability, and exposure respectively, using the average index, compared to 51 percent, 58 percent, and 36 percent respectively of LDCs). FCS-Conflict countries are even more concentrated (89 percent, 94 percent, and 67 percent, respectively).[4] When considering numbers of people, over 90 percent of FCS populations (and nearly 100 percent of FCS-Conflict populations) live in top quartile countries (compared to 75 percent of LDC populations) at the overall risk and vulnerability levels (though all groups have similar figures of a little under 50 percent for exposure).
- In nearly all cases, percentages of SoF countries and populations are slightly lower than those for FCS countries (but still much higher than LDCs), while those for extreme SoF countries are slightly lower than for FCS-Conflict. The one exception is at the exposure level, where nearly two-thirds of extreme SoF populations live in top quartile countries, compared with 44 percent for FCS-Conflict countries (Table 5).[5]
The analysis above focuses on vulnerability and climate change, although the “overall risk” level in each index often captures a wider set of economic, institutional, and social vulnerabilities that are more relevant when considering the allocation of aid resources more broadly. This is especially true of the MVI, which was specifically constructed to reflect the wider set of vulnerabilities faced by SIDS in order to justify their continued access to concessional support (from which many have been excluded due to relatively high levels of per capita income). It is notable therefore that all the WB fragile state groups, and the SoF extremely fragile group, appear more vulnerable than SIDS (and indeed every “vulnerable” country group considered in my original analysis) even using this MVI measure (see Table above[6]). Moreover, these fragile groups also have higher percentages of both countries and populations in the top quartile set of countries (higher than SIDS and virtually all the other “vulnerable” groups[7]) according to the MVI overall risk index (Table 5a in attached tables).
Fragile states and climate finance
When it comes to climate finance, fragile states receive the lowest amount of both total and adaptation finance per capita of all the developing country groups assessed, although there is not much variation among the different fragile groups. This can be illustrated as follows:
- The chart below shows that fragile states have consistently received less adaptation finance per capita than LDCs (about two-thirds the LDC level on average), and significantly less than SIDS (about one-third the SIDS level), over the period 2016-2023. A very similar pattern emerges for climate finance overall.
- There’s not that much variation between the different fragile groups: FCS-Conflict and SOF extreme countries tend to receive a little less per capita, but not much less.
- Interestingly, fragile countries that are also LDCs generally receive slightly more than the rest of their group in all fragile categories. These findings apply to both all climate finance and to adaptation finance (see Annex 4 table in attached tables for details).
Adaptation finance per head for LDCs, SIDS, LICs, and selected fragile groups (2016-2023)

Source: derived from OECD Climate-Related Development Finance dataset
From the attached tables we can also see that:
- There is still a lot of variability in adaptation finance per capita within some of the fragile group categories, but much less so for the FCS-Conflict or either of the SoF categories (which contain many fewer of the most heavily aided SIDS—notably Tuvalu, Marshall Islands, Kiribati and Micronesia—that cause much of the distortion). See Table 8.
- There is still no clear relationship between adaptation finance per head and vulnerability in fragile states at all three levels (overall risk, vulnerability, and exposure), with correlation coefficients being generally small and statistically insignificant. They are, however, at least positive (more fragile countries get more adaptation finance) for the most fragile groups (FCS-Conflict and extreme SoF countries). See Table 9.
- There is also some evidence that richer fragile countries get more adaptation per capita when considering fragile countries overall (at least the WB FCS group) or countries with institutional and social fragility, though not countries in conflict. This finding is strengthened when looking just at LDC fragile states (not surprisingly, as this finding was also true for LDCs in the original analysis). See Table 9. This is likely to be because of absorption capacity constraints (perceived or real), and because many aid allocation models favour countries with better policies and institutions, which tend not to be the poorest.
Summary
These findings suggest that fragile states, particularly those in conflict and extreme fragility, are even more vulnerable than the most vulnerable group of countries assessed previously, and yet they receive even less climate and adaptation finance than the least well-funded. There may be serious constraints to the effective delivery of such finance to countries most in need, and these should, clearly, be taken into account. But these constraints can be overcome, and this analysis suggests that greater prioritisation of fragile states should be considered.
[1] The Notre Dame Global Adaptation Initiative Country Index (ND-GAIN), WorldRiskIndex (WRI), INFORM Climate Change Index (INFORM CC), UN Multidimensional Vulnerability Index (MVI), and FERDI’s Physical Vulnerability to Climate Change Index (PVCCI). “Exposure” focuses on physical climate hazards, “vulnerability” captures the sensitivity of a system to those hazards and its socioeconomic capacity to withstand them, and “overall risk” combines both with wider governance and institutional indicators. I also constructed a normalised average index of them all at each level. See original paper for details.
[2] The UK, for example, has placed a strong focus on fragile and conflict affected states (FCAS) in its recently announced aid allocations for the next three years, with the proportion of spending in FCAS to rise by around 13 percentage points to over 70 percent of all country and regional spending by 2028/29.
[3] These tables reproduce many of the original paper’s tables with additional rows or columns to cover fragile states. South Sudan, West Bank and Gaza, and Ukraine are excluded from each group as their vulnerability data are incomplete.
[4] Figures for SIDS were just 8 percent, 11 percent, and 22 percent at the three levels, respectively.
[5] The Table 5 rows on “% share of countries/populations in top quartile” are generally more meaningful than those showing “% share of top quartile countries/populations accounted for by,” because the number of countries in the FCS-Conflict and SoF extreme groups (in particular) are comparatively small, making it more difficult for them to fill a high percentage of the top quartile countries.
[6] The more detailed Table 6 in the attached tables shows that FCS-ISF countries have an even lower average rank of 42 using the MVI.
[7] The one exception being LIC and V20 populations, where a slightly higher proportion of their populations (24 percent in both cases) live in top quartile countries, as opposed to 22 percent of FCS-Conflict populations (but 25 percent of all FCS populations).
Topics
CITATION
Beynon, Jonathan. 2026. Climate Vulnerability and Fragility. Center for Global Development.DISCLAIMER & PERMISSIONS
CGD's publications reflect the views of the authors, drawing on prior research and experience in their areas of expertise. CGD is a nonpartisan, independent organization and does not take institutional positions. You may use and disseminate CGD's publications under these conditions.
Thumbnail image by: AusAID/Wikimedia