Recommended
POLICY PAPER
Climate Finance Fair Shares
Blog Post
The Case for New Countries to Contribute
Background analysis on the choice of model metrics for measuring fair shares is available here.
1. Introduction
Climate finance—and in particular who should pay—will remain a hotly contested topic as negotiators strive to develop rules for the Loss and Damage Fund agreed at COP28 in December 2023, and to agree a New Collective Quantified Goal (to replace the current $100bn target) by COP29 in November 2024.
Our earlier analysis of data on emissions and income concluded that there is a strong case for non-traditional donors to provide 20-30 percent of any climate finance total. This finding is robust, even when we look at a variety of different measures of historical emissions, cut-off dates, and income. China, Russia, South Korea, Saudi Arabia, Taiwan, Poland, the United Arab Emirates, and Mexico consistently ranked in the top 20 countries who should pay. This note presents three new features to our earlier model that: a) allow for a more ‘progressive’ structure that further favours countries with the lowest per capita emissions and incomes (akin to a more “progressive” tax system); b) add the most recent (2022) data on emissions and income, as well as projected emissions and income to 2030; and c) include a facility to cap individual country contributions. An updated spreadsheet model is published here.
Even with reference to the UNFCCC’s key principle of “common but differentiated responsibilities and respective capabilities”, there remains a powerful argument for non-traditional donors to contribute significant shares of climate finance.
2. A more “progressive” model structure
Our original model calculated fair shares using the following formula across all countries:
Aggregate cumulative emissions * current GNI/hd (1)
Multiplying total cumulative historical emissions (since the chosen cut-off date—1979 in our baseline scenario) and current per capita income effectively means that two countries with the same aggregate emissions would have fair shares in proportion to their per capita incomes, reflecting the emphasis on equity and “common but differentiated responsibilities and respective capabilities” (CBDR-RC). This approach allowed the easy and simultaneous identification of which new countries should become contributors, and how big their shares should be.
However, most would agree that per capita metrics remain the fairest way of considering emissions and income. A better way of framing the fair shares question therefore may be to first think in terms of what individuals should pay, before calculating what countries should pay. The formula thus becomes:
Cumulative emissions/hd * current GNI/hd * current population (2)
which reduces to:
Cumulative emissions/hd * aggregate current GNI (3)
This is scenario 4 in our original model, and produces results that are (unsurprisingly) almost identical[1] to equation (1), so our original formulation is essentially correct (even if scenario 4 may have been the better baseline).
However, if we think of our fair shares model as a form of tax system in which obligations increase with both emissions and income, a case can be made for making it more progressive by a) introducing some minimum level of per capita income and/or emissions below which countries would bear no responsibility to provide climate finance (akin to a ‘tax free allowance’); and b) applying exponents to both income and emissions terms that progressively ‘tax’ anything above those minimum thresholds[2]. Importantly, this second adjustment does require the formula to be expressed in the format of equation (2), which then becomes:
(Cumulative emissions/hd - E) α * (current GNI/hd - G) β * (current population - P) (4)
If the ‘tax free allowances’ E, G and P = 0[3], and the ‘exponents’ α and β = 1, formula (4) is equivalent to formula (3).
A similar approach was adopted by the Carbon Equity Reference Project whose model uses Gross National Income (GNI) and inequality data to exclude the incomes and emissions of individuals below a “development” threshold of PPP$7,500/hd (in purchasing power parity terms), and (in their “highly progressive” scenario) only counts a steadily growing proportion of any income and emissions of individuals above that threshold (up to some “luxury” threshold at which 100 percent of additional income and emissions are counted). Their “Responsibility and Capacity Index” is still based on the simple average (not the product) of each country’s share of the two components (cumulative emissions and aggregate incomes), although there is an option to adjust the weight given to each. It was designed to inform fair shares of emissions reductions, although has also been applied to estimating fair shares of adaptation climate finance contributions[4].
To illustrate the effects of these changes, Table 1 compares the results of our original model (scenario 4 using undiscounted cumulative CO2/hd since 1979 and aggregate US$ GNI in 2021)[5] for selected countries/groups[6]under three alternative formulations:
- Option 1 sets thresholds at levels below which the bottom 20 percent of countries on each metric would effectively be exempted (E = 20 t/hd, G = $1850/hd);
- Option 2 sets both α and β = 1.2;
- Option 3 combines the two (E = 20 t/hd, G = $1850/hd, α and β = 1.2).
Table 1: Comparing effects of more progressive model structure on fair share %
|
Original |
Option 1 |
Option 2 |
Option 3 |
|
|---|---|---|---|---|
|
Annex II |
76.7% |
79.8% |
82.8% |
85.0% |
|
USA |
47.7% |
50.4% |
55.3% |
57.6% |
|
EU |
15.6% |
15.6% |
14.2% |
13.9% |
|
UK |
2.8% |
2.9% |
2.6% |
2.5% |
|
Non-Annex II |
23.3% |
20.2% |
17.2% |
15.0% |
|
China |
7.2% |
6.0% |
4.3% |
3.4% |
|
4 gulf states ^ |
4.0% |
4.1% |
4.3% |
4.4% |
|
LICs/LMICs/SIDS/LDCs |
1.8% |
0.9% |
1.0% |
0.7% |
|
India |
0.3% |
0.0% |
0.1% |
0.0% |
^ Saudi Arabia, UAE, Qatar, Kuwait
Other values could of course be applied, although there is little objective basis for favouring any one particular combination. But the results illustrate that more progressive formulations tend to increase the share of existing Annex II countries (the 23 developed countries that have a legal obligation to provide climate finance), although this is largely driven by increased shares for the USA. The shares of most other G7 countries actually fall. And while China benefits from these more progressive formulations, some other developing countries (non-Annex II, notably the Gulf states such as UAE and Qatar) see their fair shares rise. The collective share of low income (LIC), lower-middle-income (LMIC), including India, least developed countries (LDCs) and small-island developing-states (SIDS) was already negligible and falls even further.
However, it should be emphasised that our original formulation (with a non-Annex II share of 23 percent) was already significantly more favourable to developing countries than the previous models reviewed in our earlier paper, which typically calculated each country’s fair share as the average of each country’s shares of both total emissions and aggregate income. Indeed, had we applied that approach to our full set of countries (using total undiscounted CO2 emissions since 1979 and aggregate US$ GNI), the non-Annex II share would have been 53 percent (with China 19 percent), and 64 percent if population were also added as a third metric as in ODI’s original model[7]. Even using an earlier 1900 cut-off date (which should favour developing countries—and yielded a non-Annex II share of 17 percent in our original model, scenario 5) still gives a non-Annex II fair share of 48 percent using the average of CO2 and GNI shares (and 61 percent if population included as a third metric). And as noted above, the Carbon Equity Reference Project’s analysis suggested a Chinese fair share of 5.7-8.1 percent even with a PPP$7,500/hd development threshold.
3. Updating model with 2022 data and projections to 2030
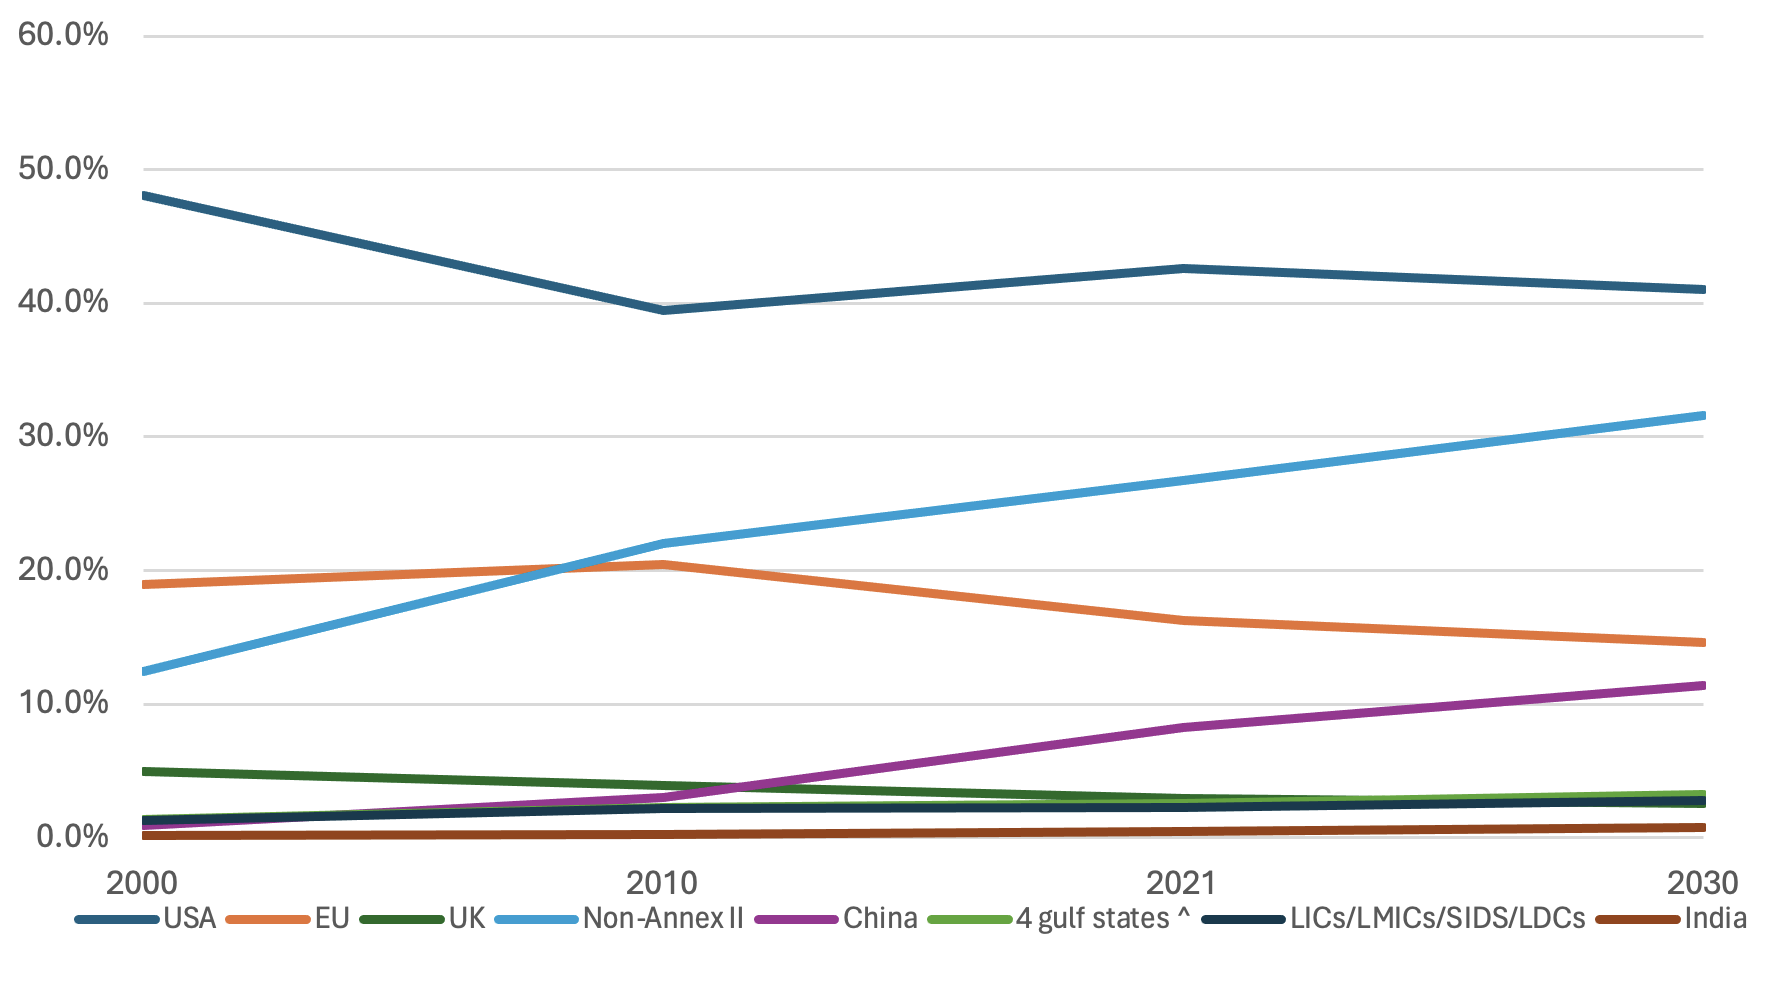
Patterns of emissions and income are changing rapidly with significant implications for fair shares. With the NCQG expected to apply to 2030 or beyond, what might these shares look like in the future? Our updated model incorporates the latest published 2022 data on emissions and income, as well as projections for emissions (all greenhouse gases), income and population through to 2030[8]. Figure 1 illustrates how fair shares are changing over the period 2000-2030 (using the scenario 2 (GHG) version of our original model with undiscounted cumulative GHG emissions since 1979 and US$ /hd GNI in 2021)[9] for the selected countries. The scale of some of these changes, particularly China’s, demonstrates the importance of keeping fair shares under regular review, and of avoiding being bound by the classification of developed and developing countries that pertained in 1992.
Figure 1: How fair shares are evolving over time
4. Introducing country caps
Our previous model produced a fair share for the USA of over 40 percent in virtually every scenario, yet there is no prospect of this being achieved[10]. Political realism may affect the shares assigned to other countries as well. This updated model therefore also now includes the facility to cap individual country shares at some user-defined level, with the shares of all other countries adjusted accordingly. This is not to argue against the allocations suggested by an uncapped model, but to enable a degree of political realism that allows “what if” questions to be explored. Table 2 illustrates this by comparing our original model results (baseline scenario 1 with undiscounted cumulative CO2 emissions since 1979 and US$ /hd GNI in 2021) with a scenario in which the US’s share is capped at 20 percent: all other countries face an increase of about 50 percent in their fair share, with that of non-traditional donors collectively rising from 23 percent to 34 percent.
Table 2: Impact of capping United States' fair share
|
Original |
USA capped |
|
|---|---|---|
|
Annex II |
77.2% |
65.9% |
|
USA |
46.6% |
20.0% |
|
EU |
17.1% |
25.6% |
|
UK |
3.0% |
4.4% |
|
Non-Annex II |
22.8% |
34.1% |
|
China |
7.8% |
11.7% |
|
4 gulf states ^ |
2.4% |
3.6% |
|
LICs/LMICs/SIDS/LDCs |
1.5% |
2.3% |
|
India |
0.3% |
0.5% |
^ Saudi Arabia, UAE, Qatar, Kuwait
5. Conclusions and policy implications
There is no single or simple answer to the “fair shares” question. As with the previous paper, the results presented here each depend on a set of technical and political choices, all of which can be contested. And yet the basic message is clear: while responsibility for providing climate (and loss and damage) finance continues to rest primarily with developed countries, the principle of common but differentiated responsibilities itself increasingly demands that richer developing countries and non-traditional donors that have emitted significant quantities of GHGs should also start contributing, with a collective fair share in the 20-30 percent range which is likely to increase over time. China would be the most significant—but by no means the only—new contributor. But the fair share of LICs, LMICs, SIDS and LDCs is negligible, and they should continue to be exempted from any such responsibility.
While negotiators disagree on whether the current legal texts impose any such obligation, they do not prevent such contributions. Many developing countries already provide climate finance through contributions to the MDBs, and some have significant (if unreported) bilateral programmes as well[11]. Finding a way to acknowledge and encourage such contributions could help unlock agreement of the NCQG and wider climate finance negotiations.
[1] Small differences in fair shares between the two scenarios can be explained by differences in country population growth rates since the chosen cut-off date.
[2] Our original model partially addressed (a) by allowing different groups of countries (LICs, LMICs, SIDS and LDCs) to be exempted, and (b) by applying a power term to the GNI/hd component.
[3] A minimum threshold for population is included for completeness, although not explored in this note.
[4] Even in their most progressive scenario with an 1850 cut-off date and highly progressive income accounting, China’s 2020 share is 5.7 percent when the model covers all countries, rising to 8.1 percent in the medium scenario (with 1950 cut-off date and weakly progressive income accounting: see Annex II Table 3).
[5] Minor changes in some country results have arisen due to revisions to 2021 data on emissions and/or income. The UK is also now excluded from EU totals (it was previously included).
[6] The full set of results for all countries and groups is set out in the excel model published here.
[7] Figures using the more recent 1990 cut-off date applied by most previous analysts are very similar.
[8] Some country income classifications have changed, notably Indonesia and El Salvador both graduating from LMIC to UMIC in 2022 (see model for details). Projected emissions data are derived from the IMF’s Climate Change Indicators Dashboard by calculating the annual percentage change in each year’s GHG emissions from 2022-2030 and applying these to OWID’s 2022 figures. This overcomes any differences in the 2022 base year figures (which are significant for some individual countries, especially some LICs, although are not large overall). Analysis using the CO2 measure of emissions is not possible because the IMF CO2 figures only cover the energy sector and are not comparable with the OWID data. GNI projections are derived using projected GDP growth rates from the IMF’s World Economic Outlook datamapper for the period to 2029, with 2030 projections based on the 2027-29 average (GNI figures are not provided, but it is assumed that GDP growth rates represent a sufficiently accurate approximation). For consistency with the rest of the dataset, per capita projections for both emissions and income are derived using OWID’s projected population figures. There are a number of countries for which the IMF sources do not provide projections for either emissions or income (and sometimes both). In these cases the most recent available data are used. This will only have a very limited impact on our results, as collectively these countries accounted for just 0.7% of the total fair share in our original model (baseline scenario 1).
[9] In many respects the GHG measure is preferred (even if older historical data are weaker), as that is what matters for climate change and is the metric used for country NDC commitments. It‘s worth noting here that Jones et al (2023) have calculated contributions to global warming since 1850 using a slightly different approach than that used in most emission datasets—including the one we use here—that better reflects the short-lived nature of some GHGs (notably methane). This suggests that our model may slightly overstate the contribution of older historical emissions. Indeed, while our dataset suggests that Annex II countries have been responsible for 49 percent of total CO2 emissions, and 36.6 percent of total GHG emissions over the period 1850-2021, Jones et al‘s figures for Annex II country contributions to global mean surface temperature (GMST) increases over this period are 49 and 33.8 percent respectively.
[10] It has been argued, for example, that the US contributes more than its fair share to other global efforts such as support for Ukraine or NATO, and that this at least partly offsets its climate finance responsibilities.
Topics
CITATION
Beynon, Jonathan, and Edward Wickstead. 2024. Climate Finance: Fair Shares Revisited. Center for Global Development.DISCLAIMER & PERMISSIONS
CGD's publications reflect the views of the authors, drawing on prior research and experience in their areas of expertise. CGD is a nonpartisan, independent organization and does not take institutional positions. You may use and disseminate CGD's publications under these conditions.