Recommended


1. Introduction
When we launched the first pilots for the Return to Learning Initiative, we put together a list of 35 education programs that might allow us to test the feasibility of identifying long-term effects of early skills gains.[i] Now that we are taking the Initiative forwards, we have gone back and screened more than 1,000 studies in a new Candidate Studies Dataset.[ii] After applying criteria for study design, sample size, country income, cohort age, and outcomes measured, we are left with 49 eligible studies. Of those, 20 had a significant impact on learning and participants old enough to plausibly be in the labor market: we are prioritising those 20 for further investigation.
The Initiative’s policy question remains straightforward: does raising skills in primary school lead to better economic and health outcomes in adulthood? Random assignment to an effective education programme provides a source of variation in early skills. The question is whether those better skills translate into differences in adult wages, health and living standards a decade or more later.
No single study will provide a complete answer on its own. The original trials were designed to detect short-run effects on test scores, not long-run effects on adult outcomes, and were conducted in a wide range of countries. After more than 15 years in most cases, the proportion of the original sample that one could track down is likely to shrink too. Our strategy is therefore to pool estimates across multiple studies. To do that, we need a well-defined pool of candidates.
This note documents the search and screening process used to build that pool. It describes how we expanded and improved the original candidate list, the criteria we used to identify eligible studies, and the reasons particular studies were included or excluded. The aim is to provide a transparent basis for deciding which studies should be prioritised for long-run follow-up.
As a snapshot of what we have found, Figure 1 shows the 20 most promising studies from which we will select our next wave of feasibility pilots. The horizontal axis shows how old the original treatment/control cohort will be in June 2027; the vertical axis shows the initial effect size on a literacy or language outcome, in standard deviations. Each marker is a separate experimental arm, and four studies appear more than once because they tested more than one design. In cases where there has already been a follow-up (in practice, between 3 and 24 months post intervention), the hanging marker shows the treatment effect at follow-up. The colors of the markers show dimensions of tracking feasibility, described in the figure legend and note.
Figure 1. Most promising candidate studies by cohort age in June 2027 and reference effect size (in standard deviations), coloured by tracking feasibility

Notes: Each marker is one treatment arm, numbered by “Study_ID” that maps to the Candidate Studies Dataset, and labeled to identify the treatment. Colour categories are as follows. Active: five intervention arms currently being tracked. Child panel & Repeat cross-section: the study's original sampling design, indicating what identifying data are held on participants and may be used to trace them. Pathway concern: studies in which we are less confident that the treatment effect may pass only through a cognitive skills increase, for example where school or household financial resources also changed. Infeasible: two studies piloted in 2024 without success (explained here). Five studies have persistence measures; hanging markers show the persistent effect at the later follow-up point.
The rest of this note is organised in five sections. Section 2 summarizes how we arrived at the numbers in the figure. Section 3 presents the most promising candidates in detail. Section 4 details why the type of intervention—and not just whether it boosted learning outcomes in the early grades—matters for whether a study can be incorporated into the long-run estimates through our Initiative. Section 5 describes the next steps. The Appendix, for readers who want to see the full construction, presents the methodology behind the candidate pool identification.
2. How we got here
2.1. The selection breakdown
Table 1 summarises selection from the initial pool of screened studies to the final set of most promising candidates. The process has two phases. In the first, we apply formal eligibility criteria that any study must meet to be considered for long-run follow-up. (Appendix A gives the full methodology.) In the second, we prioritise among the eligible studies based on the requirement of our research design.
The eligibility screen is mechanical and reproducible. Our primary search started from 1,056 unique studies drawn from eleven reviews and two study lists. To this database we apply criteria for publication status, experimental design, sample characteristics, country income, intervention channel, outcome domain, and cohort age. (We retained all studies with cohorts aged 20 and above in the broader candidate pool, so as not to narrow the list too aggressively and to keep newer programmes visible for future pilot rounds.) 41 studies meet all criteria which, along with exclusion codes, are documented in the Candidate Studies Dataset so that other researchers can verify or extend the screening.
That primary search was restricted to articles published in the academic literature. We then conducted a supplementary search of four inventories of education evaluations to (i) preserve earlier work assembled for this initiative, and (ii) catch earlier EGRA-based studies released as technical reports. From these sources we retained any study not already identified which met all eligibility criteria but had not necessarily been published in a peer-reviewed journal. This provided 8 further studies (for a total of 49 studies), and the inventories are recorded in Appendix A.[iii]
In the next stage, prioritisation narrows the eligible set to the studies most useful for this Initiative. Two considerations are particularly important at this stage.
- First, we need to observe an initial learning effect large enough to provide a relevant first stage for later analysis (see Section 3). Fourteen of the 49 eligible studies have no treatment arm with a candidate first stage effect, and we exclude these. The remaining 35 studies are our candidates, including 64 treatment arms. From this point onward the treatment arm is the unit of analysis, because each arm has its own design, sample, and effect size.
- Second, all else equal, we prioritise older cohorts since these individuals are more likely to have completed their education, formed families, and entered the labour market. For the upcoming wave of feasibility pilots, we focus on cohorts aged at least 23 in June 2027, giving 20 most promising studies with 40 treatment arms.
Table 1 sets out these four stages. Figure 2 presents the search funnel visually.
Table 1. Screening and prioritisation stages leading to the 20 most-promising studies
| Phase | Stage | Count | Criteria |
|---|---|---|---|
Eligibility screening
| 1. | 1,056 studies | Cited in any of 11 review papers or 2 study lists, after deduplication |
| 2. | 49 studies | Meet all eligibility criteria under either the academic or supplementary search pathway | |
Prioritisation for the Initiative
| 3. | 35 studies (64 arms) | At least one arm with a candidate first stage effect on literacy or language |
| 4. | 20 studies (40 arms) | Cohort age ≥ 23 in June 2027 |
Figure 2. Search funnel

2.2. Characteristics of identified studies
Table 2 summarises the 49 eligible studies identified at Stage 2. Two patterns stand out. First, there is a geographic concentration with interventions in India and Kenya together accounting for two-fifths of all identified studies. Programmes from Latin America, Francophone West Africa, and the Middle East and North Africa exist but are less common. Second, the dominance of cluster-randomisation has direct implications for statistical power. Cluster counts, not individual participant counts, drive the precision of any pooled long-run estimate and will influence how we prioritise among candidates.
Table 2. Identified studies, basic characteristics (49 studies)
| Variable | Summary |
|---|---|
| Country | India (10 studies), Kenya (10) 8 countries with 2 studies each (Ghana, Liberia, Madagascar, Nigeria, Pakistan, Rwanda, Tanzania, Uganda) 13 countries with 1 study each |
| Income level at intervention | Low-income (12 studies) Lower-middle income (32) Upper-middle income (5) |
| Randomisation unit | All but one identified study is cluster-randomised Clusters: school (32 studies), zone (6), village (5), district (2), sub-county (1), sector (1), coordinating centre (1) |
| Expected cohort age, June 2027 | Median 24.5 years Interquartile range 21.7–28.6 years Total range 20.0–34.3 years |
| Intervention arms per study | 1 arm (31 studies) 2 arms (11) 3 or more arms (7) |
| Reference effect size (by intervention arm) | Negative (6 arms) 0.00 to 0.09 SD (21) 0.10 to 0.19 SD (22) 0.20 to 0.39 SD (20) 0.40 SD or above (13) This is the only arm-level row in the table because effect sizes are reported by arm. We report what the original studies report, without aggregating arms within a study. |
Eighteen of the 49 identified studies include more than one treatment arm. Eleven report two arms, seven report three or more, for a total of 82 arms across the 49 studies. From the next subsection onward, the treatment “arm” is the chosen unit of analysis, because each arm carries its own design choices, sample, and short-run effect. Within each arm, there are typically several literacy outcomes, measured in different ways and reported using different conventions. We apply a simple hierarchy to select a reference effect for each arm (described in Appendix A).
2.3. Candidate studies
We are interested in whether better early skills lead to better life outcomes. To study that relationship, it is important to follow up trials that improved learning in the first place. In econometric terms, the original experimental treatments provide an instrument for learning, allowing us to estimate the causal effect of skills on later-life outcomes (see Section 4). Studies that did not improve test scores amount to weak instrumental variables. If used to estimate the long-run effects of learning, these can lead to severe bias (Staiger and Stock 1997; Andrews, Stock, and Sun 2019).
For this reason, we consider short-run learning impact during prioritisation. To avoid excluding potentially useful studies too early, we apply a deliberately permissive threshold. A treatment arm is classified as having a candidate first stage if it has an effect of at least 0.1 standard deviations and is statistically significant at the 10 percent level.[iv] Fourteen otherwise eligible studies have no treatment arms meeting this threshold. These studies remain theoretically eligible but are lower priority for us because they do not provide a sufficiently strong first stage for our identification strategy.
For any study with at least one candidate first stage treatment arm, we retain all treatment arms, including those classified as negligible. We do this for completeness, because researchers may be interested in questions other than our own, and because in practice different combinations of treatment arms may be selected for follow-up. After dropping the 14 studies, 35 candidates remain, covering 64 treatment arms. Table 3 reports the characteristics for this set, focusing this time on the variables which matter most for whether a long-run follow-up is operationally feasible.
Table 3. Candidate studies, feasibility-relevant characteristics (35 studies, 64 arms)
| Variable | Summary statistics |
|---|---|
| Reference effect size | Median 0.18 SD Interquartile range 0.10–0.33 SD Total range -0.07–1.40 SD |
| Total clusters per arm (treatment & control) | Median 104 clusters Interquartile range 75–199 clusters Total range 8–619 clusters (With the max. value from the individually randomised study) |
| Total individuals in sample (treatment & control) ✝ | Median 4,086 Interquartile range 2,283–7,181 Total range 619–21,199 |
| Child tracking approach (by study) | Child panel (longitudinal) (20 studies, 40 arms) Repeat cross-section (15 studies, 24 arms) |
| Persistence measures (by study) * | 6 studies (covering 8 arms) report a persistence measure. Of the 6 studies, 4 have at least one arm whose effect survives |
| Exclusion-restriction concerns (by study) | 6 studies (8 arms) are flagged for: working first through enrolment drives; targeting community reading activities and parental engagement; including bundled non-pedagogical components (resource transfers, school-management changes); or broader market or governance reforms. |
Notes: ✝ We take the baseline sample for longitudinal studies but the endline sample for repeat cross-sections on the basis that it is this endline cohort which identifies the initial learning effect. * For persistence measures we apply the same negligible classification as for the initial effect, i.e. effect at least 0.10 standard deviations and statistically significant at the 10 percent level to be a candidate first stage effect.
The longitudinal-versus-cross-section split (40 versus 24 arms) tells us most candidate arms come from studies that already have individual identifiers collected, the strongest asset for tracing. Where surviving persistence evidence exists, it is a positive signal for our research question, since the original learning gain was still detectable some months after the intervention ended.
2.4. Interpreting the reference effect sizes
Moving from candidates to the most promising intervention arms requires some way of judging the relative strength of the original learning gain. There is, however, no harmonised literacy or reading metric across studies, nor any way of us creating that. Studies use different instruments, assess different domains of literacy and language, and report results in different ways. Given this, we apply consistent rules for selecting a single “reference effect” for each treatment arm.
First, we always take an Intent-to-Treat estimate from the latest follow-up point reported in the original paper (e.g., endline rather than midline). One exception is where a paper reports a post-intervention follow-up intended to measure persistence. In those cases we treat the later estimate as a persistence effect rather than an intervention’s initial effect.
Then the question becomes which learning measure to prioritise. Some studies report a single measure, and so we take that. More often, studies report multiple literacy or language outcomes for the same treatment arm, and estimated effects can vary quite a bit across them. We select one reference effect from these using the following hierarchy: (1) the author-designated primary literacy outcome, (2) a composite or total language or literacy score, (3) oral reading fluency, and (4) letter or word recognition.
Beyond the headline number, several dimensions of study design influence the magnitude of a standardised effect. Two reviews document how effect sizes in education studies vary with the scope and design of the outcome assessment, the duration of the intervention, and the delay between intervention and measurement, and the grades and populations targeted (Kraft, 2020; Evans and Yuan, 2022). We do not adjust for these dimensions during screening, but they will matter to us when interpreting reference effects in Table 3 and Table 4 and when selecting studies to pilot. We discuss them briefly in the remainder of this sub-section.
Different measurement instruments. The candidate studies used different literacy assessments, standardised tests, EGRA subtasks, and curriculum-based exams. We use the standardised effect size, which is standard practice, but we are aware of the limitations of taking such effect sizes at face value (Rossiter et al., 2026). Narrower, researcher-designed assessments aligned to the content taught tend to yield larger effects than broad, independently administered tests, and different instruments applied to the same intervention can produce markedly different magnitudes. How to bring studies that measured different things in different samples onto a more comparable footing is a question we are also addressing in the meta-analysis modelling that will lead to the long-run follow-up results. For now, the reference effect we report is the best available guide to the short-run learning gain each arm produced. For the most promising studies, however, we code all reported effects, to allow a fuller picture of the overall impacts.
Different exposure durations and assessment timing. Candidate interventions range from short intensive programmes (a few weeks of reading catch-up summer camps) to year-long or multi-year engagements; the delay between the end of treatment and the outcome assessment also varies. We do not adjust the reference effect for programme duration or assessment timing. An intervention that ran for one month and one that ran for twelve months are both compared on the learning difference they produced at endline, because that difference is what our identification strategy will use. Duration does matter for interpretation and prioritisation, because short programmes with measures soon after completion tend to produce larger per-unit-time effect sizes, and we may want to treat unusually large effects from brief exposures with additional scrutiny. We will account for duration in the prioritisation of studies for tracking, though not formally in the screening and candidate identification reported here.
Different grades and sub-populations targeted. There is evidence, primarily from the United States, that effect sizes tend to be larger in lower grades (Bloom et al. 2008) and where interventions target selected sub-populations rather than the full student body (Kraft 2020). We note them here as context for interpreting cross-study variation in the reference effect, though we do not condition on them in the screening.
Domain coverage of reference effect. The screening criteria (Section 6) require at least one literacy outcome, and the reference effect reported in Tables 3 and 4 is always a literacy measure. Several candidate programmes also raised numeracy, and those effects are recorded in the Candidate Studies Dataset. We take a literacy reference effect because that gives us the best chance of a single comparable first-stage measure. Early-grade reading was the focus of the foundational skills research that produced the oldest cohorts in the candidate set, and it remains the domain with the deepest experimental evidence base. How to combine cross-domain information into a single first stage is a question we are addressing in the meta-analysis modelling.
3. The most promising candidates
The 20 most promising candidates are the subset of identified studies whose treated cohorts will be at least 23 in June 2027. Together, they include 40 treatment arms. Twenty-four of those 40 arms have candidate first stages and appear in Figure 1 (above). The other 16 are individually negligible arms within the same studies, retained in the Candidate Studies Dataset so the full picture of each study is visible, but not plotted.[v]
Table 4 restricts the candidate set to the 20 studies meeting the age threshold and shows the number of treatment arms in each study (for cross-referencing, the “Study_ID” column in Table 4 maps to the variable “Study_ID” in the Candidate Studies Dataset). This table also includes whether the treatment effect persisted, and a flag for exclusion-restriction concerns. These correspond with characteristics we need in a candidate study in order for it to be useful for long-run follow-up.
Persistence asks whether the short-run learning gain survived beyond the end of the intervention. Where the “Effect persists?” column shows "No," we have a follow-up measure already, in which the original gain has faded (judging by the same criteria of magnitude and significance). Persistence information is rare, with only 7 of 35 candidate studies reporting a follow-up measure. One option would be to set it aside and compare all studies on their initial short-run effects alone, but we think that would be wasteful. Where the evidence exists, we use it to update our assessment of a study's promise. Studies whose effects had faded to negligible levels within a year of programme completion are not candidates we would take forward to a feasibility pilot. For example, the Balsakhi and Computer Assisted Learning (CAL) Program in Vadodara and Mumbai carries the "Does not persist" flag, because the short-run language effects had faded to negligible levels only one year after programme completion.
Exclusion restriction flags programmes that are quite likely to have affected later outcomes through channels other than learning. Studies that carry this flag can still provide credible evidence on the causal links between interventions that targeted early learning and later-life outcomes. But they cannot be used to isolate the specific structural parameter that our identification strategy is designed to recover, namely, the return to a unit of learning. Section 4 sets out the reasoning. For example, India’s multifaceted education programme carries an exclusion-restriction flag because it operated first through an enrolment drive, then retention, and then learning. We are unlikely to be able to use this study to pin down the specific return to a unit of learning that the IV strategy targets.
Table 4. Most promising candidates (20 studies, 40 treatment arms)
| Study_ID | Country | Programme - [Arms] | Age in June 2027 | Reference effect (SD) | Treatment arms | Effect persists? | Exclusion concern? |
|---|---|---|---|---|---|---|---|
| 1 | India | Balsakhi - [Vadodara; Mumbai] & Computer-Assisted Learning (CAL) Program - [Vadodara] | 33.8 to 35.3 | -0.01 to 0.25 | 3 | No | - |
| 2 | Pakistan | Report cards (school and child test scores) | 33.0 | 0.10 | 1 | Yes | Yes |
| 3 | India | Camera-based teacher attendance monitoring and financial incentive program | 31.2 | 0.14 | 1 | - | - |
| 7 | Kenya | Tracking by prior achievement (within Extra Teacher Program/ETP) | 30.3 | 0.15 | 1 | Yes | Yes |
| 8 | India | Teacher performance pay program | 29.9 | 0.17 | 1 | - | - |
| 11 | Liberia (#) | EGRA Plus - [Full; Light] | 29.4 to 29.5 | 0.04 to 0.80 | 2 | - | - |
| 12 | India | TaRL Summer Camps, Bihar | 29.2 | 0.09 | 1 | - | - |
| 12 | India | Read India TaRL, Bihar - [Materials; Materials & Training; Materials, Training & Volunteer] | 27.5 | 0.02 to 0.12 | 3 | - | - |
| 12 | India | Read India TaRL, Uttarakhand - [Materials & Training; Materials, Training & Volunteer] | 27.3 | 0.01 to 0.06 | 2 | - | - |
| 12 | India (*) | TaRL, Uttar-Pradesh - [Materials; 10-day in-school camps; 20-day in-school camps] | 24.3 | 0.03 to 0.70 | 3 | - | - |
| 12 | India | TaRL, Haryana - TaRL | 24.0 | 0.15 | 1 | - | - |
| 17 | Philippines | Sa Aklat Sisikat (SAS) reading program | 27.3 | 0.13 | 1 | No | - |
| 18 | Kenya | Contract teacher program - [Government Management; NGO Management] | 26.7 | 0.04 to 0.20 | 2 | - | - |
| 19 | India | Multifaceted education program (enrollment drives, learning intervention, school management support) | 25.5 | 0.33 | 1 | - | Yes |
| 21 | Kenya | HALI (Health and Literacy Intervention) literacy intervention | 25.3 | 0.26 | 1 | - | - |
| 22 | India | Ensuring Children Learn (ECL) / (STRIPES) | 25.0 | 0.80 | 1 | - | - |
| 23 | Guinea | Performance-based reward program for teachers - [In-Kind Rewards; Recognition] | 24.7 | 0.12 to 0.18 | 2 | - | - |
| 24 | Kenya & Uganda (*) | Reading to Learn (RTL) - [Uganda; Kenya] | 25.0 | 0.08 to 0.18 | 2 | - | - |
| 25 | Ghana (*) | Teacher Community Assistant Initiative (TCAI) - [Pull out Remedial; After School Remedial; Classroom Split; Partial Day Tracking] | 24.5 | 0.08 to 0.18 | 4 | - | - |
| 26 | India | The Mindspark Computer-Assisted Learning (CAL) Program | 24.4 | 0.23 | 1 | - | - |
| 29 | Liberia | Liberian Education Advancement Programme (LEAP; formerly PSL) | 23.5 | 0.18 | 1 | Yes | Yes |
| 30 | Ghana | Making Ghanaian Girls Great! (MGCubed) | 23.4 | 0.33 | 1 | - | - |
| 31 | Tanzania | KiuFunza Teacher Grants and Bonuses - [Unconditional Grants; Teacher Incentives; Combined Grant & Incentive] | 23.3 | 0 to 0.21 | 3 | - | Yes |
| 32 | Mali (#) | Read-Learn-Lead (RLL) | 23.0 | 0.24 | 1 | - | - |
Notes: Values in column “Study_ID” correspond with the variable “Study_ID” in the Candidate Studies Dataset. The table presents all 40 arms from studies with at least one candidate effect. 24 of these arms have candidate first stages and appear in Figure 1. Study number 12 is unique in that it is a write-up of five separate programmes, implemented over several years, each with their own intervention designs; rather than collapsing everything into a single study, we report separately the five studies that the paper contains. (*) are intervention arms that we are actively following up. (#) are intervention arms that we piloted but were not successful.
We also require instrument relevance, which is assessed using the reference effect and corresponding first-stage F-statistic for each treatment arm. Relevant values are shown in the Candidate Studies Dataset where each observation is a treatment arm. Strong first stages mean the original randomisation is a powerful predictor of learning. Weak first stages, in contrast, reduce the precision of IV estimates and increase the risk of weak-instrument bias, even where the experimental design is strong. For example, Study_ID 18 provided contract teachers in Kenya and despite a 0.20 SD effect size on the NGO management arm, the first stage F-statistic would be only approximately 6.3. Our simulations show clearly how sensitive long-run IV estimates can become when the first stage is weak.[vi]
Three studies are currently “Active” across six treatment arms. Ghana TCAI (Study_ID 25 in Table 4, treatment arms: Pull Out and After School), Uganda RTL (Study_ID 24), and India Uttar Pradesh Teaching at the Right Level (TaRL) In-School Camps (Study_ID 12, treatment arms: Materials, 10-day camps, 20-day camps). Uttar Pradesh Materials is on the Active list because it is operationally part of the same pilot as the 10-day and 20-day camps, but its individual reference effect is negligible (0.034 SD, t = 1.53), so it does not appear in Figure 1.
4. Why intervention type matters for study selection
This Initiative is not trying to estimate the long-run effect of any particular education programme. Instead, we seek to estimate the return to learning in the early grades itself. We do this by treating each randomised intervention as a source of exogenous variation in learning. If an intervention increased early skills, we can use that increase to study whether higher skills lead to better outcomes later in life. As set out in our 2023 launch blog, our approach is based on instrumental variables estimation. In simple terms:
Let Z denote random assignment to the original programme, D early-grade test scores, and Y adult outcomes (wages, consumption, health). Randomisation ensures that Z is independent of unobserved determinants of D and Y (Huntington-Klein, 2021).
The remaining threat is a direct path from Z to Y that does not run through D. Let M stand for any non-learning channel through which the programme also affects adult outcomes. If that path is open, then the IV estimate blends the learning to outcomes effect with the M to outcomes effect, and the two cannot be separated in the data.
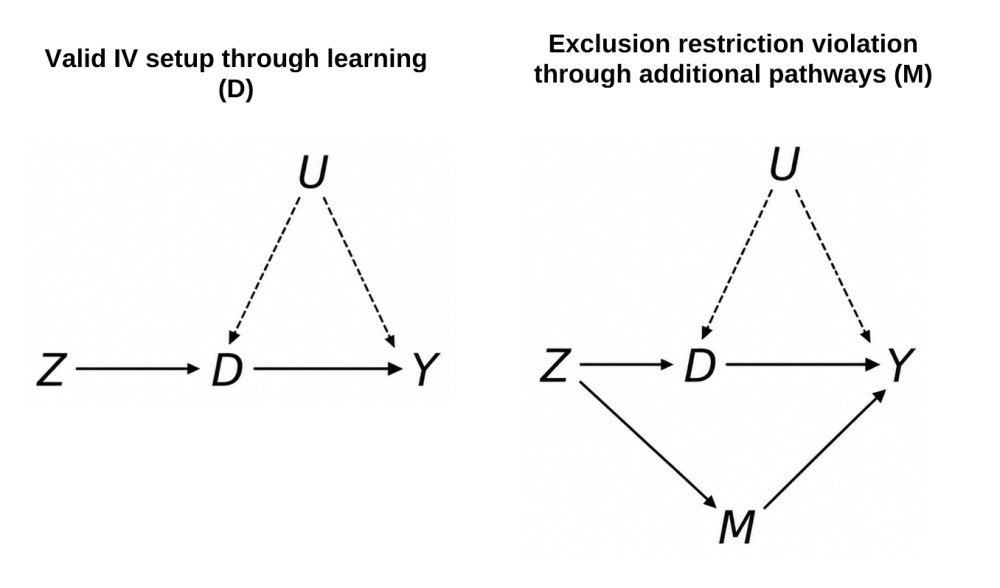
That framing is what makes the exclusion restriction important for study selection. To interpret an IV estimate as the return to learning, the intervention must affect adult outcomes only through its effect on learning, rather than through other independent channels.
The challenge is that educational interventions often affect more than learning. Some programmes increase enrolment first, or change school resources or community participation procedures alongside increasing test scores. The concern is particularly important for long-term follow-ups. Over a 10-15 year time horizon, channels that appear secondary in the short run (a shift in self-concept, a change in parental investment, or new peer networks) may add up to meaningful effects on adult outcomes. This is why we have to look carefully now, at the point of study selection, at how the programmes worked.
A related challenge applies within the learning channel itself. Several candidate interventions moved both literacy and numeracy. Numeracy was typically a secondary outcome domain, often with smaller effects particularly where the intervention was targeted at reading or language. But if we instrument for literacy alone, we may overstate the return to literacy where numeracy also contributes to adult outcomes. How to pool information across studies that measure different cognitive skills domains, and which use different measures within the same domain, are related questions that we are working on in our meta-analysis modelling.
4.1. A classification of intervention types
Because the exclusion restriction cannot be tested, it must be argued case by case. A desire to keep that argument open is why we keep all eligible studies in the candidate set with a flag for exclusion-restriction concern, rather than filtering them out at the screening stage. The classification below is a rough guide to plausibility, not a pass/fail screen.
Stronger exclusion restriction claims. Narrow, pedagogical interventions whose effects on adult outcomes plausibly run through what children learned.
- Teaching at the Right Level (TaRL). Reorganises classroom time so instruction matches the child's level. The alternative channels (extra adult contact, altered peer composition during TaRL sessions) appear small relative to the learning channel.
- Structured pedagogy and scripted lessons. Deliver instructional content directly, with later effects plausibly stemming mainly from acquired skills rather than institutional or resource changes.
- Tracking by ability. The primary mechanism is targeting instruction, although changes in peer-composition may introduce secondary channels.
Moderate exclusion restriction claims. Learning is likely central, but additional pathways are more plausible.
- Teacher performance pay. Likely works primarily through changes in teacher effort and instructional quality. More engaged teachers may also change classroom culture, aspirations or student behaviour.
- Targeted remedial support. Close to TaRL when narrowly instructional but broader remedial programmes or clubs may bundle mentoring, transfers, nutrition or psychosocial support.
Weaker exclusion restriction. Multiple plausible pathways to adult outcomes beyond measured learning gains.
- School-market reforms. Change the structure of the local schooling market (entry, exit, fees), with effects potentially working through years of schooling and household spending.
- Public-private partnership management. Bundles more funding, more teachers, longer days, and different management. Test-score gains come out of a package that also changes resources and school culture.
- District management reforms. Change governance, resource allocation, teacher deployment, and infrastructure. Effects may diffuse across many margins, of which learning is only one.
- Enrolment drives. Primarily affect school participation rather than learning. As a result, estimated adult returns may reflect a broader effect of increased schooling exposure, credentials, or socialisation, rather than the return to measured learning alone.
5. Next steps
The Initiative is now investing in the operational steps that the most promising candidates point to. Full-scale tracking is in preparation for Ghana TCAI (Study_ID 25 in Table 4) and Uganda Read to Learn (Study_ID 24). A feasibility pilot is underway for India Uttar Pradesh TaRL In-School Camps (Study_ID 12). Beyond those, we are pursuing data access and principal investigator engagement for the rest of the most promising candidates, in the hope that we can identify the next wave of feasibility pilots to take place next year.
This Initiative is one of several efforts in this space. The 2025 blog discussed related work on LEAPS (Pakistan), the Gambia and Guinea-Bissau, Northern Uganda, and South Africa.
This Note accompanies the release of the Candidate Studies Dataset.[vii] The data dictionary exists in that file. Readers who want to extend or reuse the screening can start from those published files.
Appendix A. How we identified candidate studies (in detail)
This is a structured candidate search with the goal to define the universe of studies eligible for long-run follow-up, and transparent documentation of every inclusion and exclusion decision.
A.1. Sources
Source 1. Reviews and curated study lists. The primary source pool was built by extracting all cited studies from eleven reviews and two study lists. The reviews are (in alphabetical order): Angrist et al. (2025), Conn (2017), Evans and Mendez Acosta (2021), Evans and Popova (2016), Evans and Yuan (2022), Ganimian and Murnane (2016), Glewwe et al. (2013), Glewwe and Muralidharan (2016), Kremer et al., (2013), McEwan (2015), Snilstveit et al., (2015). The two study lists are the GEEAP (2023) systematic search and the list of education studies included in Bertling et al. (2023). Together, these gave a starting pool of 2,035 citation records. After deduplication against metadata from OpenAlex, Semantic Scholar, and CrossRef, and manual checks (in that order of priority), 1,056 unique studies remained for screening.
Source 2. Additional targeted lists. Four further sources were reviewed for two reasons. First, to preserve earlier work assembled for this and related Initiatives (the original CGD list, 2024; Stern et al., 2023). Second, to catch earlier EGRA-based studies originally published as technical reports (Crawford et al., 2024; Sandefur et al., 2024). Together, these contributed an additional 8 studies to the identified set.
A.2. Screening criteria
A study was excluded if it met any of the criteria in Table 5.
Table 5. Exclusion criteria and their associated codes
| Code | Type | Criterion |
|---|---|---|
| E1 | Publication status | Not published in a peer-reviewed journal. Working papers, reports, & grey literature are excluded from Source 1. |
| E2 | Experimental design | Not a randomised or quasi-experimental design. RDD and DiD acceptable; PSM-only and observational studies excluded. |
| E3 | Individual-level sample | Not evaluated at the individual level. Outcomes evaluated as school-level aggregates or higher levels are excluded. |
| E4 | Education level | Not delivered in primary or middle school. Interventions in pre-primary programmes, secondary or higher levels are excluded |
| E5 | Country income level | Not conducted in a low- or middle-income country. This is based on World Bank classification at the time of intervention. |
| E6 | Outcome domain | No literacy, language or reading outcome. Studies that focus on only other subjects, or other non-cognitive skills are excluded. |
| E7 | Alternative pathways | Intervention is designed to directly affect health, nutrition, resources or other conditions in addition to learning. |
| E8 | Cohort age | Participants’ average age is not 20 or greater, in 2027. |
| E9 | Sample size | Sample is not at least: 30 clusters per arm (60 total) in cluster-randomised trials, or; 500 persons in individually randomised trials. |
A.3. Reading the exclusion-code counts
The exclusion-code counts in the Candidate Studies Dataset are not mutually exclusive categories. Screening uses a fail-once-and-out rule. Once a study fails on any criterion, it is excluded and need not be screened on the remaining criteria (except where we were able to screen on multiple codes at once in which case we report multiple codes). The criteria were applied in an order chosen for screening efficiency, so the code counts reflect that ordering, not the distribution of reasons studies would fail if every criterion were applied to every study.
References
Andrews, I., Stock, J. H., & Sun, L. (2019). Weak Instruments in IV Regression: Theory and Practice. Annual Review of Economics, 11, 727–753. https://doi.org/10.1146/annurev-economics-080218-025643
Angrist, N., Evans, D., Filmer, D., Glennerster, R., Rogers, H. & Sabarwal, S. (2025). How to Improve Education Outcomes Most Efficiently? A Review of the Evidence Using a Unified Metric. Journal of Development Economics, 172 (January). https://doi.org/10.1016/j.jdeveco.2024.103382.
Bertling, M., Singh, A., & Muralidharan, K. (2023). Psychometric Quality of Measures of Learning Outcomes in Low- and Middle-Income Countries. CGD Working Paper 638. Washington, DC: Center for Global Development.
Bloom, H. S., Hill, C. J., Black, A. R., & Lipsey, M. W. (2008). Performance Trajectories and Performance Gaps as Achievement Effect-Size Benchmarks for Educational Interventions. Journal of Research on Educational Effectiveness, 1(4), 289–328. https://doi.org/10.1080/19345740802400072
Conn, K. M. (2017). Identifying Effective Education Interventions in Sub-Saharan Africa: A Meta-Analysis of Impact Evaluations. Review of Educational Research, 87(5), 863-898. https://doi.org/10.3102/0034654317712025
Crawford, M., Raheel, N., Korochkina, M., & Rastle, K. (2024). Inadequate Foundational Decoding Skills Constrain Global Literacy Goals for Pupils in Low- and Middle-Income Countries. Nature Human Behaviour, 9, 74-83. https://doi.org/10.1038/s41562-024-02028-x
Evans, D. K., & Mendez Acosta, A. (2021). Education in Africa: What are we learning?. Journal of African Economies, 30(1), 13-54. https://doi.org/10.1093/jae/ejaa009.
Evans, D. K., & Popova, A. (2016). What really works to improve learning in developing countries? An analysis of divergent findings in systematic reviews. The World Bank Research Observer, 31(2), 242-270. https://doi.org/10.1093/wbro/lkw004.
Evans, D. K., & Yuan, F. (2022). How Big Are Effect Sizes in International Education Studies? Educational Evaluation and Policy Analysis, 44(3), 532-540. https://doi.org/10.3102/01623737221079646
Ganimian, A. J., & Murnane, R. J. (2016). Improving Education in Developing Countries: Lessons from Rigorous Impact Evaluations. Review of Educational Research, 86(3), 719-755. https://doi.org/10.3102/0034654315627499
GEEAP (Global Education Evidence Advisory Panel). (2023). GEEAP Database: Global Education Evidence Advisory Panel Study List. Washington, DC: World Bank. https://docs.google.com/spreadsheets/d/1wGMn2g5jUDtkYUKydxqlcEklIGT5wlk4/edit
Glewwe, P., Hanushek, E. A., Humpage, S. D., & Ravina, R. (2013). School Resources and Educational Outcomes in Developing Countries: A Review of the Literature from 1990 to 2010. In P. Glewwe (Ed.), Education Policy in Developing Countries (pp. 13-64). Chicago: University of Chicago Press. https://doi.org/10.7208/chicago/9780226078854.003.0002
Glewwe, P., & Muralidharan, K. (2016). Improving Education Outcomes in Developing Countries: Evidence, Knowledge Gaps, and Policy Implications. In E. A. Hanushek, S. Machin, & L. Woessmann (Eds.), Handbook of the Economics of Education (Vol. 5, pp. 653-743). Amsterdam: Netherlands. https://doi.org/10.1016/b978-0-444-63459-7.00010-5
Huntington-Klein, N. (2021). The effect: An introduction to research design and causality. Chapman and Hall/CRC.
Kraft, M. A. (2020). Interpreting Effect Sizes of Education Interventions. Educational Researcher, 49(4), 241-253. https://doi.org/10.3102/0013189X20912798
Kremer, M., Brannen, C., & Glennerster, R. (2013). The challenge of education and learning in the developing world. Science, 340(6130), 297-300. https://doi.org/10.1126/science.1235350
McEwan, P. J. (2015). Improving Learning in Primary Schools of Developing Countries: A Meta-Analysis of Randomized Experiments. Review of Educational Research, 85(3), 353-394. https://doi.org/10.3102/0034654314553127
Rossiter, J., Evans, D. K., Hares, S., & Henny, C. (2026). The Illusion of Comparability Among Standardised Effect Sizes: Why Education Evaluations Should Report Raw Effects. CGD Working Paper 748. Washington, DC: Center for Global Development.
Sandefur, J., Alvares de Azevedo, T., Ju, X., & Le, T. (2023). Phonics and Foreign Aid: Can America Teach the World to Read? CGD Working Paper 668. Washington, DC: Center for Global Development.
Snilstveit, B., Stevenson, J., Phillips, D., Vojtkova, M., Gallagher, E., Schmidt, T., Jobse, H., Geelen, M., Pastorello, M., & Eyers, J. (2015). Interventions for Improving Learning Outcomes and Access to Education in Low- and Middle-Income Countries: A Systematic Review. 3ie Systematic Review 24. London: International Initiative for Impact Evaluation. https://doi.org/10.23846/srs007
Staiger, D. & Stock, J. H. (1997). Instrumental Variables Regression with Weak Instruments. Econometrica, 65(3), 557–586. https://www.jstor.org/stable/2171753
Stern, J., Jukes, M., DeStefano, J., Mejia, J., Dubeck, P., Carrol, B., Jordan, R., Gatuyu, C., Nduku, T., Van Keuren, C., Punjabi, M. and Tufail, F. (2023). Learning at Scale: Final Report. Research Triangle Park, NC: RTI International.
[i] This link lists 39 studies because we added and removed a few over the first year of the project.
[ii] The Candidate Studies Dataset is available on the Center for Global Development website: https://www.cgdev.org/sites/default/files/RTL-Candidate-Study-Dataset-July-2026.xlsx.
[iii] In several cases, one intervention led to an evaluation report and, later, an academic publication. In these cases we retain the publication, unless it answers a substantively different research question.
[iv] Note that the significance requirement means the threshold is not only about magnitude. A study with an effect of 0.12 SD that fails to reach significance at the 10 percent level because of a small sample would be excluded under this rule, even though the point estimate exceeds 0.10 SD.
[v] Selecting a study for follow-up does not mean following up every treatment arm. It usually means choosing a subset of arms in close collaboration with the original PIs, and the Candidate Studies Dataset records every arm to support those decisions.
[vi] In addition to testing the first stage F-Statistic, we investigate whether an anticipated long-run effect is biased in estimation. We have done this via simulation for “Active” projects, comparing the empirical estimate γ̂ with the true value drawn in the data-generating process, γ. The goal here is to rule out any systematic over- or underestimation of the true effect.
[vii] The Candidate Studies Dataset is available on the Center for Global Development website:https://www.cgdev.org/sites/default/files/RTL-Candidate-Study-Dataset-July-2026.xlsx.
Topics
CITATION
Crawfurd, Lee, David Evans, Jack Rossiter, and Yi Ning Wong. 2026. Identifying Studies for the Return to Learning Initiative: An Updated Candidate Studies Dataset. Center for Global Development.DISCLAIMER & PERMISSIONS
CGD's publications reflect the views of the authors, drawing on prior research and experience in their areas of expertise. CGD is a nonpartisan, independent organization and does not take institutional positions. You may use and disseminate CGD's publications under these conditions.
Thumbnail image by: GPE/Mrutu (Trans.Lieu)