

Recommended

DATA VISUALIZATION
Blog Post
Trade Policy Uncertainty Under Trump

US-imposed tariffs have been a rollercoaster since early 2025, creating considerable uncertainty about the policy's direction and its effects worldwide. Country-specific tariffs—the so-called reciprocal tariffs—reached unprecedented levels in April 2025 and have since been adjusted numerous times. At the same time, product-specific tariffs ranging from steel and aluminum to lumber products—and ever-changing exemption lists—have further complicated efforts to understand the overall tariff burden a country faces. CGD’s Tariff Tracker sheds light on this issue by estimating the Effective Tariff Rate (ETR), namely the tariff a country faces after adjusting for product-specific tariffs and exemptions.Price increase of 1.2% since April 2025
But information on the ETR alone is not enough to understand how tariffs are affecting trade flows between the US and its trading partners, or how their effects vary across industries and countries. To help fill this gap, CGD is launching the US Import Prices and Trade Flows Monitor as a complement to the Tariff Tracker.Price increase of 1.2% since April 2025
The Monitor presents timely data on the evolution of US import prices for the products countries export to the US and the value of those exports, in a format suitable for analysis. Although the Monitor is not designed to establish the causal effects of US tariff policies, it provides researchers and policymakers with a basis for identifying emerging patterns and formulating hypotheses about how a rapidly changing tariff environment affects trade flows, export competitiveness, and the incidence of tariff costs across countries and industries.
Unlike most dashboards that track aggregate trade flows and import prices for a handful of countries, the Monitor covers nearly all countries and drills down to the product level, combining US import price changes with country-specific import value changes for specified goods in which the US market matters most to exporters.
This note is organized as follows. In Section I, we present the Monitor’s methodology. In Section II, we discuss four use cases. The first three shed light on US tariff incidence on exporters; the last illustrates how product-level import value data can help identify differences in export performance across countries and industries after tariffs are imposed. These examples explore the Monitor's usefulness and limitations. Section III concludes.
I. Methodology
The Monitor is designed to help users explore two broad questions.
1. How are countries’ export prices to the US evolving following changes in US tariff policy?
To inform this question, the Monitor uses detailed import price data from the US Bureau of Labor Statistics (BLS), which measures prices at the US border. Since BLS import price indexes exclude tariffs, changes in these prices can help identify whether prices adjust in response to changes in US tariff policy—an important input to broader assessments of who ultimately bears the cost of tariffs. Although US importers legally pay tariffs at the border, the ultimate economic burden depends in part on how prices adjust following their imposition.
There are three key methodological considerations:
Country-level price data are limited. BLS provides country-specific import price indexes for only a small number of large economies, and at relatively broad levels of the North American Industry Classification System (NAICS). The Monitor instead uses BLS import price indexes at the four-digit level of the Harmonized System (HS4). There is a trade-off between the two approaches. The HS4 indexes are generally not country-specific, but they provide much greater product detail and can be used for nearly all countries. This is important for the purposes of the Monitor because products within the same broad industry can face different tariff treatment and can also be affected by different market conditions. Using HS4 also allows prices to be matched directly with the country-level trade and tariff data used in the Monitor.
The Monitor therefore assumes that most countries are price takers—that is, they are too small to materially influence the overall US import prices of the products they export. Since country-specific price data are generally not available, the BLS im port price index for each product is used as a proxy for the price movements facing exporters to the US. This assumption does not imply that exporters cannot adjust their own prices in response to tariffs or other changes in market conditions. When country-specific unit-value data are available, they can provide additional information on whether these adjustments are taking place.
Price changes may reflect factors other than tariffs. Changes in import prices reflect global supply and demand conditions, exchange rates, changes in the composition of imports, and other factors in addition to tariffs. Therefore, the Monitor does not attribute a decline in the BLS price index following a tariff increase as evidence, by itself, that the tariff is being absorbed by exporters
To help assess the evidence, the Monitor indicates the tariff status of each product and, where possible, allows comparisons between tariffed and exempt or partially exempt within the same broad product category. Those comparisons are most useful when the products are sufficiently similar to face similar market conditions.
- The analysis focuses on products for which the US is an important export market. For each country, the Monitor includes products for which the US accounts for a significant share of exports, focusing on products where changes in US trade policy are most likely to matter.
Based on these assumptions, for each country, the Monitor’s price section shows the evolution of US import price indexes for products for which the US is an important export market, distinguishing between tariffed and exempt products based on US tariff measures.
2. How are US imports from different trading partners changing following the announcement and imposition of tariffs?
Changes in the value of US imports can provide insights into how trade flows are evolving following actual and anticipated changes in US tariff policy. The Monitor examines these changes at both the country and country-product (HS4) levels. Country-level data provide a broad view of how bilateral trade flows are evolving among trading partners. In contrast, country-product data let users examine how imports of specific products from individual countries change over time. Because import values reflect movements in both prices and quantities, these data complement the Monitor's analysis of import prices. To examine these trends, the Monitor follows cumulative year-on-year changes in the value of US imports using data published by the US Census Bureau.
The Monitor is a tool for tracking developments rather than establishing the causal analysis of US tariff policy. Changes in import prices and trade flows may reflect tariff effects. But they may also be influenced by other factors, including exchange rate movements, commodity prices, changes in demand, supply chain disruptions, and other policy developments. The Monitor is intended to help identify emerging patterns and inform further analysis, rather than attribute observed changes to tariffs alone. Details on data sources, thresholds, and formulas can be found in the Monitor.
II. What the Monitor can and cannot tell us: Examples
The following examples illustrate the Monitor’s usefulness as well as its limitations. The first three focus on the use of price data and the fourth on import value data.
The debate over the incidence of tariffs remains unsettled. While several studies argue that the 2025 tariffs were largely absorbed by US importers, a recent study claims that foreign exporters absorbed about 40 to 50 percent of the tariffs. As stated above, a decrease (increase) in a product’s US import price following the imposition of tariffs cannot, on its own, be taken as evidence that the tariff is being absorbed by the exporter (importer). Many other factors can influence price dynamics, and three of the examples below illustrate this point. The examples also show how other variables and information can be combined with BLS price data to help assess the incidence of tariffs on exporters.
The last example uses the import value data from the Monitor to help assess differences in export performance across countries following the imposition of tariffs.
1. Fruit import prices: Their decline cannot be interpreted as proof of tariff absorption by exporters
The US import price of fruit and vegetable juices has declined by about 15 percent since the tariffs were imposed in April 2025. As reflected in the Monitor, HS 2009—the 4-digit Harmonized System code for fruit and vegetable juices—shows that this product category is exported by many countries in Africa, Asia, and Latin America. All components in the fruit juice category were tariffed from April 5 to early November 2025. On November 12, some of the components in this category were exempted from the tariffs, but 57 percent of the HS 2009 US import value remained tariffed.
Can we assert that the decline in prices proves that the exporters of fruit and vegetable juice to the US were absorbing the tariffs? Not really. The behavior of prices only tells us that this is a possibility, but it does not offer full validation. To properly answer this question, we need to consider the market conditions for this product category, which means identifying both the composition of products within HS 2009 and the composition of its exporters; for that, we need to look beyond the Monitor. Based on US import data from the World Integrated Trade Solution (WITS), one product stands out: orange juice. Accounting for over 40 percent, orange juice is a major component of HS 2009.
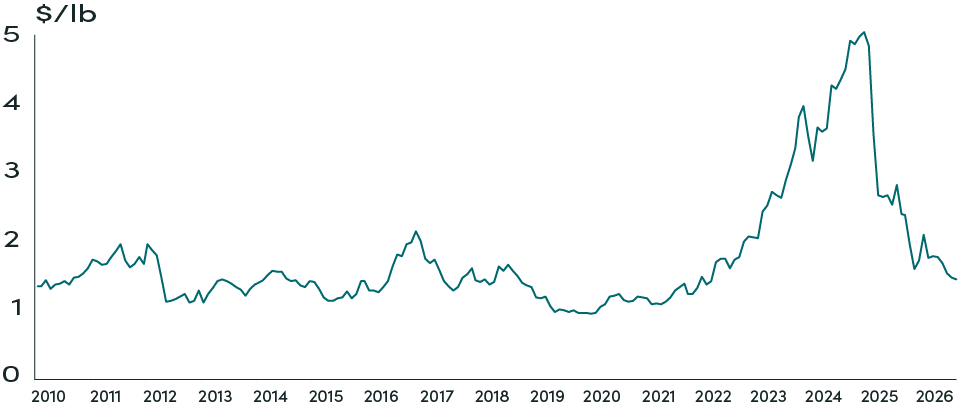
Developments in the global orange juice market have been notable since 2023, well before the imposition of tariffs. Major supply shortages associated with poor crops in Brazil and Florida led to sharp spikes in international orange juice prices in 2023-2024 (Figure 1). By January 2025, futures prices reached a record high of roughly $5.15/lb. As production and inventories recovered, world supply conditions eased, pressing prices down. In short, drastic shifts in supply-demand conditions were at the heart of international orange juice prices over the last few years.
Figure 1. Orange juice, frozen concentrate, first-position futures
Source: Commodity Origins
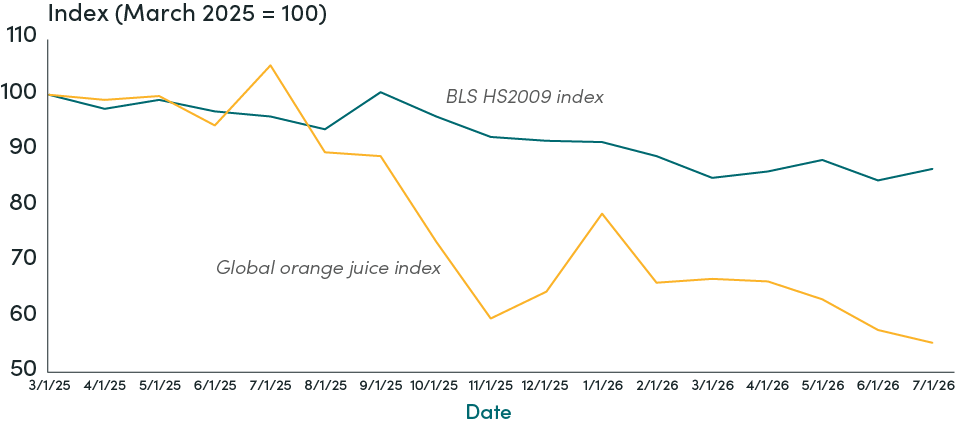
Figure 2 compares HS 2009 prices with global orange juice futures prices, the latter using New York FCOJ futures, the world benchmark contract for the global frozen concentrated orange juice market.
Figure 2. Fruit juice import price and global orange juice prices
Source: Monitor (BLS data) and ICE Futures US
The decline in the price of HS 2009 after April 2025 cannot, therefore, be attributed solely to exporters’ response to tariffs. Instead, it appears that the decline reflected a much broader collapse in international orange juice prices, the category’s major component. As the figure shows, the global decline in orange juice prices was much larger than the decline in the aggregate HS 2009—45 percent from March 2025 to July 2026. This suggests that the prices of other fruit juice components in HS 2009 were increasing rather than declining. Moreover, the prices of HS 2009 and orange juice continued to fall after November 2025, when orange juice and other components of HS 2009 were exempted from the tariffs.
In short, because sharp swings in global market conditions were major factors affecting the international price of orange juice—the largest component of HS 2009—it is plausible that global supply conditions, rather than tariffs, were the main driver of the HS 2009 price decline. This does not imply that tariffs had no effect at all on fruit-juice border prices, but establishing a potential effect requires a formal econometric analysis.
2. Steel-derivatives import prices: Suggestive evidence of some exporters’ price adjustments after tariffs
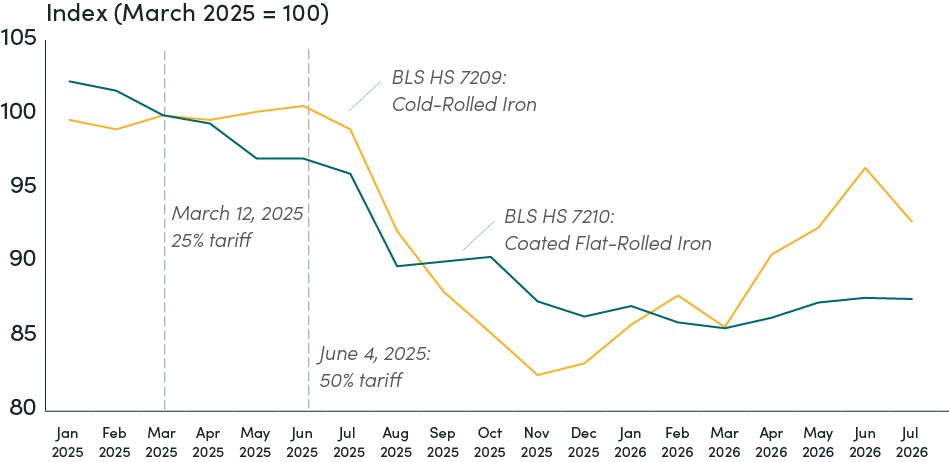
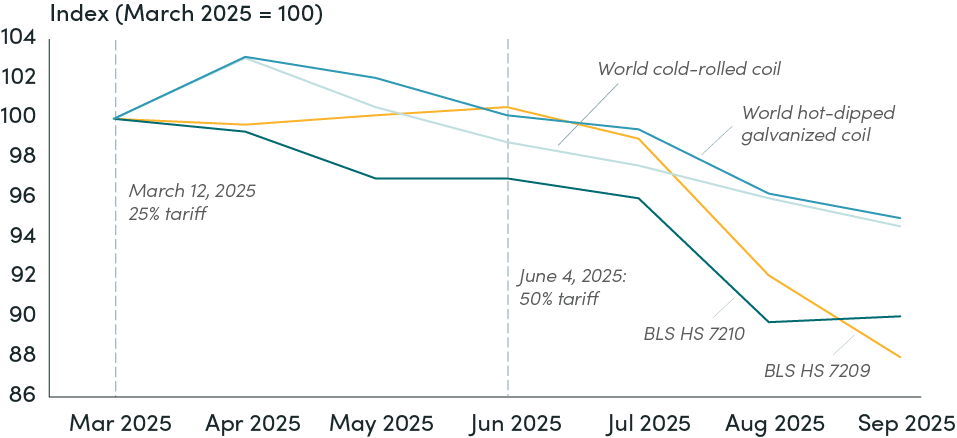
Raw steel and most steel derivative products have faced some of the largest tariffs since the beginning of 2025. They were subject to a 25 percent rate from March 12, 2025. The rate was increased to 50 percent on June 4 and has remained at that level.
As shown in the Monitor, two steel products—HS 7209 (cold-rolled flat-rolled iron or non-alloy steel) and HS 7210 (plated or coated flat-rolled iron or non-alloy steel)—experienced a significant decline in US border prices during most of 2025 and increased again in 2026 (Figure 3). As the Monitor also shows, countries that direct more than 10 percent of these products’ exports to the US include Mexico, Canada, New Zealand, Australia, Cambodia, Brazil, South Korea, Thailand, Taiwan, and Vietnam.[1]
Figure 3. US Import-Price Indexes for HS 7209 and HS 7210
Source: Monitor (BLS prices)
As with the discussion above on fruit juice, it is useful to compare the behavior of the prices of these two products with their corresponding world benchmarks during the after-tariff period, when prices were declining (April-September 2025.
Figure 4 shows this comparison using MEPS World Carbon Steel Price Indexes, which provide close comparators to HS 7209 and HS 7210. These global prices declined during the period, and there is well-documented evidence of excess capacity in these industries (OECD 2025 and 2026), putting downward pressure on international steel prices.
Figure 4. US border prices fell more than the corresponding world benchmarks
Source: Monitor (BLS prices) and MEPS International
But the figure also shows that US border prices fell more than the world benchmarks. This suggests that factors beyond general global conditions were influencing US border prices. One plausible explanation is a partial incidence of tariffs on some exporters, who were willing to decrease their pre-tariff price in order to maintain purchases from US importers. Reports from South Korea’s Trade Association support this possibility, noting reductions in Korean steel export unit values to the United States following the imposition of tariffs.
The Monitor also reveals that the value of US imports of these products from most trading partners declined during 2025 and 2026. For 2026, this indicates a reduction in the volume imported since, as shown above, prices recovered that year.
Thus, as with the orange juice example, the Monitor produces important insights but cannot claim causality regarding the effects of tariffs. Additional data, information, and analysis are needed to reach conclusions.
3. Bangladesh textiles: Combining BLS import prices and customs unit values data provides valuable information about tariff absorption
Multiple business and press reports claim that Bangladesh exporters of apparel to the US lowered their prices after the imposition of tariffs in an effort to maintain market share, implying that exporters were absorbing part of the tariffs. Here, we use the case of HS 6206—women’s blouses, shirts and shirt-blouses, not knitted or crocheted—to shed light on that discussion.
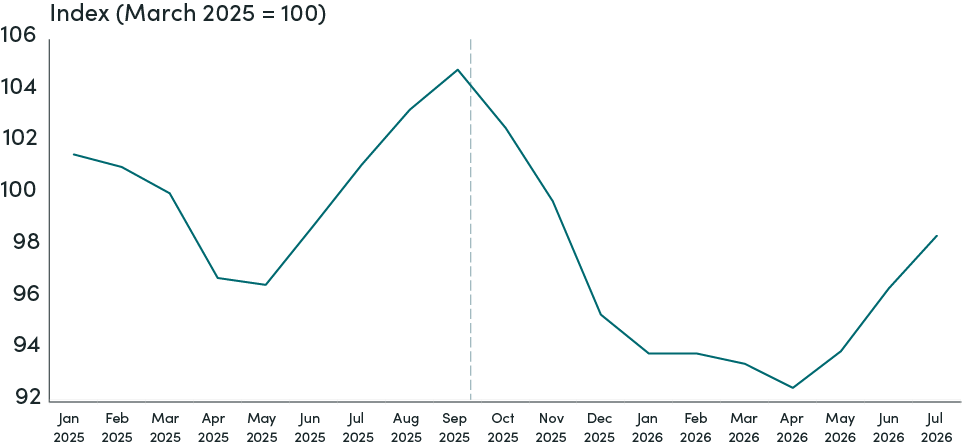
We start with the BLS US import price index for this product, an all-origin price index that does not provide country-specific data. Figure 5 shows the behavior of these prices. Interestingly, the pattern is consistent with importers’ frontloading, meaning the increase in US imports after the announcement of tariffs but before their actual implementation. As the figure shows, consistent with an increase in demand, prices rose from May (following the April announcement) through September 2025 (tariffs took effect in August), then declined for the rest of the year and into early 2026.[2]
Figure 5. US Import Price Index: Women’s woven shirts (HS 6206)
Source: Monitor (Based on BLS data)
The decline in HS 6206 after August 2025 provides the first signal of possible tariff absorption by exporters. However, the change in prices may reflect many factors besides changes in tariffs—such as changes in the price of raw materials, exchange rate movements, and excess capacity—and they are not country-specific. Moreover, in contrast to the two cases discussed above—orange juice, cold-rolled iron and hot-dipped galvanized coil—women’s apparel are not commodities traded on a financial exchange. There is not a world price reflecting global developments and, therefore, there is no global benchmark against which to compare the US import price for this product.
However, further insights into the question of tariff incidence on exporters can be obtained by assessing customs unit values, which are country-specific and published by the US International Tade Commission (USITC) DataWeb.
Bangladesh is a good example for this exercise because it is one of the largest exporters of HS 6206, among the numerous countries that export this product to the US, including many low-income ones. HS 6206 was never exempted from tariffs, and Bangladesh faced a reciprocal tariff rate of 20 percent from August 2025 to January 2026.
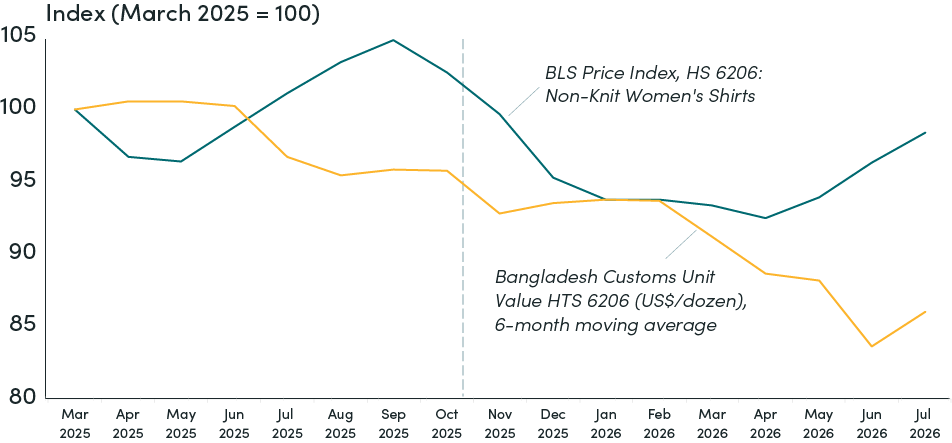
Figure 6 compares BLS prices with corresponding customs unit values. The customs unit values series is smoothed to reduce volatility from month-to-month changes in the mix of different products within the HS6206 category—changes that affect the average unit value even if individual transaction prices do not change. Unlike BLS price indexes, which directly follow US border prices, customs unit values are not prices; they are constructed from trade aggregates—customs values divided by physical quantity.
Figure 6. Women’s woven shirts and blouses: BLS prices and Bangladesh’s customs unit values
Source: Monitor (BLS prices) and USITIC
During the period of interest, Bangladesh’s customs unit values declined, and the reduction was larger than the corresponding decline in BLS prices, consistent with a plausible tariff absorption by Bangladesh’s exporters. Since customs unit value declined from April 2025, this variable does not provide evidence of US importers frontloading from Bangladesh—in contrast to the suggestive evidence from BLS prices across all import sources.
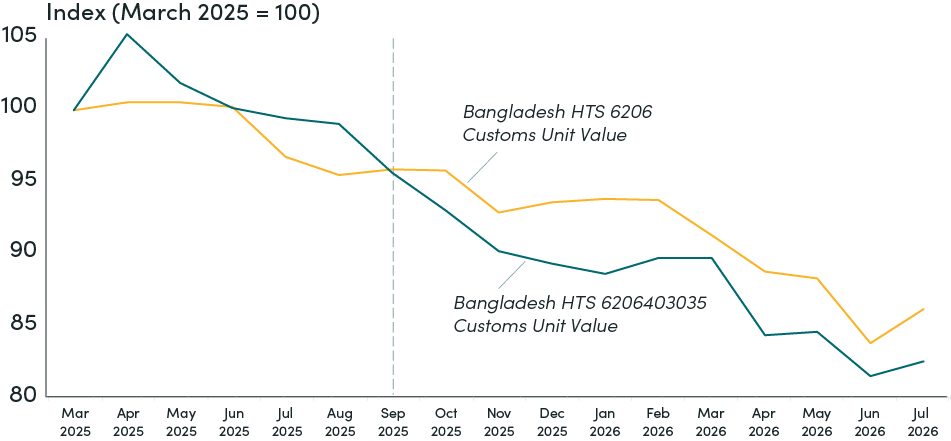
Could the decline in customs unit values result from a drop in cotton prices, a main input into this BLS aggregate? Most likely it played a role since cotton prices declined, albeit slightly. To shed light on this point, Figure 7 shows the behavior of customs unit values for a component of women’s woven shirts and blouses that does not use cotton as an input: women’s shirts and blouses of man-made fibers, not knitted, identified as HTS 6206403035. As the figure shows, price movements in the broader and narrower product categories are similar, with the non-cotton product displaying even larger declines in the latter part of the period.
Figure 7. Bangladesh customs unit values: Women’s shirts and blouses made with and without cotton (US$/dozen, 6-month moving average)
Source: USITIC
Taken together, there is suggestive evidence of some incidence of tariffs on Bangladesh exporters of these particular products. But this is only suggestive; as stressed above, it by no means implies the presence of causal evidence. Rigorous research is needed to establish causality.
4. Country comparisons using the Monitor: Same tariffs, different outcomes across China’s competitors
It is well documented that high tariffs on China have spurred US imports from competing exporters, particularly in Asia. This trade diversion began after the 2018-19 episode of tariffs imposed by the Trump administration and received renewed impetus following the current, ongoing episode. In both episodes, the large tariff differential between China and its competitors created strong incentives for trade diversion. As noted in a previous CGD note, the data also suggest that US importers perceive high tariffs on China as credibly persistent, increasing their incentives to reduce imports from this country.
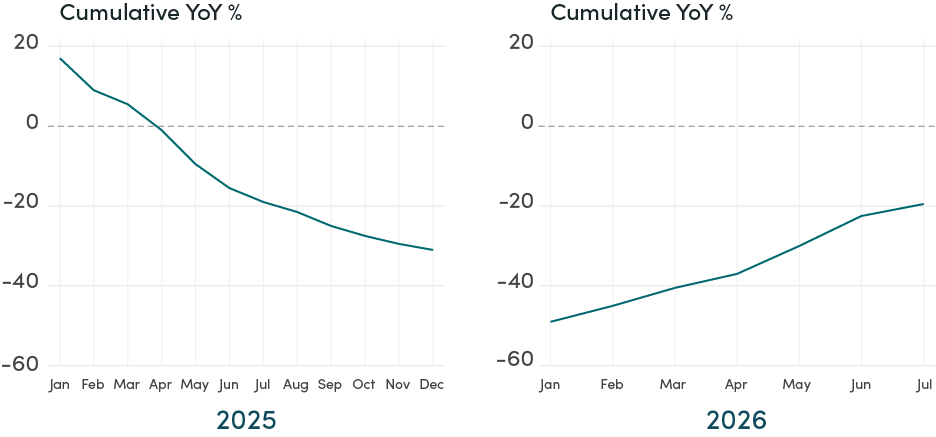
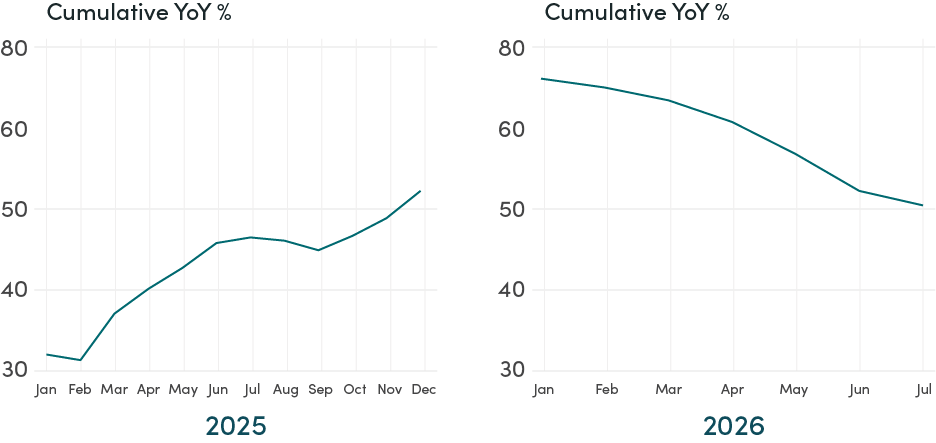
Figures 8 and 9 show the evolution of US imports from China and the aggregate of four of its Asian competitors: Vietnam, Thailand, Taiwan, and Indonesia.
Figure 8. US Imports from China—cumulative YoY %
Source: CGD Monitor (based on US Census)
Figure 9. US Imports from China’s competitors—cumulative YoY %
Source: CGD Monitor (based on US Census)
Data in Figure 8 is taken directly from the Monitor and shows the sharp decline in US imports from China. Since the imposition of additional tariffs on China that started in February 2025 and escalated in April of that year, the cumulative year-on-year change in US imports from China started to decrease and was in deep negative territory by the end of 2025. Imports from China continue to decline sharply in 2026. The upward movement in the graph from about -49 percent in January to -20 percent in July is largely explained by base effects, since the most recent comparisons are against the very depressed 2025 levels.
Figure 9 illustrates trade diversion. This pattern accelerated during 2025, and by December the cumulative year-on-year change in US imports from China’s competitors reached about 53 percent. Trade diversion continued in 2026, with cumulative year-on-year changes above 60 percent at the beginning of the year. Although the pace has moderated, the cumulative rate was still about 50 percent in July.
Aggregates, however, disguise very different behavior across industries and countries. While aggregate import growth from China’s competitors has remained high, it does not mean that all industries in all countries have been successful. The Monitor is well suited to identify country-industry differences because it provides product-level data on import values, prices, and tariff status.
To illustrate the relative strength of industries across countries following the imposition of tariffs, we focus on sector-specific tariffs (Section 232 tariffs in the US trade code). Unlike country-specific tariffs, which have changed dramatically in the last two years, sector-specific tariffs have also changed, but far less so.
Table 1 presents the cumulative year-on-year change in US imports for auto parts (HS 8708) and iron pipes (HS 7307) from these countries.
Table 1. Auto parts and pipe fittings of iron or steel: US imports from Vietnam, Thailand, Taiwan, and Indonesia
| Product | Country | Share of Exports to the US (2024) | Tariff rate (section 232) | US Imports—Cumulative YoY % | Pattern | ||
|---|---|---|---|---|---|---|---|
| Dec-24 | Jan-26 | Jul-26 | |||||
| Auto Parts (HS8708) | Price increase of 1.2% since April 2025 | ||||||
| Thailand | 17.0% | 25% | +16.7% | +33.8% | +23.9% | Sustained growth after tariff | |
| Vietnam | 26.0% | 25% | +6.4% | +56.1% | +41.0% | Sustained growth after tariff | |
| Taiwan | 54.8% | 25% | +1.3% | -11.3% | -13.1% | Sustained decline after tariff | |
| Pipe Fittings of Iron or Steel (HS 7307) | Price decline of -3.7% since April 2025 | ||||||
| Thailand | 30.3% | 48% | +19.2% | +86.1% | +61.6% | Sustained growth after tariff | |
| Vietnam | 43.6% | 46% | -1.7% | +11.8% | +1.6% | Initial increase, but faded | |
| Indonesia | 18.3% | 50% | -20.3% | +28.9% | +2.7% | Initial increase, but faded | |
| Taiwan | 47.4% | 47% | -4.1% | -13.7% | -9.3% | Contraction preceded tariff | |
The table shows significant differences in the behavior of US imports from these countries. For example, the cumulative year-on-year change in US imports of auto parts differs significantly between Vietnam, Thailand, and Taiwan. All faced the same tariff during most of the period.[3] However, Vietnam’s and Thailand’s exports to the US have grown rapidly since the imposition of tariffs, displacing China[4]. In contrast, US imports from Taiwan contracted for most of the post-tariff period. This is notable given the large share of Taiwan’s exports directed to the US in 2024.
BLS prices for this product did not change significantly over the period, providing no indication of tariff absorption by exporters. Instead, evidence suggests a decline in Taiwan’s production of these products. Reports indicate that the competitive structure of Taiwan’s exports played a role. Taiwan's auto parts industry is concentrated in collision repair parts, such as bumper covers, lighting assemblies, and sheet metal. These are commodity-like parts with many alternative suppliers, making Taiwan more price-sensitive than Thailand or Vietnam, which export more specialized components with fewer alternative suppliers.
Exports of pipe fittings of iron or steel to the US show an even more dispersed behavior across countries. All countries experienced the same tariff rate on this product, but while Thailand benefitted from large growth in its exports to the US, Taiwan experienced a contraction. Vietnam and Indonesia showed an initial spurt of growth (from flat or depressed levels), but that expansion faded in 2026.
As in the auto parts example, Thailand’s high capacity and lower production costs allowed it to meet orders, even with high tariffs, taking full advantage of US importers’ trade diversion away from China. In sharp contrast, Taiwan’s exports of iron/steel pipe fittings to the US were already declining in 2024, and with the information at hand, it is not possible to determine whether the accelerated decline in 2026 reflects the tariffs or a continuation of pre-existing trends. Vietnam’s and Indonesia’s initial gains are consistent with trade diversion from China following the imposition of tariffs. However, the subsequent deceleration to close-to-zero growth suggests that neither country had sufficient capacity to sustain the increased orders.
By looking at specific products across countries and combining information on import growth, prices, and tariff status, the Monitor helps identify which countries are genuinely competitive and which are simply benefiting from temporary trade diversion or favorable tariff treatment.
III. Conclusion
The examples in this note illustrate the analytical value of the CGD US Import Prices and Trade Flows Monitor. By combining product-level data on import prices, trade flows, and tariff status, the Monitor helps identify patterns beyond what aggregate statistics can show. The same tariff can produce very different outcomes across countries and industries, and the Monitor is well-suited to reveal those differences. It can also signal whether import price movements are consistent with tariff absorption by exporters, which is an important and still open question in the literature.
At the same time, the Monitor is a starting point, not an endpoint. Separating tariff effects from other factors—global market conditions, exchange rates, productive capacity — requires additional data and more rigorous analysis. But that is precisely what the Monitor is designed to support: helping researchers and policymakers identify the right questions to ask in a rapidly changing tariff environment.
[1] Although the US imports steel products heavily from South Korea, the US share of South Korea’s exports of these products is less than 10 percent and is therefore not included in the Monitor.
[2] Price behavior for fruit juices and steel derivatives does not indicate frontloading. However, this does not mean frontloading did not occur. If it did, the downward pressure on prices from global supply factors more than offset upward pressures from US importers' frontloading.
[3] In May 2026, the US administration reduced Taiwan’s tariffs on these products to 15 percent. Taiwan exports of auto parts to the US, however, continued to decrease.
[4] Thailand's exports of auto parts were already growing strongly in 2024. However, growth accelerated significantly in 2025–2026.
Topics
CITATION
Rojas-Suarez, Liliana, and Kate Barnes. 2026. Tariffs, Prices, and Trade: Evidence from the CGD US Import Prices and Trade Flows Monitor . Center for Global Development.DISCLAIMER & PERMISSIONS
CGD's publications reflect the views of the authors, drawing on prior research and experience in their areas of expertise. CGD is a nonpartisan, independent organization and does not take institutional positions. You may use and disseminate CGD's publications under these conditions.