
Recommended

POLICY PAPER
A Better Outcome for the Poorest
Blog Post
Priming the Pump for a Successful IDA22

IDA, the World Bank’s concessional lending arm, is widely regarded as one of the most effective aid institutions, focused on helping the world’s poorest countries. This is an important moment to maximize IDA’s effectiveness. Global ODA volumes are declining, and the share of the poorest countries in ODA flows is falling. IDA’s model should be further strengthened through reforms to ensure a refocus on the poorest. There has been considerable slippage in terms of graduating countries that are above the official income threshold; allocation within IDA-eligible countries is over- reliant on empirically unjustified policy metrics; and many of the richest IDA countries receive grant support. The next IDA replenishment round should tighten adherence to IDA graduation rules, shift the IDA country allocation formula toward a focus on low income, and preserve grant support for the poorest countries.
Introduction
The International Development Association (IDA), the World Bank’s concessional lending arm, is widely regarded as one of the most effective aid institutions. Beyond its model of directly financing governments, it allocates resources using a formula that gives more to more populous, lower-income countries, and its graduation mechanism limits the recipient pool mostly to the world’s poorest countries. We should spend more available official development assistance (ODA) in the poorest countries, but for most bilateral donors, basic indicators of need like population and low income are depressingly weak correlates with their allocation decisions. IDA does better by design.
This is an important moment to maximize IDA’s effectiveness. Global ODA volumes are declining, and war in Ukraine, among other factors, is reducing the share of the poorest countries in ODA flows. And IDA is a particularly important source of financing for those countries, accounting for more than 30 percent of total financial flows. But while IDA focuses on the poorest countries more than the average donor, it focuses less on them than it used to. IDA’s model should be further strengthened—perhaps better put as returned to its former strengths—through reforms that ensure a refocus on the poorest.
There are three ways to do this: tighten adherence to IDA graduation rules; shift the IDA country allocation formula away from irrelevant metrics and toward poorer countries; and/or harden financing terms for richer IDA recipients to free up more resources for the poorest. All three should be implemented simultaneously to maximize impact.
IDA works (in the poorest countries)
The World Bank’s Independent Evaluation Group (IEG) ranks project impact on a six-stage metric running from highly unsatisfactory to highly satisfactory. Turn that into a scale from zero (highly unsatisfactory) to five (highly satisfactory) and look at average scores across income levels over time (Figure 1). There is a relationship—historically, richer economies have seen slightly better ratings from IEG. But it is far from decisive: a doubling of income is associated with a 0.07 higher average rating on the 0-5 scale. IDA projects, mostly concentrated at the left side of this figure, produce results. The IEG itself suggests that recent performance outcomes between IDA-financed projects and IBRD-financed projects, largely in far richer countries, are almost identical –about four-fifths satisfactory in both. (Although note the IEG also suggests “success” may be defined more modestly in lower-income countries).
Figure 1. World Bank project performance ordered by approval year GNI/capita (200 project moving average)
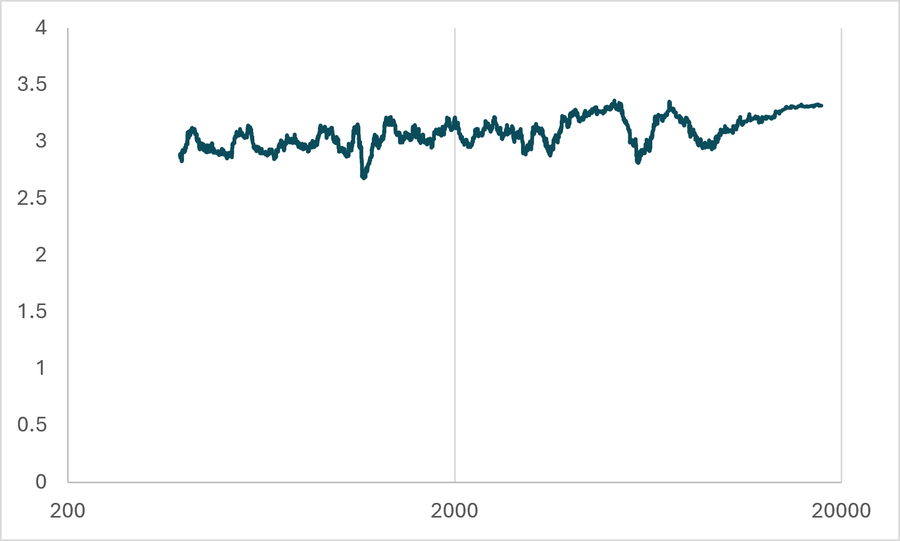
Notes: IEG project ratings scored as Highly Unsatisfactory=0, Unsatisfactory=1, Moderately Unsatisfactory=2, Moderately Satisfactory=3, Satisfactory=4, Highly Satisfactory=5. GNI per capita, constant 2015 US$ (World Bank WDI series NY.GNP.PCAP.KD), matched by country and Approval FY. Data created with the assistance of Claude/AI.
IDA’s weakening focus on the poorest
Although IDA’s support delivers results in the poorest countries, its finance is increasingly directed elsewhere. In real terms, the income of the average recipient of IDA grant-equivalent assistance (as measured by ODA) has approximately doubled since 1990 (Figure 2). This change is driven in part by the increasing GNI per capita of (nearly) all countries—including the world’s poorest countries. But it is also driven by changes to IDA’s graduation, allocation, and financing policies, discussed in the next sections.
Figure 2. Average constant GNI per capita of IDA ODA disbursement recipients weighted by disbursement size
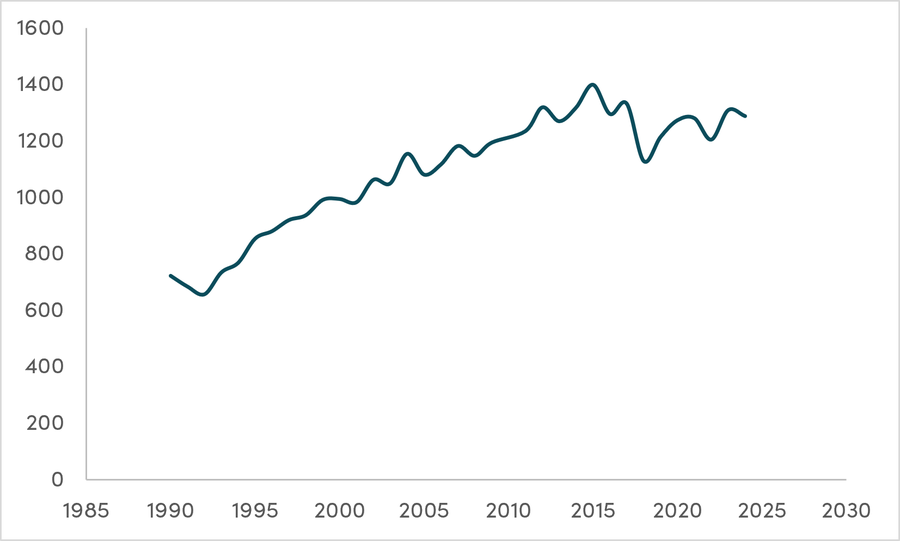
Notes: For each year, weighted_avg_gni_pc = sum(disbursements_i * gni_pc_i) / sum(disbursements_i), over all recipient countries with positive IDA disbursements that year and an available GNI per capita value. (OECD DAC2A), Donor = International Development Association [IDA], current US$ millions, 1960-2024. World Bank WDI series NY.GNP.PCAP.KD (constant 2015 US$), 1976-2025. Data created with the assistance of Claude/AI.
The graduation problem
Part of IDA’s model is a “graduation threshold,” or “operational income cutoff”—an Atlas GNI per capita figure fixed in real terms that is meant to signal the transition of countries out of IDA eligibility. There have long been exceptions for some small economies, but the more significant factor for IDA’s balance sheet is that graduation for larger economies has stalled. Figure 3 displays the number of countries that have crossed the IDA threshold since 1987 and the number that have graduated IDA (although note some countries have reverse-and-repeat graduated in that time). In 1995, there had been three crossers and three graduates over that period. By 2022, there were 57 crossers and only 20 graduates.
Figure 3. Cumulative count of countries that have crossed the IDA operational threshold income and IDA graduates
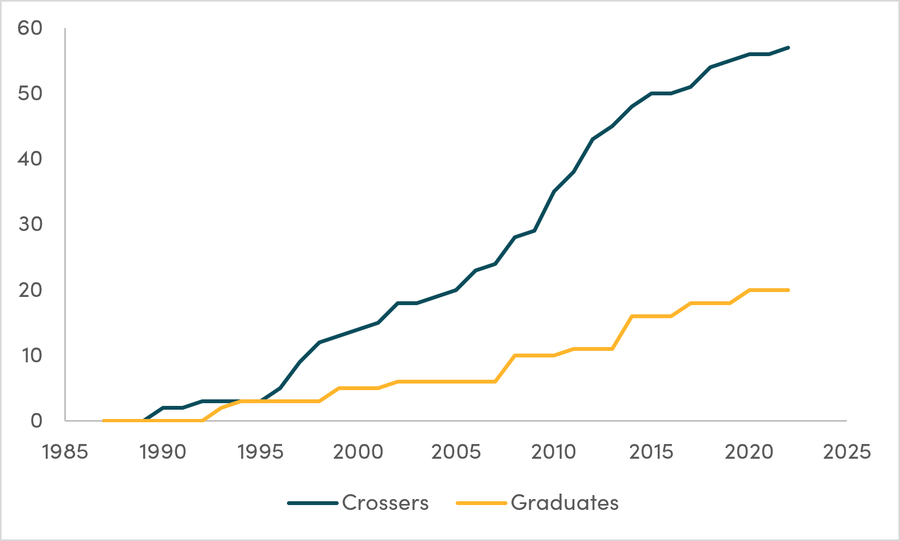
Note: Data from Gentili, Kenny and Sandefur. Note graph excludes reverse and repeat graduations.
As reported by Karen Mathiasen, Clemence Landers and Nico Martínez, more than half of IDA-eligible countries sit above the FY26 operational income cutoff of $1,325 GNI per capita, and between FY20 and FY25, larger countries over the threshold absorbed 42 percent of IDA’s resources (Figure 4, gold line). And as suggested by Figure 2, there have been times in the last decade when the average IDA recipient had an income per capita above the threshold.
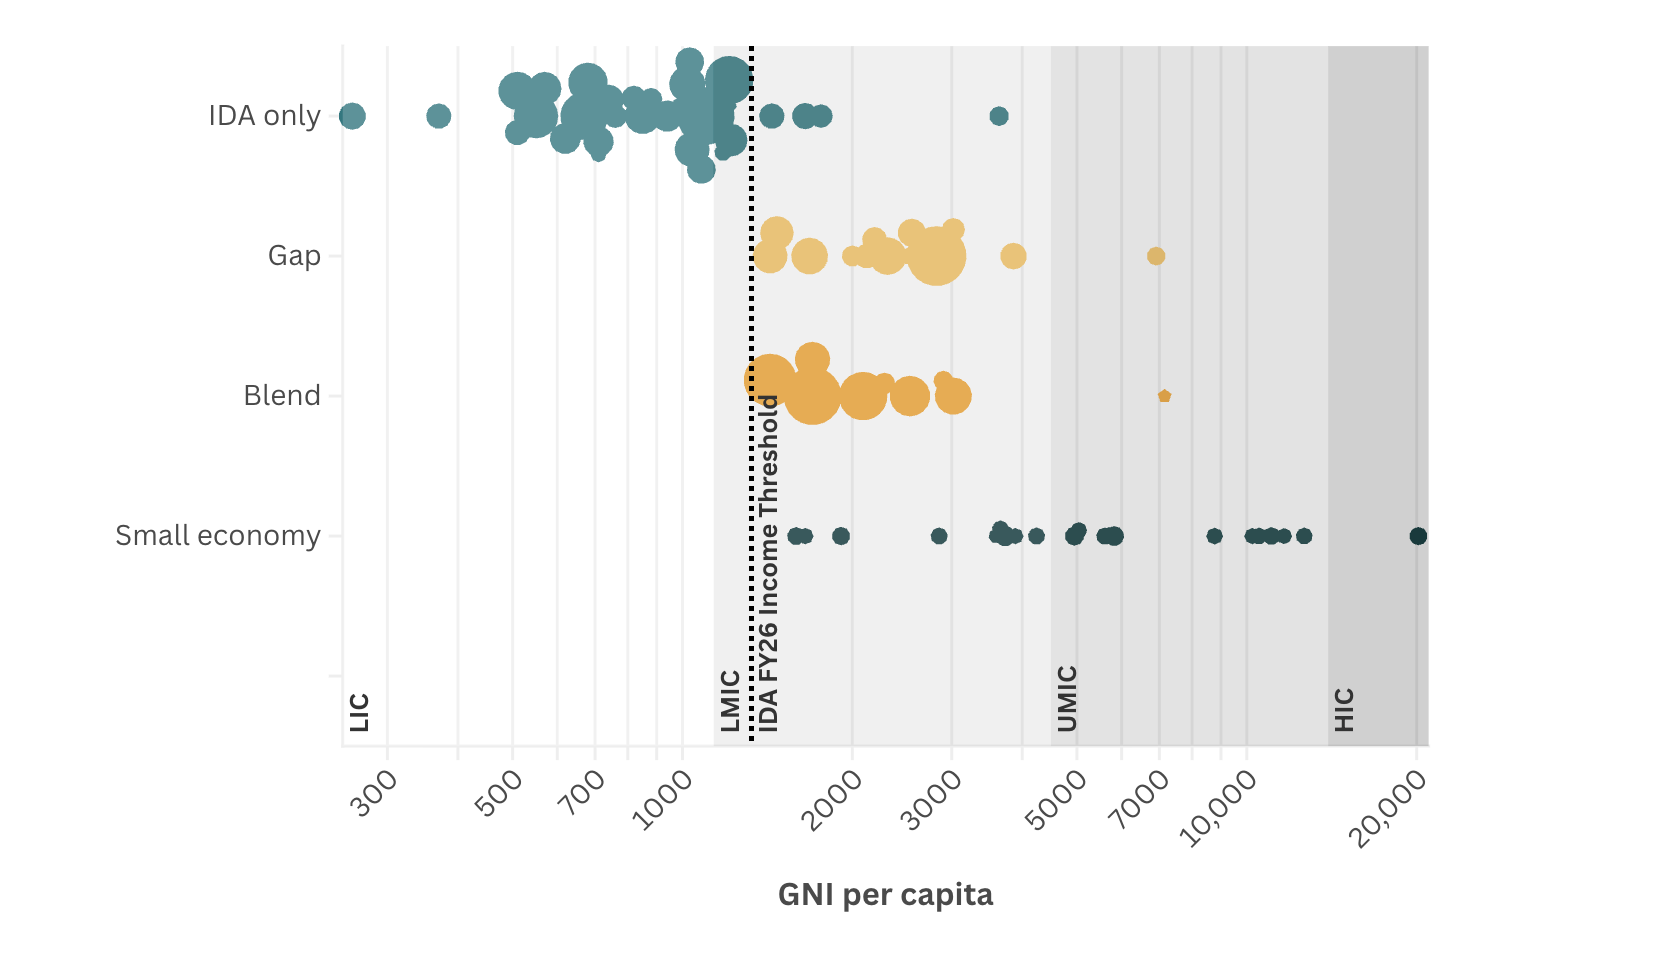
Order countries by their Atlas GNI per capita and take the poorest countries collectively home to 10 percent of the world’s population. For the last 15 years or so, the income of the richest country in that group has been near the IDA threshold. Absent threshold exceptions, one would expect nearly all IDA resources to be going to those countries. In fact, the share of these bottom 10 percent countries has reached a plateau in the mid-50s percent (Figure 4, teal line). The average IDA recipient (weighted by disbursements) now has an income twice that of the average country under the threshold (weighted by population) (Figure 5).
Mathiasen et al. suggest the graduation slippage is largely driven by (unreasonable) IBRD credit-rating-related concerns with lending to potential graduates rather than any development rationale. But the impact has certainly been to reduce grant financing available to the world’s poorest countries.
In particular, there has long been a threshold exception for small (island) economies to access IDA resources, supposedly designed to reflect their extreme vulnerability to climate and other shocks and limited opportunities for growth. There may be a place for such an exception but it has now encompassed eight countries that are above the World Bank IBRD graduation threshold of $7,855 (or about six times the IDA threshold). When countries eligible under IDA 20 rules were granted the exception, their incomes averaged 74 percent above the cutoff; by FY24 the figure was 345 percent. Furthermore, a number of current and former IDA recipients that are not small islands are very exposed to climate shocks— including Bangladesh, Mozambique and the countries of the Sahel—and small island status does not appear to be a reliable indicator of vulnerability. The extent and generosity of the small country exception appear out of proportion.
Figure 4. Proportion of IDA ODA disbursements to the poorest 10 percent of countries and countries over the threshold
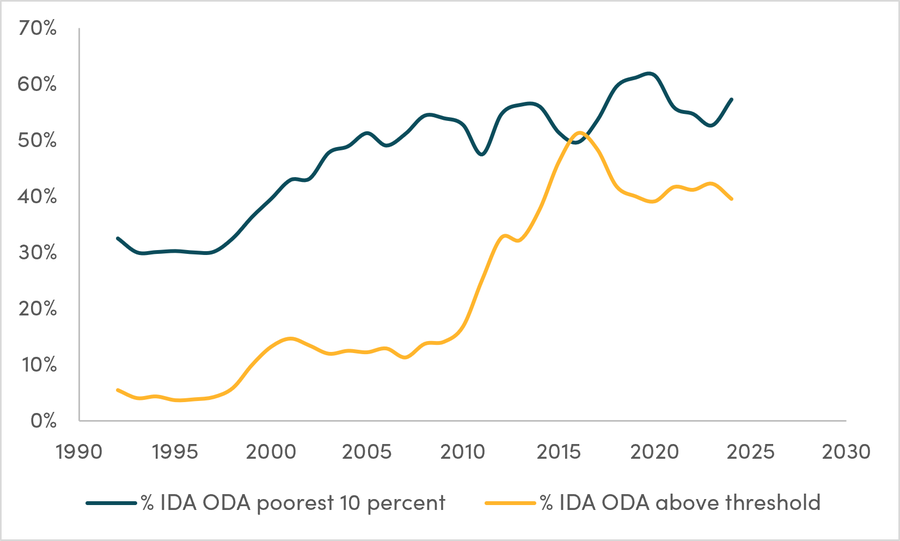
Notes: Sources: IDA ODA disbursements, constant US$ million, OECD DAC2A and World Bank GNI per capita Atlas method, population, and IDA operational GNI-per-capita cutoffs. Bottom-10% group: countries ranked by GNI per capita (poorest first) each year, cumulatively including countries until 10% of world population is reached; the marginal (threshold-crossing) country is pro-rated so the group always represents exactly 10% of that year's population. 2010 DAC data missing, “classified” recipients exclude a small number of country-years with no reported GNI per capita (mainly Djibouti/Nigeria in the early 1990s, South Sudan and Yemen from the mid-2010s, and 7 countries in 2024 including Afghanistan and Yemen); these are excluded from both the numerator and denominator of the threshold classification. 2010 is absent from the underlying IDA disbursement data. Data created with the assistance of Claude/AI.
Figure 5. Average IDA recipient income as a percentage of average income of countries under the threshold
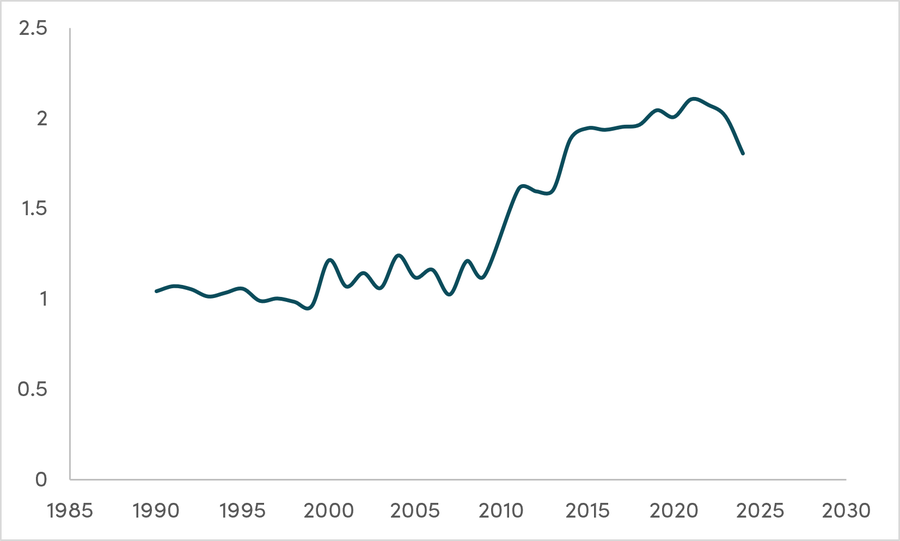
Notes: population-weighted: for each year, take all IDA-recipient countries whose GNI per capita, Atlas method, current US$ is below that year's IDA operational GNI-per-capita threshold. Average = sum(population_i * gni_pc_i) / sum(population_i). Disbursement-weighted: for each year, take all IDA-recipient countries with positive IDA ODA disbursements that year (constant 2024 US$ millions),. Weight_i = disbursements_i (total US$ millions, not per capita). Average = sum(disbursements_i * gni_pc_i) / sum(disbursements_i). Data created with the assistance of Claude/AI.
The allocation problem
Within the set of countries eligible for IDA resources, the World Bank uses increasingly baroque formulae to set financing terms and levels. The core component of the allocation remains the “performance-based” formula, although the share of IDA resources it allocates has fallen from 92 percent in the IDA replenishment covering 2008–11 to 58 percent in the most recent replenishment. Dedicated funding streams, including for fragile states (strongly pro-poor in terms of allocation), alongside IDA “windows” including for global and regional projects and scaling up successful projects make up (nearly all of) the rest.
The performance-based allocation involves a “country performance rating” (CPR) (itself made up of indicators from the World Bank’s country policy and institutional assessment (CPIA) and World Bank project performance), population, income per capita, and a fixed “base” allocation (Figure 6).
Figure 6. The “performance-based” allocation system
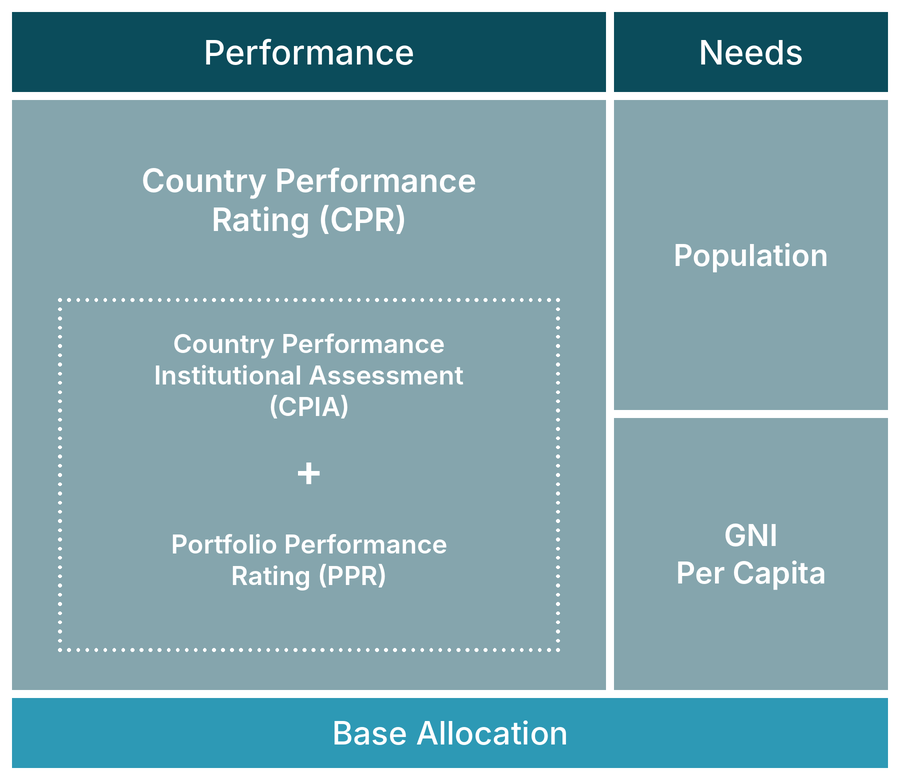
The CPR is a weighted average of clusters A-C of the CPIA ratings (covering economic management, structural policies, and policies for social inclusion, with a combined weight of 24 percent), Cluster D of the CPIA rating (covering public sector management and institutions, with a weight of 68 percent) and World Bank country portfolio performance rating (with a weight of 8 percent).
Country Performance Rating (CPR) = (0.24 * CPIAA-C + 0.68 * CPIAD + 0.08 * PPR)
The performance-based allocation score is then calculated as follows:
Allocation Score = f(CPR3, population, GNI/capita-0.125)
The relative impact of these components is suggested by Table 1. Moving one standard deviation on each measure (perhaps a third of the way through the ranking of countries in the measure) is associated with a 70 percent higher score for the CPR and a 7 percent lower score for income. In other words, policy measures as reflected in the CPR matter considerably more to financing than relative income.
Table 1. Sensitivity of IDA allocation score to CPR and GNI per capita and population
| Scenario | CPR | GNI per capita (US$) | Population (m) | Score | Change vs. baseline |
|---|---|---|---|---|---|
| Baseline | 3.1 | 1,722 | 10 | 117.4 | — |
| CPR +1 SD | 3.7 | 1,722 | 10 | 199.6 | +70.0% |
| GNI per capita +1 SD | 3.1 | 3,174 | 10 | 108.7 | −7.4% |
| Population 10m → 20m | 3.1 | 1,722 | 20 | 234.8 | +100.0% |
Note: Score = CPR³ × Population × GNI per capita^−0.125. Baseline is a country with mean CPR (3.1), GNI per capita of US$1,722 and 10 million people. Each scenario changes one variable, holding the others at baseline. CPR SD = 0.6; GNI per capita SD = US$1,452. Sample for means and standard deviations is that of the Figure 8 analysis below. This will not reflect the current data for countries in IDA21 and so is approximate.
The IDA financing allocated to each country under the performance-based element is a base allocation (currently set at $20m/year) plus the share of remaining finance under the element multiplied by (individual country score/sum of country scores). A number of additional adjustments are made, including that total financing after inclusion of any fragile state allocation can be capped at a maximum share for large countries (currently applicable to Pakistan), and that allocations are reduced for non-small state grant-based recipients.
Figure 7 illustrates the importance of various adjustment rules and formulae on country allocations in FY25 as a percentage of their GNI, starting with needs (income and population), then adding the effect of policy (CPR), and then other adjustments including base allocation and fragile state supplement. Countries are ranked by GNI per capita, the red dotted line between Zambia and Guinea marks the IDA threshold point.
Small countries do significantly better than the average due to the base allocation; poorer countries often lose significantly on the basis of their CPR. The end result is markedly favorable to small rich countries still in IDA. As an unweighted average percentage of recipient GNI, countries under the graduation threshold receive an allocation worth 2.24 percent of GNI (1.95 percent grant-equivalent at a 5 percent discount rate). The (mostly small island) IDA countries at more than twice the graduation income get an allocation worth 3.66 percent of GNI (3.2 percent grant-equivalent).
Figure 7. Estimated impact of policy and other adjustments to IDA allocations FY25 (% recipient GNI)
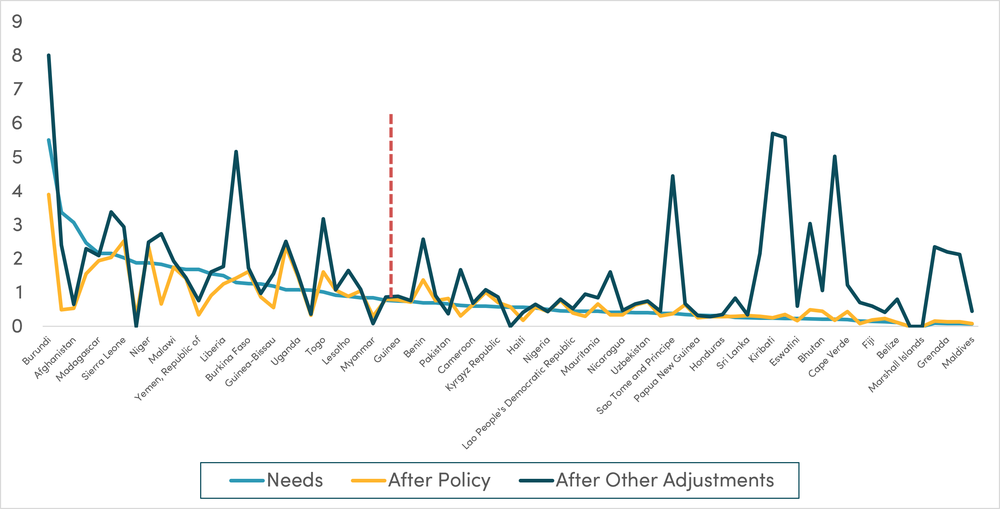
Notes: Data on allocations. The GNI per capita of Afghanistan, Yemen, South Sudan, Bhutan, and Tonga is published only as a range, so these were back-solved from their allocations. Belize, Eswatini, and Suriname had no disclosed CPR because they were IBRD-only when assessed, so their CPRs are implied from their allocations. The calculation covers volumes, not financing terms. Data created with the assistance of Claude/AI.
Across IDA replenishments, there have been significant changes to most of these elements of allocation. Looking at the basic performance-based formula, the CPR has always been more significant in determining volumes than income, but the gap has changed over time. The income effect halved in 1997, when the GNI per capita exponent moved from −0.25 to −0.125. Meanwhile, the CPR exponent moved from 1.8 in 1996 to (an effective and approximate) 5 between 2001-14 and then back down to an exponent of 3 in recent years.
And the fixed allocation has significantly grown. In IDA 15, 79 countries received SDR 4.5m per replenishment, about 1.4 percent of IDA15 resources from base allocations. In FY25, base allocations were SDR 1,155m, or 7.7 percent of initial country allocations. A per capita ceiling of SDR 19.8 was removed under IDA16. This change was not made on grounds of development impact but to justify a country presence and program. Finally, a growing fragility, conflict, and violence allocation appears to be selectively pro-poor.
Over time, then, the formula has moved toward favoring small countries with high CPRs and (so) away from poorer larger countries, with that impact mitigated through the fragile states window for some countries.
Is the CPR “evidence-based”?
The negotiations over formulae and adjustments are political and considerably driven by desired final distribution preferences. But there is at least some pretense in IDA documentation that elements of the calculation are evidence-based, particularly around the CPR/CPIA.
Sadly, the evidence that aid works better in good policy environments is as robust as a dime store piñata. Two World Bank researchers proposed this in a highly cited paper, but the result fell apart in the face of testing for nonlinear relationships, accounting for geography and climate, adding a few more years and countries to the dataset, other minor changes in design and sample, and meta-studies. While the CPIA has previously been found to correlate with subsequent growth, to quote the 2010 IEG report on the CPIA: “The evidence is mixed as to whether the CPIA criteria are relevant for aid effectiveness as defined in the literature—that is, whether the criteria represent the policies and institutions that are important for aid to lead to growth.”
At the World Bank project level, the IEG suggests a link between CPIA scores and the share of problem projects in a country as assessed by bank staff in loan implementation status reports. But a study of World Bank project outcomes found that 80 percent of the variation in project ratings occurs within, not across, countries.
That suggests little variation can be explained by country-level factors, including policy or institutional factors. Indeed, analysis by World Bank researchers suggests having a project run by a project manager with a comparatively good track record is nearly twice as important to project outcomes as having a project in a comparatively high-CPIA country.
To further examine the relationship between the CPR and subsequent development outcomes, Figure 8 looks at countries with published CPRs and subsequent average growth and World Bank project performance (on the same scale used above).
The results suggest that being one standard deviation higher on the CPR (perhaps a third of the way through the ranking) is associated with 0.9 percent faster average GNI per capita growth over the subsequent 10 years. That said, within countries (adding country fixed effects), a higher CPR is associated with slower growth (although the statistical significance of that relationship does not survive the use of clustered standard errors). Looking at CPR and projects approved in the three years after that score, the relationship with project outcome is insignificant across countries but once again within counties over time, a higher CPR is associated with significantly worse outcomes. CPRs tend to improve in periods of economic growth, suggesting this effect may reflect mean reversion.
Figure 8. The CPR and subsequent outcomes
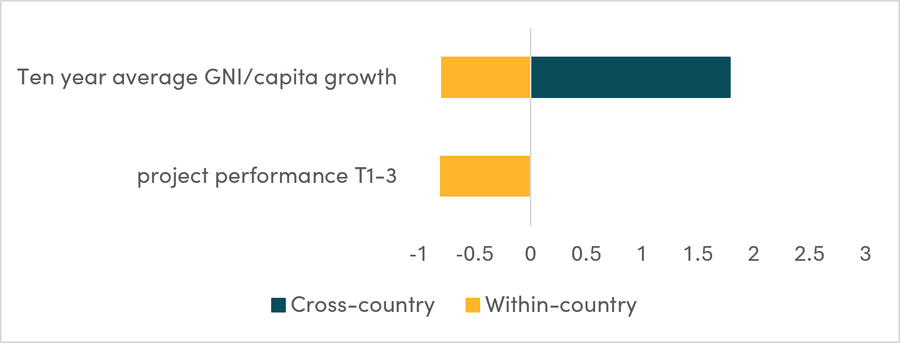
Notes: Graph displays coefficients between the CPR and outcome variable. Only significant results show, for details see tables in appendix. Note also significance of negative GNI/capita within-country result is not robust to the use of clustered standard errors. Analysis created with the assistance of Claude/AI.
In short, countries with high CPR scores see comparatively rapid subsequent growth but not necessarily better project outcomes, and countries where the CPR increases see at best no better subsequent growth and worse project outcomes. This suggests improved policy and institutional performance in a country—as measured—leads, if anything, to worse results. The CPR is a poorly designed metric to encourage or reward growth-enhancing or project-outcome-improving policy change.
The grant element
IDA21’s 10 percent cut to the main country allocation for any country eligible for grants that does not take credits, along with its lowered grant allocation cap of $650 million and exceptions for small states, further skews the grant-equivalent distribution of IDA resources away from the poorest countries.
Furthermore, at the moment there is a significant rate of concessionality—up to a 100 percent grant element—for many of IDA’s richest recipients (Figure 9). Twenty-three recipients benefit from “Small Economy Terms,” with no interest, a 40-year maturity, and a 10-year grace period and 100 percent grant resources for those small economies in debt distress.
Policy conclusions
It is hard to find evidence of diminishing returns to aid, perhaps in part because “absorptive capacity” is far more a question about how aid is delivered than how much. Similarly, projects surely need to be designed differently in low-capacity settings, but it is simply not the case that projects can’t work in those settings. Once again, it is hard to find evidence that aid projects work consistently and significantly worse in the poorest countries.
Conversely, there is considerable evidence of a declining marginal return across countries to a dollar spent in terms of improving development outcomes from GNI per capita through health through education to self-reported wellbeing. All else equal, a dollar of assistance will have its greatest impact in the poorest countries. Any distribution mechanism that doesn’t prioritize that has to justify itself, and IDA’s graduation exceptions, “performance-based” formula and grant allocations to rich countries don’t pass the justification test.
This all suggests considerably increased IDA impact from concentrating its focus back on the world’s poorest countries through graduation. But in addition, within the allocation formulae, IDA should reduce the base allocation, abandon the country allocation maxima, increase the negative exponent on income, and reduce the positive exponent on the CPR. And IDA should limit grant support to the poorest countries.
The simplest solution would be to allocate resources (only) under the IDA threshold using a formula limited to income and population. But any progress toward a higher-impact allocation would be welcome. An opening suggestion would be:
- Graduate at least sufficient countries to ensure the gap between threshold-crossing and graduation does not further expand (for each maintained threshold crossing a graduation). Begin the process of graduating countries with those that are at more than twice the threshold income per capita (~ Bangladesh and above).
- Reduce the base allocation to 2 percent of available resources, closer to (but still above) the level of 2008, or reimpose a per capita ceiling, perhaps of SDR 50.
- Reduce the exponent on policy to 2, closer to (but still above) the level of 2008.
- Increase the income exponent to -0.25, the level of 1997.
- Abandon the grant allocation volume discount and the grant allocation cap for countries below the threshold. Limit the grant element of support to 70 percent for countries that have been between the threshold and twice the threshold GNI/capita for all of the last replenishment period and IBRD terms for countries more than twice the threshold GNI per capita for all of the last replenishment period.
Figure 10 suggests what the impact of the base allocation and exponent changes would have been to the performance-based allocation if implemented in FY2025 (this ignores the Pakistan country cap, Eritrea and Zimbabwe inactive, FCS top-ups, Syria special allocation, Myanmar at 25 percent).
Any graduation or allocation changes favoring poorer countries could have some impact on IDA’s financial model: it would likely increase the proportion of finance that is grants-based and reduce the proportion that is subsidized loans. That would in turn limit the ability to borrow resources to finance IDA operations. In short, absent greater donor contributions, these changes would make IDA smaller. But reforms would also make IDA more effective where it is needed most, and even more deserving of greater donor support. Furthermore, reducing the concessionally of support to IDA countries above the threshold could help mitigate the impact of better allocation to those below it.
In a period where ODA is shrinking and increasingly spent in rich countries, IDA is more vital than ever, and it is more vital than ever that IDA focuses where it was designed to: the world’s poorest countries. That takes reversing the drift of past decades on IDA graduation, allocation, and financing practices.
Figure 9. Estimated grant element of FY25 IDA finance (discount rate: 5%)
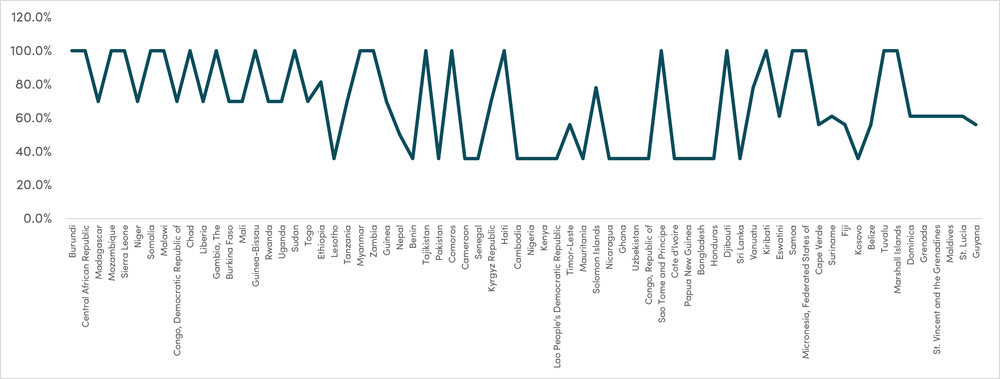
Notes: Instrument grant elements assume full disbursement at t=0 and a 5% discount rate. Lending groups are taken from here. Analysis created with the assistance of Claude/AI.
Figure 10. The impact of formula changes to the (formula) PBA allocation (% recipient GNI)
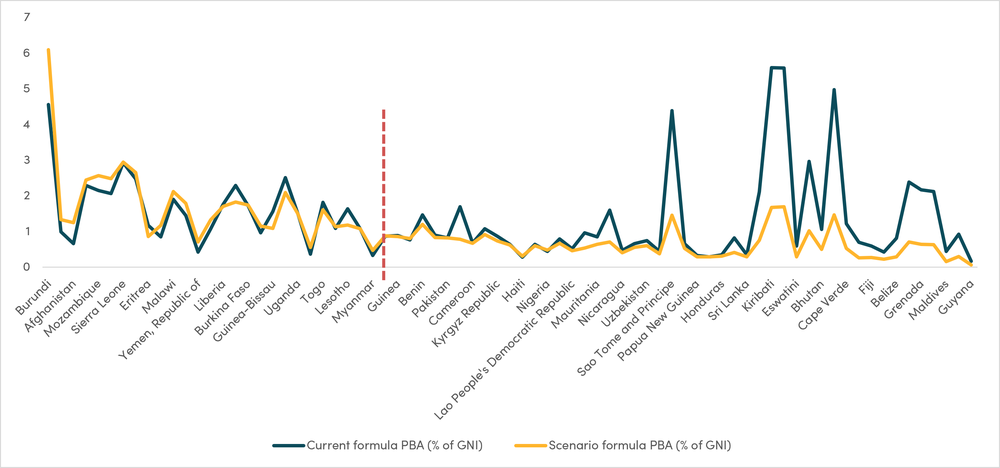
Notes: Data on allocations. The GNI per capita of Afghanistan, Yemen, South Sudan, Bhutan and Tonga is published only as a range, so these were back-solved from their allocations. Belize, Eswatini and Suriname had no disclosed CPR because they were IBRD-only when assessed, so their CPRs are implied from their allocations. The calculation covers volumes, not financing terms. Analysis created with the assistance of Claude/AI.
Table 2. Descriptive statistics: Country-level variables
| Variable | Mean | Std. Dev. | N |
|---|---|---|---|
| IDA Resource Allocation Index (1-6 scale) | 3.239 | 0.494 | 1502 |
| CPR Score | 3.140 | 0.459 | 1260 |
| GNI per Capita, constant 2015 US$ | 1722 | 1452 | 1950 |
| GNI per Capita Annual Growth (%) | 2.272 | 8.540 | 1865 |
| Approval-Year Portfolio Score, IDA Agreement (0-5) | 2.942 | 0.976 | 2298 |
| Closing-Year Portfolio Score, IDA Agreement (0-5) | 2.958 | 0.887 | 1578 |
Portfolio performance scale: Highly Unsatisfactory=0, Unsatisfactory=1, Moderately Unsatisfactory=2, Moderately Satisfactory=3, Satisfactory=4, Highly Satisfactory=5. "Not Rated" projects are excluded. Restricted to the 86 countries that have at least one CPR or IDA resource allocation index observation in the dataset.
Table 3. t0 CPR score vs. subsequent GNIpc growth
Windowed (growing-window average growth, t1 through tN).
| Horizon (yrs) | N | Beta (alone) | Beta (ctrl GNIpc) | Beta (country & year FE) |
|---|---|---|---|---|
| 1 | 886 | 1.8947** | 2.2784*** | 1.1908 |
| 2 | 882 | 1.6731*** | 1.9988*** | 0.4402 |
| 3 | 867 | 1.8300*** | 2.1825*** | -0.0454 |
| 4 | 813 | 1.6257*** | 1.9576*** | -0.9528 |
| 5 | 761 | 1.6054*** | 1.9673*** | -1.2206 |
| 6 | 709 | 1.5690*** | 1.9228*** | -1.7307** |
| 7 | 657 | 1.6229*** | 1.9604*** | -1.5422** |
| 8 | 603 | 1.6667*** | 2.0131*** | -1.2315* |
| 9 | 549 | 1.7071*** | 2.0506*** | -0.9333* |
| 10 | 494 | 1.7867*** | 2.1039*** | -0.7931* |
Significance stars: * p<0.05, ** p<0.01, *** p<0.001. Note significance of CPR disappears using clustered standard errors alongside country and year fixed effects.
Table 4. t0 CPR score vs. 3-year average approval-based portfolio score
| Window | N | Beta (alone) | Beta (ctrl GNIpc) | Beta (country & year FE) |
|---|---|---|---|---|
| t1 to t3 | 346 | 0.0408 | 0.0409 | -0.8026*** |
| t2 to t4 | 318 | 0.0613 | 0.0696 | -0.6733*** |
| t3 to t5 | 289 | 0.0842 | 0.0928 | -0.4361* |
Significance stars: * p<0.05, ** p<0.01, *** p<0.001. Note use of clustered standard errors leaves only t1-t3 of country-year fixed effects significant (at 5%).
Topics
CITATION
Kenny, Charles. 2026. Improve IDA Impact: Follow Graduation Rules, Simplify Allocation, Limit Grants to the Poorest. Center for Global Development.DISCLAIMER & PERMISSIONS
CGD's publications reflect the views of the authors, drawing on prior research and experience in their areas of expertise. CGD is a nonpartisan, independent organization and does not take institutional positions. You may use and disseminate CGD's publications under these conditions.