
Recommended
Blog Post
Emissions Myth-Buster
Introduction
There is a widespread perception that developed countries are responsible for the vast majority of cumulative historic greenhouse gas (GHG) emissions. China and India may be among the key emitters today, the argument goes, but their emissions growth has been relatively recent, and so historic emissions are still dominated by countries that were at the forefront of the Industrial Revolution. Beynon et al. (2026) demonstrate that this is not the case. Whichever dataset or metric you use, the share of total historic emissions from Annex II countries[1] is consistently below 50 percent—and as low as 34 percent in some.
Of course, this ignores the fact that some countries have far larger populations than others; so while developed countries’ share of absolute GHG contributions is now small, their individual cumulative per capita emissions are still much higher. It is surprisingly hard to adjust for this, and attempts to do so often lead to nonsense conclusions. But one proposal, put forward by Jason Hickel in a 2020 paper (updated in Fanning and Hickel 2023), still gets mentioned in climate circles today.
Hickel argues that in assessing responsibility for “climate breakdown,” we should first ascertain a safe level of emissions, and then divide it among countries according to their average share of global population over the period in question. He takes total emissions as of 1990 as the safe level (the date at which CO2 in the atmosphere reached 350 parts per million, or ppm). There is, of course, no binary switch at 350ppm, and the method also ignores the impact of land use change and short-lived gases. But overall, Hickel’s proposal is a reasonable way to account for population differences between countries when assigning responsibility for climate change.
Hickel’s paper was published nearly six years ago and relies on data from 2015. Since then, China’s and India’s economies have both grown by more than 70 percent, and Indonesia’s has grown by more than 50 percent. While Fanning and Hickel (2023) used more recent data, they also changed the methodology—changing the CO2 budget in the headline figures and including population forecasts in the allocating country shares—obscuring the changes to the world that happened over that period. In addition, neither paper analyses Annex II countries specifically, a group of particular interest given their obligation to provide climate finance under the climate convention. This note therefore uses the same data and a consistent methodology to see what has changed.
Overall, it finds that while the Annex II countries still account for a disproportionate share of excess emissions (between 60 percent and 66 percent depending on whether you use territorial or consumption-based emissions, compared to around 16 percent of global population), this share has steadily declined over the last decade, and that many of the largest “overshooters” are not included in either annex list, in particular China and the Gulf States.
Methodology
This section reviews the methodology employed by Hickel (and the Fanning and Hickel update) and outlines areas where our analysis differs. Overall, we try to stick as close as possible to their analysis in order to demonstrate what has changed on a consistent basis, and what this implies for Annex II countries.
How should the CO2 budget be set?
Core to this approach, and what distinguishes it from just looking at total emissions (as in Beynon, et al.), is starting with a global budget of cumulative CO2 emissions and dividing it across countries in proportion to their population. Only emissions in excess of that budget are included in a country’s responsibility for climate change.
Each country’s share is calculated as the national average population as a share of the global average population over the period. In the initial paper, the average population was taken over the years in which emissions were measured (1850-2015). In the update, the authors took population forecasts from the UN and used the projected population between 1850-2050. This note uses the latter method, as it is reasonable to account for people likely to be alive in the future when dividing the carbon budget between countries. Most people who will be alive in 2050 are already born or will be born to parents who are, so excluding them is not caution about the unknown but a decision to deny a share of the atmosphere to people we can be confident will need one. However, this change in methodology makes little difference either way.[2]
In the initial paper, the global carbon budget is taken as the cumulative level of emissions in 1990 (830 GT), the year in which the atmospheric concentration of CO2 passed 350 ppm. This figure is a standard estimate in the scientific literature (see, for example, Hansen et al. 2008) of the safe upper limit of atmospheric CO2 consistent with a stable climate. If global emissions exceed this concentration, they start to contribute to “climate breakdown” (in Hickel’s words). This figure was passed in the year 1990,[3] hence taking cumulative emissions up to that year as the global budget.
The update to the paper employs several different “budgets”: one consistent with 350ppm as in the original paper (although with a revised number in light of updated data), one consistent with 1.5C of warming above preindustrial levels, and one consistent with 2C. The two latter estimates imply substantially higher budgets, which in turn means fewer countries have overshot them, and this implies a higher share of excess emissions accounted for by the Global North.
While useful for showing the sensitivity of the responsibility share to different budgets, these are not useful thresholds for assessing who should provide what in climate finance. To establish a CO2 budget for each country that is consistent with 1.5C and then claim that only countries exceeding that budget have responsibility to provide climate finance ignores the substantial climate damages that have already occurred. The world has not yet officially surpassed 1.5C above preindustrial levels, and already climate change has contributed to numerous disasters across the globe. A budget consistent with 1.5C implies that no country owes anything for the damages that have alreadyoccurred. In addition, it is odd to describe emissions above a certain level as causing “climate breakdown” while allocating countries a budget of more than twice that figure (which is the implication of basing the budget on keeping global warming under 1.5C, according to Fanning and Hickel’s analysis).
Furthermore, the 350ppm figure emerged from a series of academic papers seeking to establish a safe atmospheric concentration (and associated CO2 budget). The temperature targets came instead from a political process: 2°C was recognised in the Copenhagen Accord at COP15 in 2009, and 1.5°C was adopted only at COP21 in Paris six years later, after small island states had pressed for it unsuccessfully at Copenhagen. Both reflect what negotiators judged achievable and agreeable at the time rather than what the science identified as safe. However, in the annex, we explore how different budgets affect overall responsibility for excess emissions.
Consumption-based v. territorial emissions
Hickel uses consumption emissions where possible (data from 1970 to the present), arguing that this “better reflects the ethical principle of equal access to atmospheric commons.” We disagree that consumption data is inherently better as a measure of responsibility: both producers and consumers benefit from transactions underpinned by fossil fuels, and the balance between those benefits will differ across contexts. We do not exempt drug dealers from responsibility for the ill-effects of illicit drug use on society, and nor should major oil producers such as Equinor or Saudi Aramco be exempt from responsibility just because they are not the end user. Taking either territorial or consumption emissions are both extreme assumptions, and the fairest allocation of responsibility probably lies somewhere between the two. We therefore explore both measures.
To be as consistent as possible with their paper, we use the consumption data available through Fanning and Hickel’s GitHub repository. This only goes up to 2019, whereas production data from PRIMAP is available until 2024. We approximate consumption emissions for this period by applying the average ratio of consumption to production emissions between 2015-2019 to the production figures. This is only approximate, but this ratio is generally stable over time for each country, and given we are calculating cumulative emissions over a 174-year period, the estimation errors from those last five years will be tiny relative to the overall figures.
Country groupings
Hickel’s original paper divides up countries several ways, with the “Global North/Global South” divide receiving the most attention. Surprisingly, one split which was not incorporated in either the original paper or Fanning and Hickel was whether countries are included in the list of Annex II countries listed in the UNFCCC documents; this is the group that has specific obligations to provide climate finance. In 1992, these countries were responsible for 63 percent of cumulative CO2 emissions, and nearly all excess emissions (whether consumption or production); by 2024, that had fallen to between 49-52 percent depending on the measure. We examine the share of the overshoot by membership of Annex I and Annex II groupings.
Data updates
For the most part, we use the data available in Fanning and Hickel's GitHub repository, which is admirably transparent. This includes consumption CO2 data for 1970 to 2019, population data from 1850 to 1950, and various data cleaning steps. However, a number of factors give rise to some differences:
- Newer PRIMAP data: Our analysis uses version 2.7 of PRIMAP territorial emissions. There have been slight updates between versions that are relevant to the results. For example, Brazil and Russia have cumulative emissions in 2019 around 5 percent lower in the new data; Saudi Arabia and Mexico each have cumulative emissions around 3 percent higher.
- Newer World Population Projections data: We use WPP projections from the 2024 edition. Again, there have been some meaningful changes. For example, China’s projected population between 1970 and 2050 is 3.3 percent lower according to the newer data, which decreases its calculated CO2 budget (most, but not all, of the difference comes from the projection period).
- Inclusion of countries with messy CO2 data: The Fanning and Hickel script drops numerous countries for which there is considerable inconsistency between CO2 datasets. As a result, the final analysis is based on 171 countries. Among those that are missing from the analysis are Ethiopia and Sudan. These countries contribute very little to emissions but account for a meaningful share of world population: in total, the missing countries account for around 3 percent of total population in our data (compared to 1 percent of territorial emissions data in PRIMAP 2.7). This means that dropping them artificially increases the CO2 budget for the remaining countries. Instead, we include those countries, but where countries have been dropped from the Fanning and Hickel data, we impute CO2 data from PRIMAP 2.7. This is imperfect, but we prefer it to ignoring 3 percent of the world’s population.
Results: Annex II still dominates, but China and the Gulf can’t be ignored
Overall, we find that using Hickel’s methodology, with a CO2 budget consistent with an atmospheric concentration of 350ppm, the share of excess emissions accounted for by Annex I countries was 80 percent in 2024 if based on consumption emissions, or 76 percent if based on territorial emissions. This is 10 percentage points lower than the estimate based on 2015 data but still indicates that Annex I countries account for a dramatically outsized share of excess emissions.
For Annex II countries, the story is the same: in 2024 this group accounted for 66 percent if using consumption emissions and 60 percent if using territorial—in each case, a fall of around eight percentage points over the last decade. While there is still a substantial imbalance in responsibility, it is nevertheless striking that at least one-third of emissions in excess of a safe limit now come from countries with no obligation to provide climate finance.
Table 1. Percentage share of excess emissions accounted for by different groups
| Consumption-based (%) | Production-based (%) | Population (%) | Ratio of excess emissions share (consumption) to population share | |
|---|---|---|---|---|
| Annex II | 66 | 60 | 16 | 4.2 |
| Annex I | 80 | 76 | 22 | 3.6 |
| USA | 34 | 31 | 5 | 7.3 |
| Europe | 30 | 28 | 11 | 2.6 |
| EU 27 +GBR | 26 | 24 | 10 | 2.7 |
| BRICS | 16 | 21 | 42 | 0.4 |
| o/w China | 8 | 11 | 20 | 0.4 |
| Gulf | 2 | 3 | 0 | 4.2 |
| Africa | 1 | 2 | 15 | 0.1 |
| SSA | 1 | 2 | 13 | 0.1 |
| LDCs | 0 | 0 | 12 | 0.0 |
Note: Gulf includes Bahrain, Kuwait, Oman, Qatar, Saudi Arabia, and United Arab Emirates. BRICS refers to the original members (Brazil, Russia, India, China) and South Africa.
Source: UN World Population Prospects, Fanning and Hickel (2023), PRIMAP version 2.7
In terms of individual countries, the United States is still responsible for by far the largest share of the overshoot: between 31 and 34 percent in 2024 depending on the measure. However, the second and third largest countries are China and Russia, each accounting for about 8 percent (Figure 1) and half of the top 20 countries are not Annex II countries, mainly countries heavily dependent on fossil fuels. China’s share has been growing by nearly a percentage point each year over the past eight years.
Some notable countries still have not used up their share of “safe” emissions, such as India and Indonesia, and neither is close, despite being large emitters in absolute terms. Even if the 2024 level of emissions continues in each country, India will not exceed its share for nearly 30 years, and Indonesia won’t for nearly a decade. Not a single least developed country accounted for any of the overshoot, and aside from South Africa, only seven African countries accounted for any overshoot, although collectively this came to well under half a percent.
Figure 1. Top 20 countries responsible for excess emissions (consumption-based)
Source: UN World Population Prospects, Fanning and Hickel (2023), PRIMAP version 2.7
This hides an important difference. For some countries (like Belgium), the share of the overshoot is small in absolute terms but concentrated over a few people who consume far more than their share of the budget. For others (China), each individual is only slightly over their emissions budget, but there are so many people that it adds up to a substantial overshoot overall. It is therefore interesting to compare the ratio of the share of the world’s population (averaged over the period) to the share of the overshoot, to give a sense of “per capita” responsibility.
This metric is highly sensitive to whether we focus on consumption- or territorial-based emissions, especially for tiny territories such as Hong Kong or the Vatican. But Qatar tops the table under either measure, accounting for a share of excess emissions around 10 times larger than its population share. Other Gulf countries are strongly represented: UAE and Kuwait are both in the top 10 by either measure, and Bahrain is 6th on the production-based measure and 12th on the consumption-based. Several of the remaining countries are small oil producers such as Brunei and Trinidad and Tobago.
Figure 2. Ratio of share of excess emissions to share of global population, top 20 countries
Source: UN World Population Prospects, Fanning and Hickel (2023), PRIMAP version 2.7
How has responsibility changed over time?
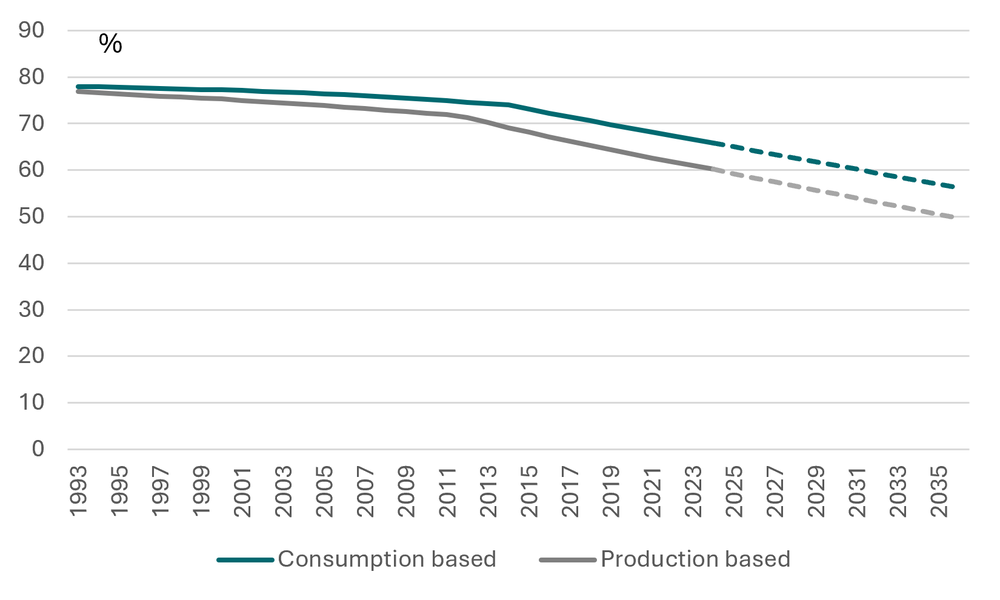
The Annex lists were set a long time ago. There have been updates to them since (with a handful of small countries added to Annex I, and one country—Türkiye—removed from Annex II[4]), but fundamentally they reflect a very different world. Figure 3 shows how the share of excess emissions accounted for by Annex lists has evolved over time, and how it will continue to evolve if recent trends continue (naively extrapolating linearly). Annex II countries accounted for nearly 80 percent of excess emissions when the lists were set, but that has fallen to between 60 and 66 percent today (depending on whether measuring consumption- or territorial-based emissions) and could fall to below 50 percent in the next 10 years (by the territorial measure at least).
Figure 3. Trend in Annex II percentage share of excess emissions
Source: UN World Population Prospects, Fanning and Hickel (2023), PRIMAP version 2.7
Are there other reasons to focus on Annex II?
This trend highlights concerns about the continuing relevance of the Annex lists. In our view, it is hard to defend the idea that 33-40 percent of excess emissions come from countries with no obligation to provide climate finance, despite at least some of that finance explicitly being about helping countries deal with the impact of those emissions.
Emissions responsibility (that some argue should be measured by excess emissions as measured above) is not the only factor relevant for determining climate finance obligations, however; capacity (often proxied by income) is also generally viewed as important. Countries are expected to provide finance both in line with their “differentiated responsibilities” (usually taken to refer to emissions) and their “respective capabilities” (usually taken to refer to wealth or income). Higher-emitting countries tend to be higher-income ones, but there are exceptions in both directions. Comparing income (measured by GNI per capita, purchasing power parity (PPP) adjusted[5]) to the share of overshoot, it is clear that while being a member of Annex II is a sure indication that a country should contribute—as such countries both have higher income and account for a higher share of excess emissions—the reverse is not necessarily true.
Compare Saudi Arabia and Finland. Saudi Arabia has slightly higher income, and accounts for a much higher share of excess emissions, even when relative population sizes are accounted for. The same is true of Qatar and Denmark, or Poland and Greece, or numerous other combinations.
Figure 4. GNI per capita (PPP) against percentage share of excess emissions (excl. US)
Source: UN World Population Prospects, Fanning and Hickel (2023), World Bank Development Indicators, PRIMAP version 2.7
CO2 focus is favourable to non-Annex II countries
A limitation of the above analysis is it sole focus on CO2 emissions, ignoring the warming potential of other gases and the impact of land use changes. As Beynon et al. show, Annex II countries account for a far smaller share of all greenhouse gas emissions than their share of CO2 alone.
Attempting to include both CO2 and methane under a single budget—required to facilitate the above analysis—is complex given the different properties of the gases. While methane emissions are frequently quoted in “CO2 equivalent” measures (such as GWP100—short for global warming potential over a 100-year timeframe), these conversions only make sense in some contexts. Methane in the atmosphere mostly disperses over a short period, so as Hickel notes in the original paper, it cannot be meaningfully assigned a budget and included in analysis of long-term stocks in the same way as CO2. Nevertheless, restricting the analysis to CO2 substantially understates total responsibility for observed warming to date: the IPCC estimates that around 0.5C of warming between the 2010-2019 and 1850-1900 periods was caused by methane, a contribution comparable to that of CO2 (0.8C)[6]. And the distribution of methane emissions is skewed far more heavily towards non-Annex II countries, given that methane is far more related to agriculture and coal production.
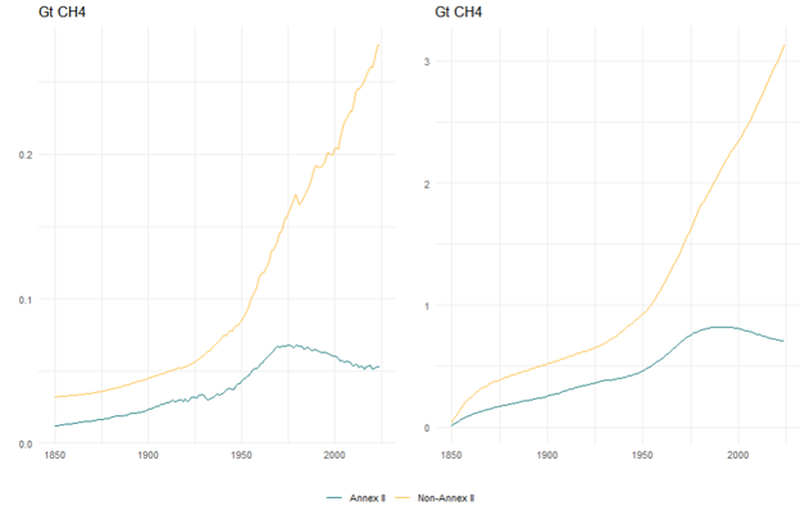
In fact, Annex II countries are not emitting enough methane currently to keep their cumulative emissions in the atmosphere from declining. Because methane disperses from the atmosphere relatively quickly, if emissions are constant year to year, the amount in the atmosphere will reach a steady state where new emissions are balanced against the methane that disperses. If methane emissions then decline from that point, then dispersion will outpace new additions, and the cumulative amount in the atmosphere will decrease, in stark contrast to CO2.
Annual methane emissions from Annex II countries have been declining since 1980, and are now 23 percent below their peak, according to PRIMAP data.[7] Summing methane emissions over time, but adjusting for the decay of methane from the atmosphere (using an impulse response function that approximates the amount of methane that remains in the atmosphere by the year after it was emitted)[8] demonstrates that Annex II countries are only responsible for only 18 percent of cumulative methane emissions. This is still slightly higher than Annex II population share (16 percent) but highlights that examining CO2 on its own gives an incomplete picture.
Figure 5. Annual methane emissions, and cumulative emissions accounting for decay
Source: PRIMAP version 2.7
This should not be overstated. Warming from past methane emissions may still be relevant even if the gas itself is no longer in the atmosphere. And analysing methane and CO2 together is complex: Hansen et al. (2008) derive their estimate from paleoclimate evidence and the planetary energy imbalance and re-deriving it on a multi-gas basis is beyond the scope of this paper.
But the above suggests that jumping from emissions in excess of a CO2 budget to responsibility for global warming is misleading, given the role of other gases. In the original Hansen et al. paper on which the 350ppm limit is based, the authors note that the actual safe limit could be 25ppm lower or higher depending on what happens with other emissions. Since then, methane emissions have increased by around 15 percent (despite the fall from Annex II countries). As a very rough estimate, if we instead take 325ppm as the safe limit and allocate a CO2 budget accordingly by the same method, the Annex II share of excess emissions would fall by around 6 percentage points.
We need to rethink country groupings
The world has changed a fair bit since 2015, and a lot since 1992, when the Annex lists were first formed.
Nothing in this analysis reduces the imperative for Annex II countries to provide their fair share of climate finance. They continue to produce unsustainable amounts of emissions, have failed to meet climate finance targets in agreed timeframes, and most analysts believe that increases in climate finance are grossly exaggerated as a result of accounting changes and weakening standards. Annex II countries have also blocked efforts to enhance accountability for provision by resisting setting a definition of what should count.
But just because Annex II countries have failed to meet their obligations in the past does not mean that we should view Qatar and Kenya as being in the same category. China and petrostates may claim to be on the same side as the least developed countries (LDCs) and small island developing states (SIDS) in negotiations based on the Annex lists, but LDCs and SIDS suffer disproportionately from the impacts of climate change and account for none of the overshoot. They are keen to preserve the Annex lists precisely because they want to avoid attention on their own contribution to the climate breakdown. But where countries are behaving (or have behaved) irresponsibly, they should be held to account, regardless of where they are on the map. It is time to stop letting lists created over 30 years ago hold such sway over today’s climate discussions.
Annex 1. Shares of excess emissions using different CO2 budgets
325ppm
| 350ppm | 1.5C | 2C | ||||||
|---|---|---|---|---|---|---|---|---|---|
| Cons. | Prod. | Cons. | Prod. | Cons. | Prod. | Cons. | Prod. | Population | |
| Annex II | 60 | 56 | 66 | 60 | 80 | 74 | 83 | 78 | 16 |
| Annex I | 74 | 71 | 80 | 76 | 92 | 90 | 94 | 92 | 22 |
| USA | 30 | 28 | 34 | 31 | 46 | 44 | 52 | 50 | 5 |
| Europe | 28 | 27 | 30 | 28 | 29 | 27 | 26 | 25 | 11 |
| EU 27 +GBR | 25 | 23 | 26 | 24 | 26 | 24 | 24 | 22 | 10 |
| BRICS | 20 | 24 | 16 | 21 | 8 | 11 | 7 | 10 | 42 |
| o/w China | 11 | 14 | 8 | 11 | 0 | 0 | 0 | 0 | 20 |
| Gulf | 2 | 2 | 2 | 3 | 2 | 3 | 3 | 4 | 0 |
| Africa | 2 | 2 | 1 | 2 | 1 | 2 | 0 | 1 | 15 |
| SSA | 1 | 2 | 1 | 2 | 1 | 2 | 0 | 1 | 13 |
| LDCs | 0 | 0 | 0 | 0 | 0 | 0 | 0 | 0 | 12 |
Notes: According to NOAA, the world passed 325ppm in 1970 and 350ppm in 1988. According to PRIMAP 2.7, cumulative global CO2 emissions were 445 Gt and 790 Gt in those years. The global 1.5C and 2C budgets are estimated to be 2077 Gt and 2752 Gt, respectively, based on cumulative emissions of 1717 Gt in 2020, and remaining budgets (consistent with those temperatures) of 360 Gt and 1,035 Gt according to IPCC AR6. Gulf includes Bahrain, Kuwait, Oman, Qatar, Saudi Arabia, and United Arab Emirates. BRICS refers to the original members (Brazil, Russia, India, China) and South Africa.
The calculation of 1.5C and 2C budgets used the same methodology as Fanning and Hickel: taking the remaining CO2 budget consistent with keeping temperatures below those levels from 2020 (360Gt for keeping temperatures <1.5C, and 1,035Gt for <2C) and adding those to cumulative emissions by the year 2020. However, while in Fanning and Hickel 2020 data was not available, and therefore the authors used forecasts to fill that gap, that was unnecessary in this paper given the additional years’ data. The exact budgets also differ slightly given the data updates (see section 2).
Notably, China has not used up its CO2 budget using either the 1.5C or 2C budgets, despite high absolute emissions. By contrast, the share of excess emissions accounted for by Gulf States increases, as it does with annex countries.
The 325ppm budget is set at the level of cumulative emissions in 1970, as this was the year in which it is estimated that the world passed that concentration level. This number was taken from Hansen et al., in which they find that the uncertainty associated with the estimate for a safe concentration of CO2 as a result of other gases is approximately -/+ 25ppm.
[1] The group of high-income countries obligated to provide climate finance to developing countries under the UN climate convention.
[2] This change to the methodology slightly reduces the responsibility from on-Annex II countries. But most future population increase comes from countries that are not near the threshold for exceeding their budget, and so the primary impact via decreasing the population shares of other countries, including China.
[3] According to the Mauna Loa Observatory, 350ppm was actually surpassed in 1988. Hickel possibly uses another dataset but this is not specified. The Fanning and Hickel update use the year 1988 for the 350ppm threshold.
[4] See https://media.odi.org/documents/ODI_The_new_collective_quantified_goal_and_sources_of_funding.pdf for a full discussion
[5] We use the PPP measure of GNI per capita as a better measure of welfare. For international climate finance provision, it could be argued that the atlas measure (which reflects actual exchange rates, not those adjusted for price levels across countries) is a more appropriate. The results are similar either way: the largest differences between PPP and atlas measures occur in the poorest countries that are nowhere near exceeding their CO2 budget.
[6] Total warming between the periods was estimated to be lower than the sum of these values (around 1.07C) because of other cooling effects, for example from aerosols.
[7] Linked chart shows annex I but same is true for annex II based on the downloaded data.
[8] We estimate methane emissions in the atmosphere as exp(-t/11.8) where t is year since the emission occurred.
Topics
CITATION
Ritchie, Euan. 2026. Which Countries Have Exceeded Their Carbon Budgets? . Center for Global Development.DISCLAIMER & PERMISSIONS
CGD's publications reflect the views of the authors, drawing on prior research and experience in their areas of expertise. CGD is a nonpartisan, independent organization and does not take institutional positions. You may use and disseminate CGD's publications under these conditions.
Thumbnail image by: Schankz/Adobe Stock