Recommended

DATA VISUALIZATION

Blog Post
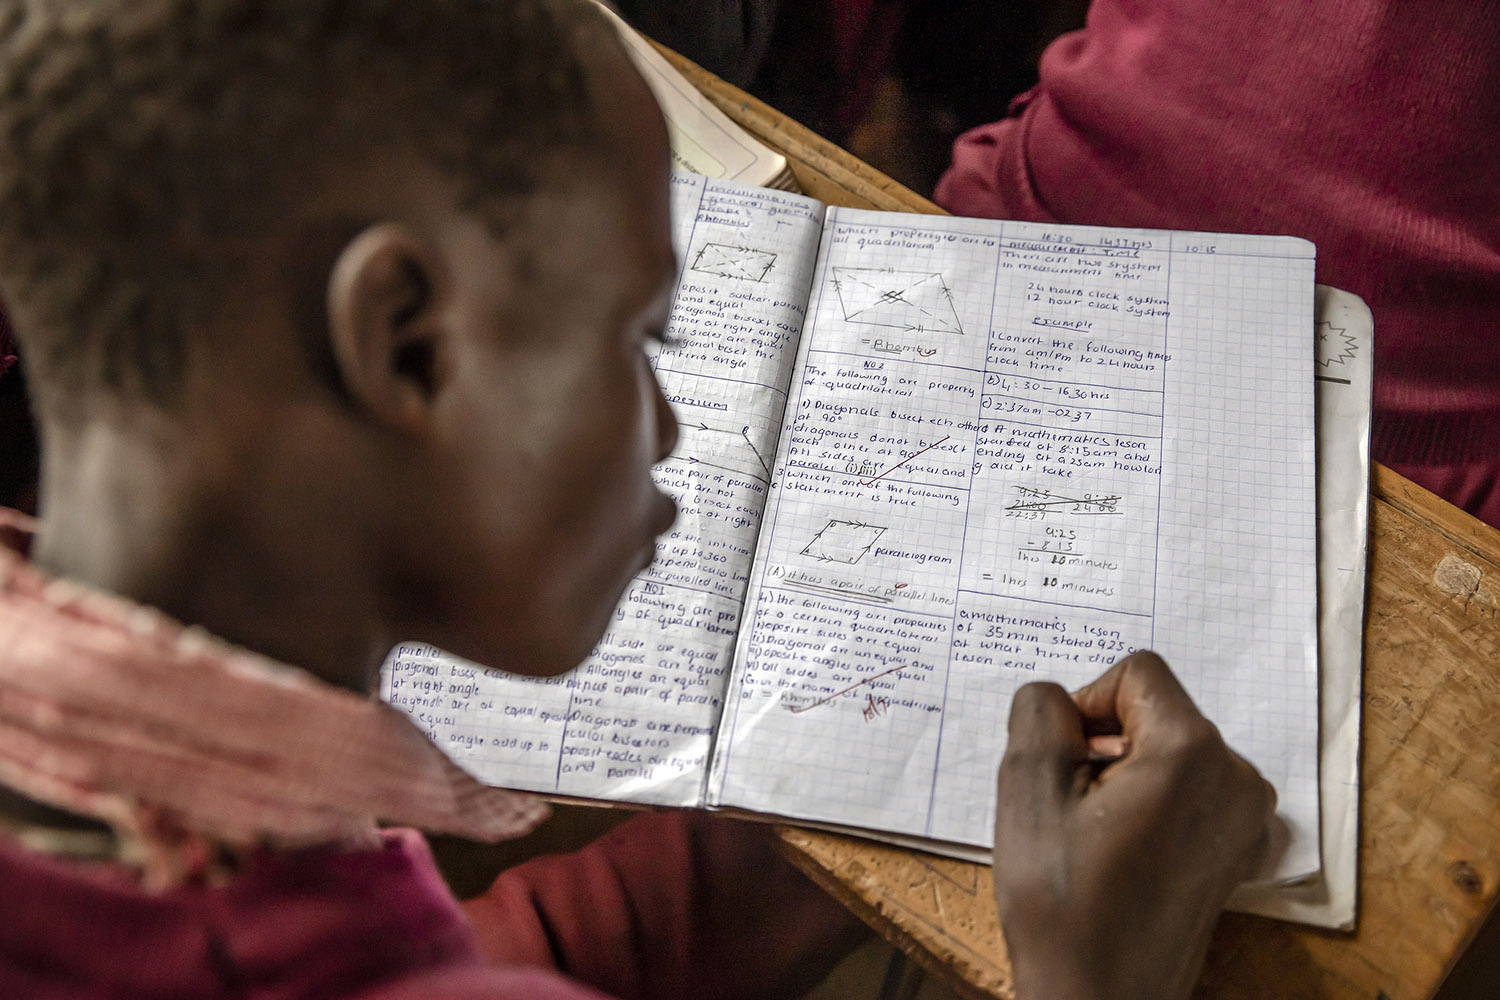
Violence in Schools Is Bad for Learning

BRIEF
Violence in Schools: Prevalence, Impact, and Interventions
Thousands of children experience violence in and around schools. In previous CGD research, we have explored its prevalence, consequences, and the role of promising interventions. To inform our work, we have used a wide range of international surveys with questions on school-related violence (see our cool map of surveys here) and found that relevant data were scattered, and no country-level repository of key statistics on school-related violence existed.
To make information more accessible for others working on this hugely important issue, we have compiled data from nine international surveys in an easy-to-access interactive map, allowing users to explore the status of school-related violence country by country.
In this blog, we explain what you’ll find in the new data hub, including prevalence statistics and an analysis of data gaps. We hope this tool motivates further data collection efforts and helps drive concrete action to end violence against children in and around schools.
Figure 1: Interactive Map
Click here to view the map: https://public.flourish.studio/visualisation/22215703/
What to expect from the new data hub?
The interactive map shows country-level information on school-related violence for 92 low- and middle-income countries: 35 countries in sub-Saharan Africa, 25 in Asia, 10 in the Middle East and North Africa and 22 in Latin America and the Caribbean. For each of these countries, users can download a factsheet that provides information on three key topics:
Violence-related statistics: We show statistics on the prevalence of bullying, corporal punishment and sexual violence reported by children and adolescents. The availability of data for each country varies, but the 92 countries included in the interactive map have data on at least one of these forms of school-related violence. The statistics included in the country factsheets were created using nationally representative data from nine international surveys collected between 2008 and 2023 (Figure 2). You can read our methodology note to learn more about the survey prioritization protocol we followed to create the violence-related statistics.
Figure 2. Surveys used to build school-violence-related indicators
Corporal punishment bans: We include information on the country status of corporal punishment bans based on data from the End Corporal Punishment initiative, which monitors global legislation on corporal punishment.
Country comparisons: Data across surveys is not comparable due to differences in the age of respondents, question phrasing, and perpetration timeframe. Therefore, the interactive map should not be used to make comparisons across countries unless the violence indicator was measured using the same survey data. You will be able to find this type of comparison in our country factsheets. For example, we compared bullying figures between countries that participated in the same PISA round, and we compared sexual violence figures for countries within 3 years of a VACS survey.
Data gaps: Based on CGD's previous analysis on data availability on school-related violence in low- and middle-income countries, the country factsheets highlight key data gaps, indicating whether countries have data on physical, emotional, and sexual violence from peers and the school staff.
The country factsheets also include references to the benchmarking or diagnostic exercise that the Safe to Learn Coalition did in collaboration with 10 countries, providing an overview of the school-related violence prevention actions and policies implemented in these countries. The interactive map does not include information for 20 percent (23) of low- and middle-income countries. This is because these countries did not have data from any of the nine international surveys prioritised in the analysis. Moreover, the country factsheets do not include statistics based on national surveys. Exploring whether countries also have national surveys (e.g., household surveys usually conducted by national statistics offices) with questions on violence against children would complement our analysis. In this CGD paper, we include some examples of national surveys in 17 low- and middle-income countries.
What did we learn?
Levels of violence are high: Children face unacceptably high levels of violence. Bullying rates among adolescents range from 12 percent to 69 percent across 54 countries with GSHS data. In Sub-Saharan Africa, countries with VACS surveys report corporal punishment levels as high as 48 percent. And, among children who experience any form of sexual violence, up to 28 percent of incidents occur in school settings.
Corporal punishment in schools is lawful in 62 countries: Studies have shown a negative correlation between corporal punishment and children’s learning potential, mental health and well-being. Corporal punishment bans are a necessary step that should be complemented by policies and interventions that ensure legislation enforcement, and promote changes in attitudes and norms around the use of corporal punishment.
Countries lack recent data on violence: Many countries rely on data that is 5 to 10 years old. For example, in 34 countries with bullying data from the GSHS, 62 percent are based on data that is at least 10 years old (from 2015). Moreover, of 54 countries with sexual violence data (from DHS or VACS), 31 percent are at least 10 years old, and for corporal punishment, 40 percent of the 15 countries with VACS data are from 2015 or before. For these countries, we don’t know whether more recent data would show similar, higher, or lower levels of violence. However, based on trends observed in countries with data spanning multiple years, it is unlikely that violence levels have decreased.
Big data gaps prevail[1]: One in five low- and middle-income countries don’t have data from international surveys administered to children and young adults to measure the prevalence of bullying, corporal punishment, or sexual violence. Among those countries with data, a third have data only for one form of violence. Most countries have information on bullying (71 percent), while 36 percent have data on sexual violence perpetrated in the school, and 16 percent on corporal punishment by teachers. Furthermore, most of the available data—except for ERCE and TIMSS—only include children aged 12 and older (forthcoming CGD analysis will help reduce data gaps for younger children). Many countries still lack the data needed to answer fundamental questions that policymakers might ask to address violence, including data to monitor progress in reducing violence.
From data to action:
The interactive map provides an easily accessible platform to explore the status of school-related violence country-by-country. It highlights the need for more recent, comprehensive and high-quality data on all forms of violence, particularly for young children, children with disabilities, and LGBTQ+ students.
In addition to enhancing data collection efforts, the persistently high levels of violence emphasize the urgent need for immediate action to address this critical issue.
We recommend reviewing our methodology for details on the prioritization protocol followed to create the interactive map and country factsheets. We welcome feedback to improve future versions of our country factsheets. Please don’t hesitate to contact us with any suggestions.
Many thanks to the Education Program team members for their feedback and contributions.
[1] The data gaps analysis is focused on the availability of international surveys administered to students. The data gaps remain similar if we include surveys administered to teachers or headteachers. For those interested in reading more about surveys administer to teachers or headteachers, we recommend reading our previous work here: Evans et al (2025).
Topics
DISCLAIMER & PERMISSIONS
CGD's publications reflect the views of the authors, drawing on prior research and experience in their areas of expertise. CGD is a nonpartisan, independent organization and does not take institutional positions. You may use and disseminate CGD's publications under these conditions.
Thumbnail image by: Riccardo Niels Mayer/ Adobe Stock