Recommended
Blog Post
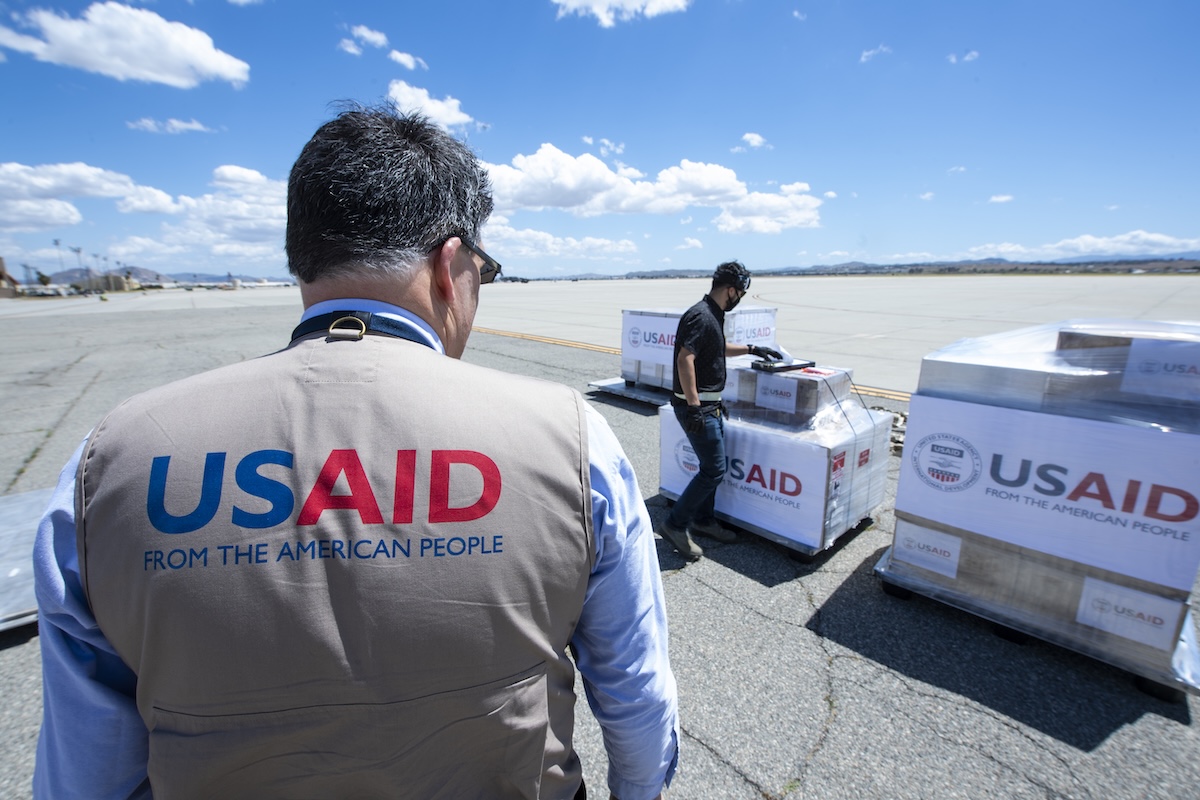
USAID Cuts: New Estimates at the Country Level
CGD NOTE
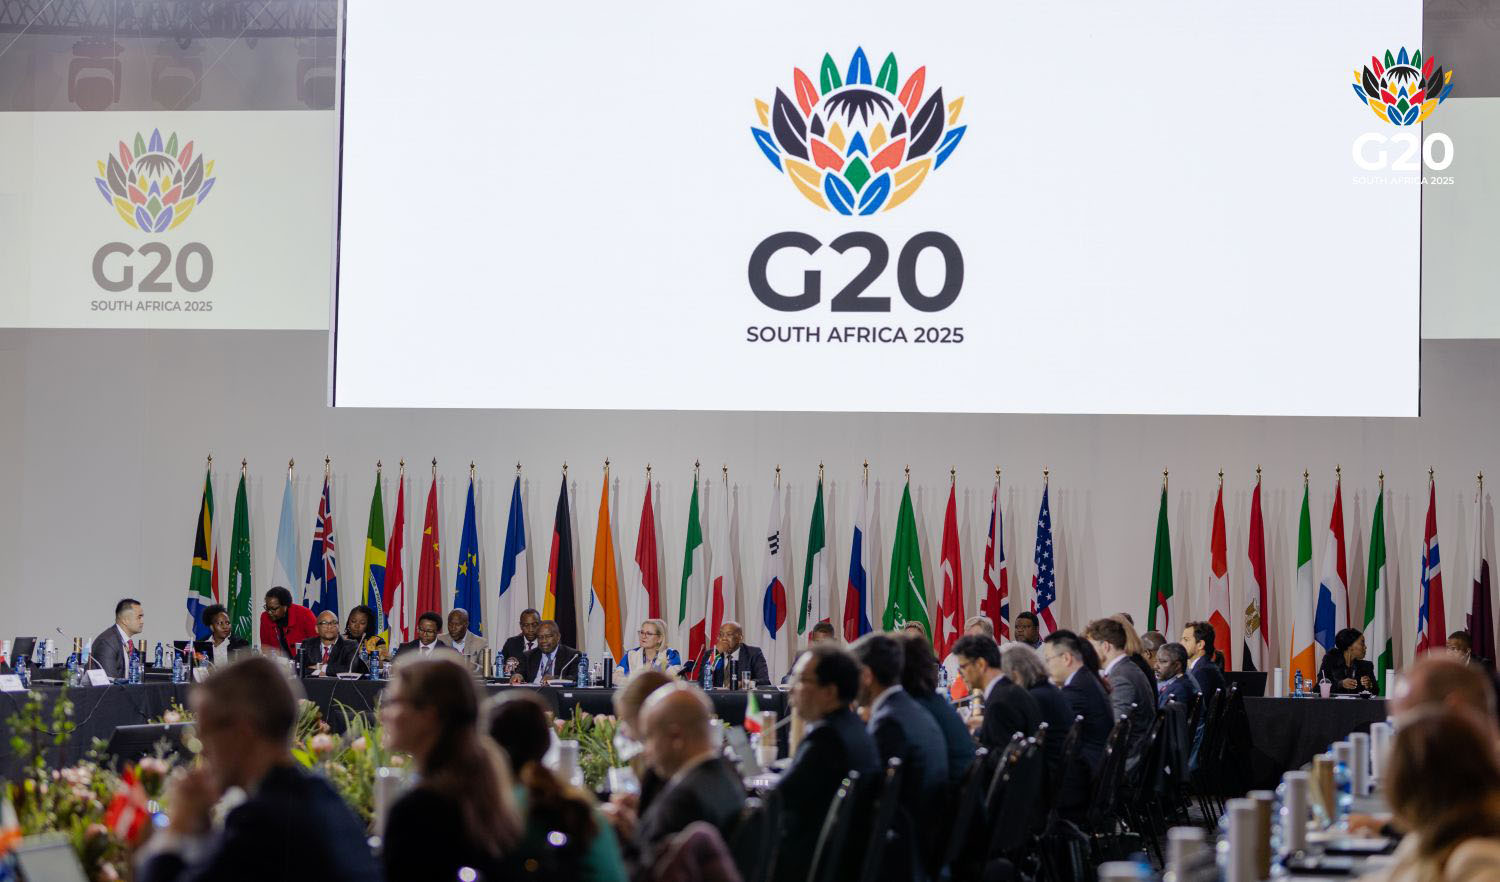
Zero LICs by 2040: A Call for G20 Action
Long-term changes and the lessons of the past decade suggest rhetoric around what aid can accomplish needs to be dialed down. It is largely macroeconomically irrelevant in middle-income countries and has a weak record in leveraging or crowding in other resources. But aid still has a vital role to play in the poorest countries, and this is where we should spend it.
Introduction
In September 1966, the American Economic Review published a paper on “Foreign Assistance and Economic Development” by Hollis Chenery and Alan Strout, the first a former assistant administrator and the second the acting head of the Policy Division at the recently created US Agency for International Development.[1] The paper opened with a description of the role of foreign assistance in low- and middle-income countries:
“Most underdeveloped countries depend heavily on external resources to increase their per capita income… the net flow of some $9 billion per year from advanced to less developed countries… is equal to a quarter of their gross investment and nearly a third of their imports…. Private investment… comprises only a quarter of the total resource flow… the inflow of external resources—which can loosely be called "foreign assistance"—has become virtually a separate factor of production, whose productivity and allocation provide one of the central problems for a modern theory of development…. The possibilities of securing rapid and sustained development by effective use of foreign assistance have been strikingly demonstrated in the past decade by such countries as Greece, Israel, Taiwan, and the Philippines.”
Surely these were optimistic times to be in the aid industry. Foreign assistance was (widely considered to be) hugely important to economic development prospects across developing countries. It must have been a particularly heady moment to work at USAID—the US was responsible for more than 50 percent of global aid flows.[2]
Sixty years later, USAID is a husk, and donors across the OECD are retrenching. But for all of the harmful and unnecessary destruction of the last few months, the plausible role of aid in development has been shifting for decades. That’s largely (and thankfully) about changes in the aid industry’s client countries, which have been experiencing considerable economic growth.
Indeed, the need for a wholesale rethink of the role of aid based on just the past 12 months might be exaggerated: pessimistic forecasts suggest that, in constant dollars, global ODA in 2027 would still be more than ODA was eight years earlier.[3] But the long-term changes as well as lessons from the past decade suggest rhetoric around what aid can accomplish needs to be dialed down, in part to ensure what is left can be used where it can have a significant impact.
Ballooning rhetoric on what aid can accomplish
The last few years have seen many commentators in global development embracing two contradictory ideas at the same time. First, that we are increasingly in a “post-aid world”—at the aggregate, ODA is less significant compared to domestic taxes, private flows, and remittances. Second, that the global solidarity embodied in agreements including the Sustainable Development Goals calls for a lot more investment backed by aid. The thesis and antithesis achieve synthesis in the idea that a little bit of ODA can unlock a lot of the other financial flows: billions in aid foster trillions in investment by catalyzing, leveraging, and crowding in.
The result: ODA is seen as the dynamo to power $300 billion (or more) climate finance commitments as well as the multi-trillion-dollar costs of achieving the full range of Sustainable Development Goals.[4] It is a fairly stunning upgrade to the perceived power of a dollar of aid to achieve results from the comparatively modest multipliers suggested by Hollis Chenery’s work. And perhaps even more so from the rhetoric about the role of aid from the 1990s and 2000s, as embodied in the International Development Targets (which morphed into the Millennium Development Goals). These targets sought progress against extreme poverty, toward universal primary education, and improved child and maternal health, and had an estimated price tag of a mere $50 billion. Given that both Chenery’s work and the MDG costing studies were still, if anything, too optimistic about the general power of development assistance to achieve outcomes, the recent upgrade in expectations for aid is likely a mistake.[5]
That is not to say aid can’t make a difference: it does and can, on the scale of preventing millions of deaths and improving hundreds of millions of lives. But supersized expectations get in the way of delivering those outcomes. So, to the extent we need a reset over foreign assistance, it is driven far more by the importance of rebasing those expectations than it is by a 20 percent decline in flows. Not least, aid was becoming macroeconomically irrelevant in an increasing number of developing countries well before 2020. And it had proven a weak instrument of financial leverage well before 2020, as well.
Deflating relevance in expanding economies
Back in 1966, aid was macrocritical across much of the developing world. ODA and other official flows to low- and middle-income countries was worth about 9 percent of their gross fixed capital formation and 14 percent of their imports. But those halcyon days for the aid bureaucrat are largely past. By 2021 ODA as a share of capital formation was down to 2 percent and, as a share of imports, 3 percent (Table 1).
From a focus on some of the largest developing countries, aid spending has diffused, and the largest recipients tend to be (ever more) those facing conflict or humanitarian crisis of concern to the West, like Ukraine, Syria, and Afghanistan (See Annex Table 1).
In 1960, nearly 70 percent of all aid flowed to the top 10 recipients. By the 1990s, that share was below 40 percent. Still in that decade, 55 countries—more than a third of all aid recipients at the time—saw aid receipts worth more than 10 percent of GNI (Figure 1). And in 1990, aid to the 10 most populous recipient countries was still worth more than 3 percent of their aggregate GNI. But by 2022, that aggregate value was down to 0.7 percent (Figure 2). And despite increasingly flowing to smaller countries, by 2021 the number receiving more than 10 percent of GNI in aid was down to 22 countries, or 17 percent of recipients.
By 2021, ODA was worth less than a quarter of a percentage point of the income of middle-income countries (Figure 3). Ukraine is one of the few exceptions that proves the rule: aid is macro relevant in a mid-sized country that is on the border between lower- and upper- middle-income status, but only thanks to massive political mobilization in donor countries (the other middle income economies that see aid receipts worth more than 10 percent of GNI are West Bank and Gaza alongside 11 small island states).[6] And that all means the argument about any link between aid and economic growth is irrelevant to most developing countries (and the considerable majority of the population in the developing world): if all aid was spent in middle-income countries, it would still be utterly macroeconomically irrelevant in aggregate.
Compare low-income countries—those under $1,135 per capita GNI. In those countries, aid and other official flows are still worth 62 percent of gross fixed capital formation and 38 percent of imports. These are the countries—along with small island states—where aid remains macrocritical (Table 1).
Table 1. ODA in macro context
| Net ODA and OOFs to LIC s+ MICs as % | 1966 | 1970 | 2000 | 2021 |
|---|---|---|---|---|
| Net FDI and portfolio | 316% | 41% | 33% | |
| Gross fixed capital formation | 9% | 10% | 5% | 2% |
| Imports | 14% | 16% | 5% | 3% |
| Net ODA to LICs as % | 2000 | 2021 | ||
|---|---|---|---|---|
| Net FDI and portfolio | 456% | 396% | ||
| Gross fixed capital formation | 37% | 62% | ||
| Imports | 23% | 38% |
Data sources: World Bank, OECD
Figure 1. Number and proportion of aid-recipient countries receiving ODA > 10 percent of GNI

Data source: World Bank
Figure 2. Average net ODA as a percent of GNI for the 10 most populous aid recipients

Data source: World Bank
Figure 3. ODA/GNI of low-income and low- and middle-income countries (current categorization)

Data source: World Bank
Limited leverage
Attempts to retain relevance in MICs using aid to “leverage” or “crowd in” finance have largely failed (the exception: using ODA to provide capital to multilateral development banks that borrow on the markets and on-lend to governments and firms). Despite increased attention to domestic resource mobilization, the overall relationship between aid flows and domestic tax revenues remains, if anything, slightly negative.[7] Regarding the private sector, at the macro level there is arguably a weak positive relationship between aid flows and FDI, and the empirical evidence is somewhat more convincing in the poorest countries.[8] But the limited role of aid in sustaining private flows might be suggested by the fact that, in 2023 and 2024, net private flows to developing countries as a group were negative.[9]
Assistance directly targeted at increasing private investment has, if anything, an even worse record. After a quarter century of multi-billion-dollar aid efforts to attract private investment into infrastructure in developing countries, for example, public-private infrastructure deals add up to $1.28 per person per year in low-income countries. Deals involving private participation in transport, waste, energy, and water and sanitation infrastructure in developing countries as a whole peaked in 2012 at a total value of $157 billion. In 2023 it was just under one-half of that level.[10] And more than half of that finance still comes from the public sector, with the share climbing in the poorest countries. Since the IFC persuaded IDA to subsidize its work in the poorest countries through the Private Sector Window, IFC investments in low-income countries have been falling —they amounted to just $92 million in FY2024, or about 0.5 percent of IFC commitments that year.
With regard to aid as a tool to leverage policy reform, and to have a significant macroeconomic impact through that channel, the evidence for this is largely anecdotal, and hard to find in statistical analyses.[11]
A minor role in delivering global goods
The macro irrelevance of ODA in middle-income countries as a whole is one reason why it has a small role in delivering expensive global public goods. The $300 billion climate finance goal agreed last year disappointed activists for being far too small for a multi-trillion dollar investment challenge, even while it alarmed those concerned with assistance to the world’s poorest people for being large enough to eat all ODA.
Climate finance is diverting funds from adaptation and development in the poorest countries to mitigation in richer countries. Low-income countries received just 11 percent of climate finance in 2022, which makes some sense from a mitigation standpoint given they account for 0.5 percent of global emissions.[12]
A further issue is that, as with “leveraging the private sector,” it turns out ODA is poorly designed to influence aggregate emissions. Climate finance is spent on projects with tenuous links to climate and little if any attention to cost effectiveness. Studies looking at the relationship between aid finance for mitigation and subsequent emissions find that more finance is associated with more emissions, not less (the slightly better news: it’s a statistically fragile relationship and there’s no proof of causality). One example: between 2000 and 2019, Kiribati received mitigation ODA cumulatively worth 28 percent of its GNI. Over the same period, annual emissions in Kiribati increased from 36,000 to 57,000 metric tons of carbon dioxide equivalent.[13]
Thankfully, the climate battle mostly isn’t about international finance. It is about domestic regulatory and spending choices in the world’s larger richer economies, the speed of technological advance, and lowering tariff barriers against low-emission machinery and equipment.
With regard to another global public good, pandemic preparedness, there is some evidence that financial assistance has a short-term impact on zoonotic disease capacities, but in the longer term there was limited evidence it improved measures of response preparedness.[14] (Of course there is also the concern that our measures of preparedness appear weakly associated with outcomes in the event of actual pandemics.[15])
This is not to say there is no role for global public good provision backed by ODA in middle-income countries (including around the development of new technologies or supporting disease eradication goals), only that it is likely to be a limited one, playing a supporting role to domestic regulation and investment.
But vital in the world’s poorest countries
Aid still has an undeniably vital role, though. It is pretty much the one that Hollis Chenery envisaged: promoting development in the world’s poorest countries, home to the world’s poorest people. In those economies, most of the ones where ODA is still macroeconomically relevant, there is evidence that it can foster economic growth.[16] And even many aid critics support health assistance, which plausibly saves millions of lives a year, concentrated in low-income countries.[17]
The moral and political case for a poverty focus
The impact case for spending aid in the poorest countries is strong—it is where each dollar spent is likely to have the greatest effect on years of life expectancy, other measures of the quality of life, or economic growth.[18] To put it another way, these are the countries home to people who have the most limited access to the technological cornucopia of the last two hundred years of progress, where people are dying for the lack of vaccines that cost cents to produce, where people are living without access to clean water or light at night. These are the countries where the gap between the decent quality of life that humanity could afford to provide to everyone and actual living conditions yawns largest. Concerns with utility and justice dovetail in pointing to low-income countries as where we should concentrate aid resources.
It is also worth noting that this is the part of aid that is most politically popular in donor countries. If you look at US respondents for example, the proportion who say they back providing medicine and medical supplies as part of foreign aid is 83 percent, and food and clothing 78 percent. Economic development comes in at 63 percent (with minority Republican support).[19] Across the EU, respondents want development assistance to prioritize peace and security, health, and economic growth with a focus on Africa. (For what it is worth, bread-and-butter development is what people in client countries want out of ODA as well.)[20]
Policies for Impact
It is not implausible that total global development assistance volumes could fall by 20 percent (~$40 billion) over the next two years. There was a similar decline in the early 1990s as the Cold War rationale for assistance lost traction. But the decline was dramatically reversed over the course of the next 10 years in part through the development of new rationales, including the 1996 International Development Targets (later adopted as the Millennium Development Goals), that set poverty reduction at the core of assistance.
These new rationales and approaches not only provided political impetus to more spending, but they also helped focus that spending where it could make a greater difference (the poorest countries, provision of lifesaving support). That approach was right in the 1990s; it is even more needed today after another quarter-century of growth in developing countries has further focused where ODA can make a meaningful difference. Aid can’t deliver the SDGs, but it could help finish the job on the MDGs.
What might be good targets? What about universal access to a future HIV vaccine (perhaps using an advance market commitment), or to driving malaria to extinction or TB to irrelevance, or a global cash safety net to eradicate extreme poverty, or a G20 target and program to graduate all low-income countries to middle-income status?[21]
In terms of existing institutions, a sharp focus on the poorest means protecting funding for IDA, Gavi, and the Global Fund. It means rather than the Millennium Challenge Corporation providing macroeconomically irrelevant compacts to richer developing countries, it makes larger repeat compacts to poorer countries. Perhaps it means lowering the ODA income threshold (as well as throwing out refugee hosting as ODA-eligible).
A sharper focus on the poorest also calls for greater flexibility of approaches to respond to the differing political and institutional environments of fragile states and those in conflict, kleptocratic states and those with comparatively effective governance. The goal should be adopting engagement in different forms (working with governments where possible, with nongovernment actors where necessary) rather than forcing a choice between engagement versus disengagement.
What about support to middle-income countries for global public goods? Scale in those countries requires a lot more money, that could only be provided at near-market rates on the model of development banks—as we’ve seen, the one reliable, scalable tool of ODA leverage that we have created, with returns of four or five dollars of lending to one dollar of capital. Some bilateral aid agencies are already engaged in profit-making sovereign lending and, while it shouldn’t count as ODA, it surely can as climate finance.[22]
Aid works, but it isn’t fairy dust. Assuming we can use leverage so that sprinkling an economically insignificant amount of ODA leads to a macroeconomically significant impact in middle-income countries is magical thinking—and simply a recipe to waste aid. That same volume of support can save lives and improve outcomes in the world’s poorest countries. A focus on those countries is morally, practically, and politically correct: it helps those who need it the most, where we know aid can deliver, and where there is the strongest constituency to support it.
Annex Table 1
| Year | Share of All Aid Going to Top Ten Recipients (%) | Names of Top Three Recipients |
|---|---|---|
| 1960 | 69.1% | India, Algeria, Pakistan |
| 1961 | 60.2% | India, Algeria, Brazil |
| 1962 | 61.5% | India, Algeria, Pakistan |
| 1963 | 64.5% | India, Pakistan, Algeria |
| 1964 | 64.4% | India, Pakistan, Viet Nam |
| 1965 | 58.8% | India, Pakistan, Viet Nam |
| 1966 | 58.3% | India, Viet Nam, Pakistan |
| 1967 | 60.3% | India, Pakistan, Viet Nam |
| 1968 | 57.3% | India, Viet Nam, Pakistan |
| 1969 | 56.8% | India, Viet Nam, Korea, Rep. |
| 1970 | 55.5% | India, Indonesia, Viet Nam |
| 1971 | 56.0% | India, Indonesia, Viet Nam |
| 1972 | 50.2% | India, Viet Nam, Indonesia |
| 1973 | 53.1% | Egypt, Arab Rep., India, Indonesia |
| 1974 | 54.8% | Egypt, Arab Rep., India, Syrian Arab Republic |
| 1975 | 56.5% | Egypt, Arab Rep., India, Bangladesh |
| 1976 | 57.3% | Egypt, Arab Rep., India, Pakistan |
| 1977 | 53.0% | Egypt, Arab Rep., Syrian Arab Republic, India |
| 1978 | 47.3% | Egypt, Arab Rep., India, Bangladesh |
| 1979 | 48.6% | Syrian Arab Republic, Egypt, Arab Rep., Jordan |
| 1980 | 48.0% | India, Syrian Arab Republic, Jordan |
| 1981 | 43.4% | India, Syrian Arab Republic, Egypt, Arab Rep. |
| 1982 | 42.2% | India, Egypt, Arab Rep., Bangladesh |
| 1983 | 43.0% | India, Egypt, Arab Rep., Israel |
| 1984 | 40.7% | Egypt, Arab Rep., India, Israel |
| 1985 | 42.8% | Israel, Egypt, Arab Rep., India |
| 1986 | 39.6% | India, Israel, Egypt, Arab Rep. |
| 1987 | 36.6% | Egypt, Arab Rep., India, Bangladesh |
| 1988 | 38.8% | India, China, Indonesia |
| 1989 | 38.1% | China, Indonesia, India |
| 1990 | 38.0% | Egypt, Arab Rep., China, Bangladesh |
| 1991 | 39.1% | Egypt, Arab Rep., India, Poland |
| 1992 | 38.9% | Egypt, Arab Rep., China, India |
| 1993 | 36.1% | China, Egypt, Arab Rep., Russian Federation |
| 1994 | 35.0% | China, Egypt, Arab Rep., India |
| 1995 | 36.3% | Poland, China, Zambia |
| 1996 | 31.7% | China, Israel, Egypt, Arab Rep. |
| 1997 | 29.6% | China, Egypt, Arab Rep., India |
| 1998 | 30.5% | China, Egypt, Arab Rep., India |
| 1999 | 33.0% | China, Indonesia, Russian Federation |
| 2000 | 31.8% | China, Indonesia, Russian Federation |
| 2001 | 30.3% | Pakistan, India, China |
| 2002 | 31.3% | Mozambique, Serbia, Pakistan |
| 2003 | 32.8% | Congo, Dem. Rep., Iraq, Indonesia |
| 2004 | 30.7% | Iraq, Afghanistan, Congo, Dem. Rep. |
| 2005 | 52.1% | Iraq, Nigeria, Afghanistan |
| 2006 | 45.1% | Nigeria, Iraq, Afghanistan |
| 2007 | 40.6% | Iraq, Afghanistan, Tanzania |
| 2008 | 38.2% | Iraq, Afghanistan, Ethiopia |
| 2009 | 34.7% | Afghanistan, Ethiopia, Iraq |
| 2010 | 36.2% | Afghanistan, Congo, Dem. Rep., Ethiopia |
| 2011 | 38.2% | Afghanistan, Congo, Dem. Rep., Pakistan |
| 2012 | 34.6% | Afghanistan, Viet Nam, Ethiopia |
| 2013 | 36.4% | Egypt, Arab Rep., Afghanistan, Viet Nam |
| 2014 | 34.3% | Afghanistan, Viet Nam, Syrian Arab Republic |
| 2015 | 33.3% | Syrian Arab Republic, Afghanistan, Pakistan |
| 2016 | 35.2% | Syrian Arab Republic, Ethiopia, Afghanistan |
| 2017 | 36.7% | Syrian Arab Republic, Ethiopia, Afghanistan |
| 2018 | 37.9% | Syrian Arab Republic, Yemen, Rep., Ethiopia |
| 2019 | 37.7% | Syrian Arab Republic, Ethiopia, Bangladesh |
| 2020 | 33.1% | Syrian Arab Republic, Bangladesh, Ethiopia |
| 2021 | 36.7% | Syrian Arab Republic, Egypt, Arab Rep., Bangladesh |
| 2022 | 46.6% | Ukraine, Syrian Arab Republic, Egypt, Arab Rep. |
Data Source: World Development Indicators - Net Official Development Assistance and Official Aid Received (Current US$) https://data.worldbank.org/indicator/DT.ODA.ALLD.CD
[1] Chenery, H. B., & Strout, A. M. (1966). Foreign Assistance and Economic Development. The American Economic Review, 56(4), 679-733.
[2] $3,451m out of $6,439m according to OECD data https://data-explorer.oecd.org/ --prior to the 2025 cuts, the US share was below a quarter. The USAID Administrator was, unsurprisingly, a frequent visitor to the White House. Norris, J. (2021). The enduring struggle: The history of the US Agency for International Development and America’s uneasy transformation of the world. Rowman & Littlefield
[3] https://devpolicy.org/burden-shedding-the-unravelling-of-the-oecd-aid-c…
[4] Songwe, V., Stern, N., & Bhattacharya, A. (2022). Finance for climate action: Scaling up investment for climate and development. London: Grantham research institute on climate change and the environment, London school of economics and political science. https://unctad.org/sdg-costing/about
[5] Clemens, M. A., Kenny, C. J., & Moss, T. J. (2007). The trouble with the MDGs: confronting expectations of aid and development success. World development, 35(5), 735-751.Easterly, W. (2003). Can foreign aid buy growth?. Journal of economic Perspectives, 17(3), 23-48. Clemens, M. A., & Moss, T. J. (2007). The ghost of 0.7 per cent: origins and relevance of the international aid target. International Journal of Development Issues, 6(1), 3-25.
[6] The countries are Tuvalu, Marshall Islands, Micronesia, Fed. Sts., Tonga, Kiribati, Solomon Islands, Samoa, Sao Tome and Principe, Vanuatu, Comoros and Timor-Leste. Another 10 middle income countries see receipts worth more than 5 percent of GNI. https://databank.worldbank.org/reports.aspx?source=2&series=DT.ODA.ODAT…
[7] Benedek, D., Crivelli, E., Gupta, S., & Muthoora, P. (2014). Foreign aid and revenue: Still a crowding-out effect?. FinanzArchiv/public finance analysis, 67-96.
[8] Selaya, P., & Sunesen, E. R. (2012). Does foreign aid increase foreign direct investment?. World development, 40(11), 2155-2176. Rao, D. T., Sethi, N., Dash, D. P., & Bhujabal, P. (2023). Foreign aid, FDI and economic growth in South-East Asia and South Asia. Global Business Review, 24(1), 31-47. Ahrisjo uses the Galliani et al approach of examining FDI at the IDA threshold and finds a link (although as FDI expands in growing countries, the effect may be through aid’s effect ion growth) Ahrsjo, U. (2016). Is Development Aid a Complement or a Substitute to Foreign Direct Investment?. Working Paper, WP 2016-06 Ahrsjo. EBA.
[9] https://www.brookings.edu/articles/swimming-against-the-tide-on-financi…
[10] https://www.cgdev.org/sites/default/files/Kenny-OxfordMartin-Speech-052…
[11] Svensson, J. (2000). "When is foreign aid policy credible? Aid dependence and conditionality." Journal of Development Economics, 61(1): 61-84 Easterly, W. (2005). "What did structural adjustment adjust?: The association of policies and growth with repeated IMF and World Bank adjustment loans." Journal of Development Economics, 76(1): 1-22. https://www.cgdev.org/blog/dive-new-data-mcc-effect Heckelman, J. C., & Knack, S. (2008). Foreign aid and market‐liberalizing reform. Economica, 75(299), 524-548.
[12] https://www.cgdev.org/sites/default/files/Kenny-OxfordMartin-Speech-052…
[13] https://www.cgdev.org/publication/does-mitigation-oda-reduce-emissions
[14] Boyce, M. R., Meyer, M. J., Kraemer, J. D., & Katz, R. (2022). "Financial Assistance for Health Security: Effects of International Financial Assistance on Capacities for Preventing, Detecting, and Responding to Public Health Emergencies." International Journal of Health Policy and Management, 11, 2054-61
[15] Bollyky, T. J., Hulland, E. N., Barber, R. M., Collins, J. K., Kiernan, S., Moses, M., ... & Dieleman, J. L. (2022). Pandemic preparedness and COVID-19: an exploratory analysis of infection and fatality rates, and contextual factors associated with preparedness in 177 countries, from Jan 1, 2020, to Sept 30, 2021. The Lancet, 399(10334), 1489-1512.
[16] Galiani, S., Knack, S., Xu, L. C., & Zou, B. (2017). The effect of aid on growth: Evidence from a quasi-experiment. Journal of Economic Growth, 22(1), 1-33.
[17] Shastry, G K and D L Tortorice (2025), “Effective Health Aid: Evidence from Gavi’s Vaccine Program”, American Economic Journal: Economic Policy 17(1): 540-574 Jakubowski, A, J Goldberg and A Killewald (2017), “PMI and Child Mortality in Africa: A Difference-in-Difference Analysis”, American Journal of Tropical Medicine and Hygiene 96(4): 758–764 Gaumer, G, Y Luan, D Hariharan, W Crown, J Kates, M Jordan, C L Hurley, and A Nandakumar (2024), “Assessing the impact of the President’s Emergency Plan for AIDS Relief on all-cause mortality”, PLOS Global Public Health 4(1): e0002467 Kenny, C., & Sandefur, J. The impact of US foreign aid cuts on global health. The Economic Consequences of the Second Trump Administration: A Preliminary Assessment. CEPR
[18] Kenny, C. (2021). We should be spending more of available aid in poorer countries, not less (CGD Working Paper No. 564).
[19]https://www.pewresearch.org/global/2025/05/01/majorities-of-americans-support-several-but-not-all-types-of-foreign-aid/ see also: https://www.kff.org/global-health-policy/americans-remain-wary-of-foreign-aid-but-are-more-supportive-of-spending-to-improve-health-abroad/ https://europa.eu/eurobarometer/surveys/detail/2952
[20] https://www.cgdev.org/blog/do-clients-want-world-bank-focus-climate
[21] Kenny, C. (2024). An End to Extreme Poverty?:(or at Least the Extreme Poverty Line) (No. 694). Center for Global Development.
[22] https://www.cgdev.org/blog/do-oda-loan-rules-incentivise-lending-poorer-countries
Topics
CITATION
Kenny, Charles. 2025. Aid Isn’t Fairy Dust. Center for Global Development.DISCLAIMER & PERMISSIONS
CGD's publications reflect the views of the authors, drawing on prior research and experience in their areas of expertise. CGD is a nonpartisan, independent organization and does not take institutional positions. You may use and disseminate CGD's publications under these conditions.
Thumbnail image by: US Africa Command/ Flickr