
Recommended

Blog Post
Between Iran and a Hard Place

Blog Post
The Iran War Oil Shock Will Hit the Hungry Hardest
Summary
There are concerns that this year’s El Niño—set to be the largest in living memory—could add another source of pressure on global food markets, alongside volatile global oil and fertilizer prices as a result of conflict in the Middle East, and renewed disruption of Black Sea grain exports as a result of the Russia-Ukraine war.
One organisation’s modelling even “indicates that up to 20 percent of global food production could be at risk over the next 12 months, potentially translating into hundreds of billions of dollars in lost economic output.”
So, are we heading for a food price spike that pushes millions into hunger and extreme poverty, as well as causing inflationary pressures across the global economy?
In this note, we examine recent trends in international grain markets—arguably the most important to food security—and consider three key factors: stock levels; elevated fertilizer and energy costs; and the forthcoming El Niño.
In short, we find that while projected stocks of wheat and maize in major exporters have fallen modestly since the start of 2026, they remain relatively high by historical standards, whilst projected stocks of rice in major exporters have been rising. So, stocks continue to act as a crucial buffer.
We also note that recent instances of “very strong” El Niño’s have not caused drops in average global grain yields. But ongoing conflicts in and around the Persian Gulf and Black Sea could leave international agricultural markets less able to absorb any supply shocks caused by El Niño. In the case of the Russia-Ukraine war, the scope for a direct impact on a large portion of global exports retains the potential to cause a spike in wheat prices, once again, in its own right.
We urge leaders to prioritise keeping Black Sea trade routes open and, in the case of El Niño, for trade and agriculture ministers to monitor developments but avoid knee-jerk responses like export restrictions, which are more likely to cause price spikes than the weather pattern itself.
International grain prices have risen over 2026, but are still within normal ranges
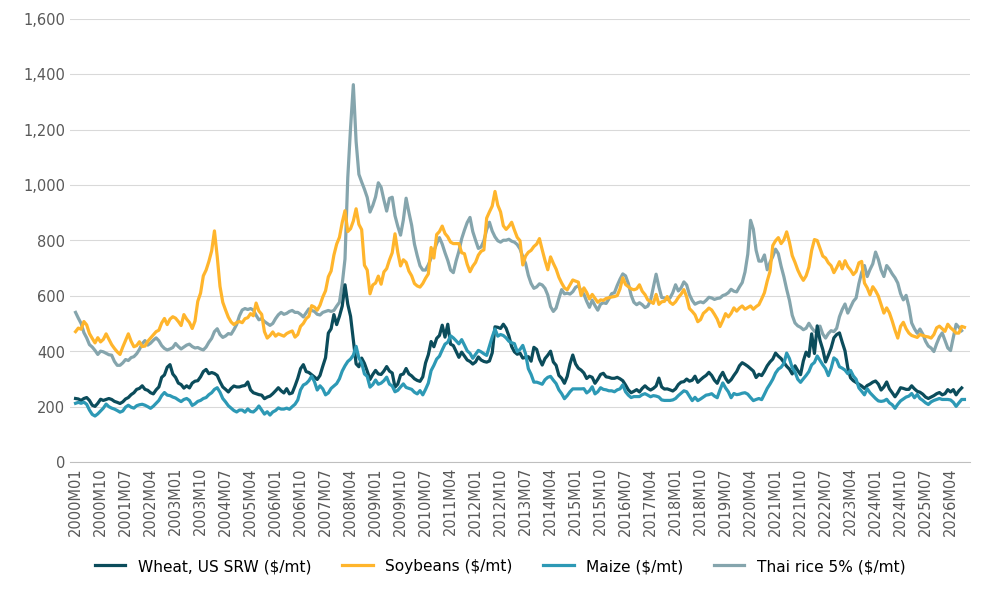
International prices for the most important four agricultural commodities (maize, wheat, rice and soybeans) have gradually increased over much of 2026. Near-dated futures for Paris wheat, Chicago maize and Chicago soybeans have increased by 26 percent, 23 percent, and 29 percent respectively over the course of 2026. [i] Nonetheless, as Figure 1 shows, grain and soybean prices are, so far, well within normal ranges and well-short of price-spike levels.
Figure 1. International grain and soybean prices from 2000 (US$/t - August 2026 prices)
Source: World Bank Commodity Prices adjusted by the PPIACO index, Federal Reserve Bank of St Louis
Furthermore, as yet, futures markets are not pricing in a supply shock over the course of 2027 (see Table 1). Futures prices for maize, oilseeds, and Paris wheat for the end of 2027 are either very close to, or lower than, current price levels. Chicago wheat is slightly different, with December 2027 prices showing a modest premium of around $14/t compared to December 2026 prices.
Table 1. Forward prices compared to near-dated prices, as of September 18, 2026
| Contract | Near-dated future | Nov ‘27 | Dec ‘27 | Late ’27 vs near-dated future |
|---|---|---|---|---|
| Chicago maize | $211.32 (Dec ’26) | $209.35 | -1% | |
| Paris maize | $316.38 (Nov ’26) | $266.51 | -16% | |
| Chicago wheat | $263.52 (Dec ’26) | $277.39 | +5% | |
| Paris wheat | $279.41 (Dec ’26) | $277.12 | -1% | |
| Chicago soybeans | $486.99 (Nov ’26) | $471.10 | -3% | |
| Paris rapeseed | $632.76 (Nov ’26) | $609.55 | -4% |
Source: AHDB and own calculations
At first sight, it may seem surprising that the combination of conflict in the Persian Gulf (disrupting fertilizer and diesel supplies), conflict in the Black Sea region (damaging grain export infrastructure and shipping) and the prospect of an El Niño of unprecedented size, has not caused more dramatic movements in international prices for grains and oilseeds.
There are a number of reasons for this. In short:
- Supply shocks don’t necessarily result in price spikes, because their impact can be buffered by stocks;
- Reduced fertilizer application rates may have less of an impact on yields, and total production, than intuition might suggest; and
- It is very hard to generalize about the likely severity of grain market impacts as a result of any given El Niño event; although
- Recent developments in the Black Sea are a particular cause for concern.
The rest of this note provides more detail on each of these points.
Stocks can buffer supply shocks that might otherwise cause price spikes
Supply shocks in one part of the world may be offset by increased production in other regions. Even where negative supply shocks outweigh increased production elsewhere, there may not be a price spike if international stocks are sufficient to allow for enough stock draw-down to compensate for lower production. But stocks can only buffer international prices if they are available to buyers on the world market.
China is thought to hold very high levels of grain stocks from year to year (about 44 percent, 61 percent, and 54 percent of global end-stocks of wheat, maize, and rice respectively, according to USDA’s latest projections). However, its stocks are not available to the world market on a reliable, commercial basis, and hence need to be discounted when thinking about the level of international stocks that can buffer shocks outside of China. This isn’t to say that Chinese stocks do not benefit the rest of the world at all. As and when China is faced with a domestic supply shock, its stocks allow it to choose between immediately importing to make up for reduced domestic production, or drawing down some of its stocks. As a result, pressures on international markets that might otherwise arise from a drop in Chinese production can be deferred, or even avoided, if China decides to draw down its stocks and only replenish them once global prices (and supplies) are more benign.
A key indicator of accessible stocks internationally is the level of projected end-stocks in major exporting countries: stocks expected to remain at the end of the growing and trading season and be carried over into the next. This is because the net effect of the various movements in global production, consumption, imports and exports crystalizes in the projections of major exporters’ end-of-season stocks, that are carried over into the next marketing year. If such end-stock projections are relatively high, then a modest supply shock somewhere in the international production system (and the associated increase in global demand for imports, or reduced scope for exports) will likely push prices up a bit, but relatively modestly. As end-stock projections become tighter and tighter, every subsequent negative piece of news regarding supply can be expected to have an ever-greater impact on prices. If projected end-stocks in the major exporters fall to very low levels, then international prices will spike to the levels required to ration demand in the exporters (both domestic demand and international import demand) back down to levels that are in balance with available supplies.
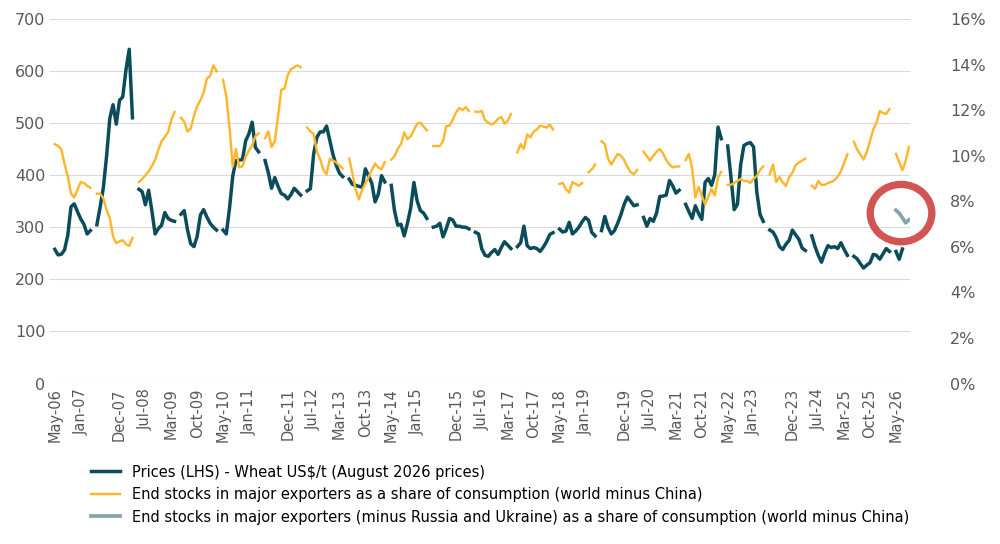
Figure 2 illustrates, for example, how prices for wheat responded, during 2006/08, when projected end-stocks in major exporters fell to very low levels due to supply shocks. It also shows that projected end-stocks of wheat in the major exporters, are still relatively benign, compared to the last 20 years or so.
Figure 2. Projected wheat end-stocks in major exporters* as a share of consumption (world minus China) and (real) international wheat prices**
Source: USDA WASDE, World Bank monthly commodity prices, and own calculations
* Argentina, Australia, Canada, EU (plus UK from 2021, for consistency), Kazakhstan, Russia, Ukraine, US
** US No.2 Soft Red Winter, export price, delivered to US Gulf ports
Projected end-stocks in major exporters are not a perfect leading indicator. For example, the movement in wheat prices is partly a function of end-stocks in the wheat market, but it also matters what is happening in the wider grain markets; because at the margin, and depending on relative prices, wheat can be used as animal feed.
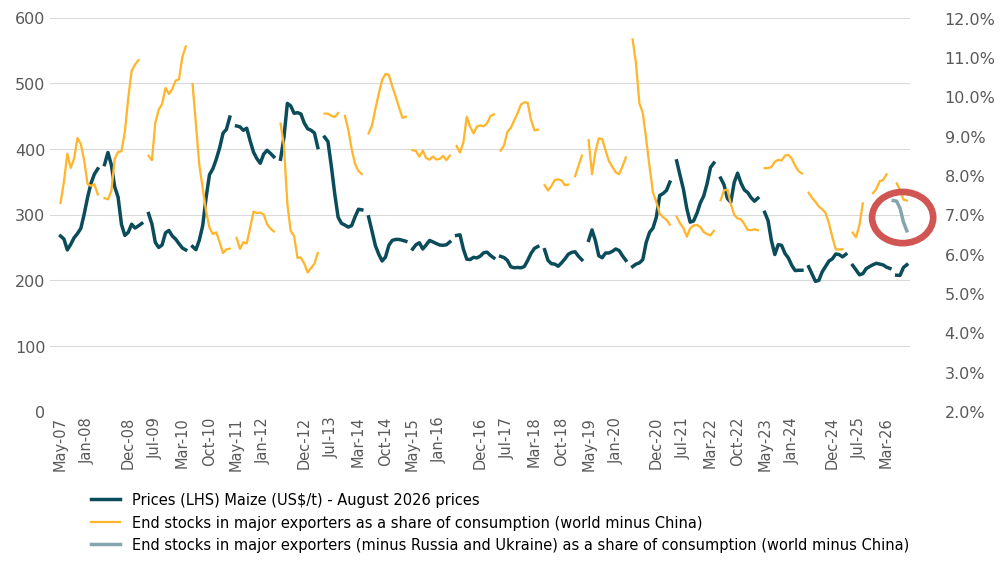
Figure 3. Projected coarse grain end-stocks in major exporters* as a share of consumption (world minus China) and (real) international maize prices**
Source: USDA WASDE, World Bank monthly commodity prices, and own calculations. * Argentina, Australia, Brazil, Canada, EU, Russia, South Africa, Ukraine, US. ** No. 2, yellow maize, f.o.b. US Gulf ports.
Indeed, Figure 3 shows how falling expectations for global production of maize and coarse grains as a whole, from August 2020 onwards led to rising maize prices, even before the further effect of Russia’s invasion of Ukraine.[ii] The transmission of changing conditions in coarse grain markets to wheat prices are visible in Chart 2, even though projected end-stocks for wheat were relatively high and stable during the 2020/21 marketing year.[iii]
Rice and its importance to food security
Rice is an important food commodity for many of the world’s poorest people, particularly those in South and Southeast Asia. The rice market is not directly exposed to disruptions to grain exports from the Black Sea region, although experience in the 2006/08 food price spikes suggests that concerns in the wheat market, for example, can trigger changes to rice export policies in key countries. This matters because the international rice market is particularly thin, making it prone to price volatility in the face of supply disruptions.[iv] Furthermore, the global rice market is particularly reliant on India, which, for the 2026/27 marketing year is projected to account for 40 percent of global exports and 90 percent of end-stocks amongst the major exporters represented in Chart 4. More generally, global rice production is particularly concentrated in South Asia and Southeast Asia, both of which are at greater risk of experiencing dry conditions in an El Niño year.
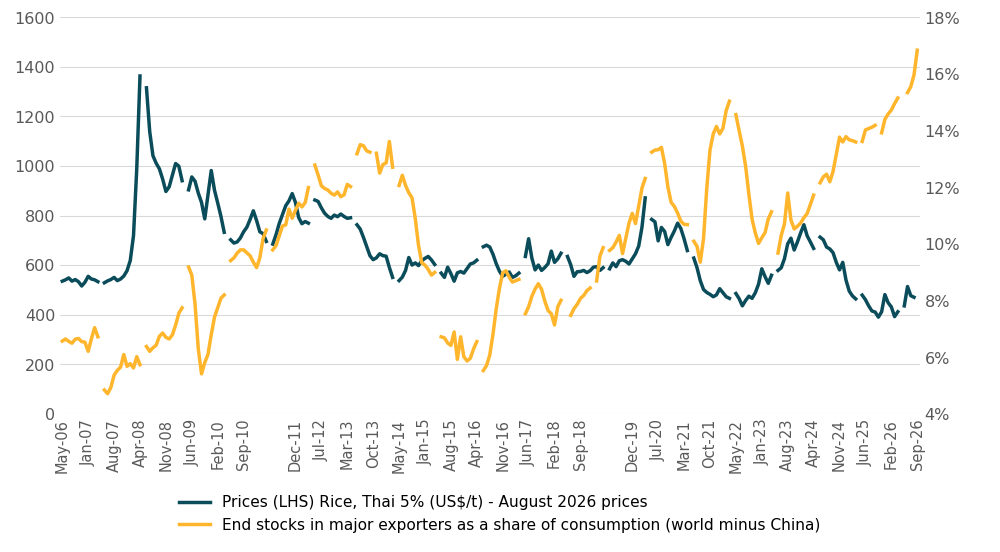
Still, as Figure 4 shows, projected end-stocks in major exporters of rice are at their highest level for more than 20 years, suggesting a relatively resilient position as long as countries avoid restrictions on trade.
Figure 4. Projected rice end-stocks in major exporters* as a share of consumption (world minus China) and (real) international rice prices**
Source: USDA WASDE, World Bank monthly commodity prices, and own calculations
* Burma, India, Pakistan, Thailand, US, Vietnam
** Rice (Thailand), 5% broken, white rice (WR), milled, indicative price based on weekly surveys of export transactions, government standard, f.o.b. Bangkok
Black Sea developments pushing up prices
The response of grain markets in 2022 showed how conflict in the Black Sea region can impact international grain prices (see Figure 2). Indeed, wheat price increases have again been triggered by attacks on grain export infrastructure and shipping in the Black Sea. The Black Sea isn’t the only potential route for grain exports from Ukraine and Russia, but transportation overland is slower and more expensive. Factors (including conflict) that inhibit exports from major exporters such as Ukraine and Russia may increase projections of their end-stocks, even if those end-stocks have to be discounted by the market because of accessibility issues. For example, the lines circled red in Charts 2 and 3 highlight what the end-stock projections for major exporters for the 2026/27 marketing year look like if the projected end-stocks for Russia and Ukraine are excluded entirely from the calculation.
Increased costs for getting Black Sea grain to export markets do not just increase costs to importers. This cost wedge will also reduce farmgate prices for grain in Ukraine and Russia, affecting the viability of production in the immediate term whilst also potentially (if farmers expect that prices will continue to be depressed in this way) affecting planting decisions for the 2027 harvest in those two countries, with implications for global markets and prices, relative to what would otherwise have happened. These are not academic points; across the 2023/24 and 2024/25 marketing years, on average, Ukraine and Russia accounted for 6 percent and 22 percent of global wheat exports respectively and 10 percent and 2 percent of global maize exports respectively.
Yield impacts of reduced fertilizer application rates
The impact of some market shocks can be less than intuition might suggest. Conflict in the Middle East in 2026 triggered concerns about agricultural input costs. Indeed, there was a substantial impact on international prices for diesel and fertilizer. However, prices for grains didn’t respond nearly as much, partly because (as noted above) projected end-stocks were relatively high, but also because the marginal impact on yield of reduced application rates for nitrogen fertilizer can be quite modest. Such marginal impacts will vary by country and by crop. However, in the UK, for example, relative to an optimum allocation of fertilizer under prevailing prices, a 7 percent reduction in nitrogen fertilizer application would be expected to result in only around a 1 percent yield loss, with a 17 percent reduction in nitrogen fertilizer application rates, resulting in only around a 3 percent yield loss. Of course, any factors reducing yields and hence international supply will weigh to some extent on projected end-stocks in the major exporters. So, whilst reduced application of fertilizer may not have had as significant an initial impact on international prices as intuition might suggest, it will still have made the international market a bit less resilient in the face of any subsequent supply shock.
Energy prices
Energy is an important input to agriculture and food processing and distribution. Higher energy prices add costs, both pre- and post-farmgate, in a range of ways. For example:
- Higher oil prices mean increased international freight rates, and hence a higher cost of landing imports (which will in turn often increase the market price of domestically produced grain in net importing countries) under any given scenario for world grain prices, especially if an importer is relatively distant from the most competitive origin, and/or imports rely on routes that are disrupted and the second-best route is much longer;
- Higher energy prices increase the cost of fertilizer production – including the use of gas and diesel in nitrogen and phosphate fertilizers respectively;
- Farmers use fuel and electricity directly, whilst they also play a key role in distribution and retail costs (which are themselves often a multiple of agricultural commodity costs); and
- Policies to encourage biofuels have helped to create a demand-side linkage. Once significant biofuel production capacity exists, demand for crops can rise as energy prices increase. Furthermore, there is a risk that countries may decide to introduce or expand national-level biofuel mandates, in a bid to reduce reliance on imports of petrol and diesel at times of international market disruption and price spikes in energy markets. In 2025, biofuel production already accounted for 17 percent of global maize consumption and 19 percent of global vegetable oil consumption.[v] An expansion of such consumption as a response to high oil prices could have a significant impact on grain and oilseed prices.
As with other pressures, the transmission to food prices in the short term will be determined by a range of factors, particularly grain stock levels. However, we note that current prices of around $100 per barrel for Brent oil are around 20 percent above their five-year average of around $83 per barrel. If sustained, this increase can be expected to gradually feed through to final prices for agricultural products, as it increases agricultural costs of production globally. This is in addition to the impacts on post-farmgate transport and processing costs already noted above.
The forthcoming El Niño
According to the UK’s Met Office, “2026 is going to be renowned for the development of the largest El Niño in living memory and what is probably the largest such event since the 19th century.” This matters, because the evidence is that certain parts of the world tend to be drier during an El Niño (such as Australia, India, and southern Africa) whilst other parts are generally wetter (such as some of the southern parts of South America, the Mediterranean, and parts of eastern Africa).[vi]
However, whilst this is sometimes apparent in the arable yields data for the most affected areas, it isn’t always the case (see Table 2). So, for example, there was a very strong El Niño in 2015 and 2016.[vii] This saw a substantial reduction in maize yields in South Africa of 25 percent and 21 percent in 2015 and 2016 respectively (relative to the average yields across the three years 2012-14), and a reduction in average wheat yields in India of 13 percent and 4 percent in 2015 and 2016 respectively. However, during the same El Niño event, wheat yields in Australia were up 4 percent and 38 percent respectively. Furthermore, in the very strong El Niño years of 1997 and 1998, the impacts on South African maize yields were more modest (a 9 percent increase in 1997 and a 6 percent drop in 1998) whilst wheat yields in India were up 8 percent in 1997 and flat in 1998. Across all four crops in Table 2, for each of the very strong El Niños, global average yields increased.
Table 2. Yields in selected countries during the three most recent ‘very strong’ El Niño years, compared to average yields in the three years prior to the El Niño
| 1991 | 1992 | 1997 | 1998 | 2015 | 2016 | |||
|---|---|---|---|---|---|---|---|---|
| Wheat | ||||||||
| India | 7% | 13% | 8% | 0% | -13% | -4% | ||
| Australia | -8% | 12% | 10% | 11% | 4% | 38% | ||
| Argentina | 16% | 24% | 23% | 9% | 6% | 22% | ||
| World | 2% | 6% | 8% | 7% | 4% | 7% | ||
| Rice | ||||||||
| India | 1% | 1% | 5% | 4% | -1% | 3% | ||
| Thailand | 7% | 6% | 2% | 4% | -8% | -9% | ||
| World | 3% | 5% | 4% | 3% | 1% | 1% | ||
| Maize | ||||||||
| Brazil | -7% | 18% | 6% | 13% | 8% | -17% | ||
| South Africa | 2% | -65% | 9% | -6% | -25% | -21% | ||
| USA | 2% | 24% | 0% | 6% | 12% | 24% | ||
| World | 7% | 13% | 3% | 10% | 4% | 9% | ||
| Soybeans | ||||||||
| USA | 10% | 21% | 2% | 2% | 10% | 18% | ||
| Brazil | -14% | 13% | 4% | 7% | 8% | 3% | ||
| Argentina | 11% | 13% | -17% | 31% | 25% | 19% | ||
| World | 3% | 12% | 2% | 7% | 9% | 12% | ||
Source: FAOSTAT yield data and own calculations
None of this is to say that there cannot be significant negative impacts on yields in key producing countries, as the result of the El Niño that is currently building, as the 65 percent drop in maize yields in South Africa in 1992 illustrates, or even globally. But experience suggests that it is very hard to generalize about the likely severity of grain market impacts of any given El Niño event.
Conclusion
We should not be complacent about the degree to which our changing climate may disrupt international agricultural markets, and to cause price spikes in agricultural commodities that are central to household food security across the world. Just because the impacts of the last three very strong El Niños have been mixed does not guarantee anything this time round, especially given the expected unprecedented strength of the El Niño that is currently building. Indeed, the size of end-stock projections in major exporters have eroded over the course of 2026, increasing the risk that any supply shocks in the next 18 months could cause prices to spike.
If the conflicts in and around the Persian Gulf and Black Sea are not resolved, their impacts on the availability of grain stocks, either because of yield erosion caused by reduced applications of fertilizer, or more directly by the increased cost of sourcing grain from a key net exporting region, will continue to make international agricultural markets less resilient in the face of any El Niño related supply shocks.
All of that said, as things stand, it is too soon to be clear about the impact of the El Niño event that is currently building. Current stock projections mean that international markets are relatively well-placed to deal with any further supply disruptions.
As things stand, the most pressing food security concern appears to be recent developments in and around the Black Sea, and the scope for the Russia-Ukraine war to cause spikes directly, once again, in international markets for wheat and other crops, rather than merely eroding the market’s resilience in the face of a separate supply shock.
[i] Percentages refer to the period 2nd January 2026 to 22nd September 2026. Source: Markets and prices | AHDB, and our own calculations.
[ii] Coarse grains are maize (corn in the US), sorghum, barley, oats, rye, millet, and mixed grains (although WASDE data excludes millet and mixed grains for the US).
[iii] Furthermore, although Figure 2 (wheat), Figure 3 (coarse grains) and Figure 4 (rice) include data for jurisdictions accounting for around 88%, 93% and 80%, respectively, of the USDA’s latest projections for global exports in the 2026/27 marketing year, what happens in the rest of the export markets also matters. This is complicated by the fact that some countries will move in and out of being significant exporters depending on harvests, or factors (administrative or otherwise) that limit exports. This means that some end-stocks may sometimes show up in the numbers and on Charts 2 - 4 even if they are much less accessible by the international market. Nevertheless, as Figures 2 - 4 show, grain prices do tend to be responsive to changing projections of end stocks in the major exporters.
[iv] Latest USDA (WASDE) projections for the 2026/27 marketing year are that exports will account for only a small share (12%) of global rice production, compared to 16% and 31% for coarse grains and wheat, respectively.
[v] OECD Data Explorer • OECD-FAO Agricultural Outlook 2026-2035
[vi] See, for example, The probability of the impact of ENSO on precipitation and near-surface temperature - ScienceDirect, and El Niño 2026-2027 | FEWS NET.
[vii] The US National Oceanic and Atmospheric Administration classifies El Niño and La Niña events depending on the strength of sea surface temperature anomalies in the Eastern Pacific, using three-month rolling averages. Warm (El Niño) and cold (La Niña) periods are based on a threshold of +/- 0.5°C. Such periods where the temperature anomaly is more than 2°C are regarded as ‘very strong’ (see for example https://ggweather.com/enso/roni.htm). The UK Met Office forecasts that the El Niño that is currently building will see a temperature anomaly that peaks at over 3°C (An ‘unprecedented’ El Niño and its implications for the weather forecast - Met Office).
Topics
CITATION
Bayley, Brendan, and Ian Mitchell. 2026. Will El Niño Mean Another Global Food Price Spike?. Center for Global Development.DISCLAIMER & PERMISSIONS
CGD's publications reflect the views of the authors, drawing on prior research and experience in their areas of expertise. CGD is a nonpartisan, independent organization and does not take institutional positions. You may use and disseminate CGD's publications under these conditions.
Thumbnail image by: Arne Hoel / World Bank