Recommended
BRIEF
Climate and Development KPIs
With levels of development finance falling, it is more important than ever to look beyond aid. The Commitment to Development Index (CDI) does just that—ranking the world’s most powerful countries on policies that affect global development.
In an increasingly interconnected and geopolitical world, decisions made by governments of major economies have impacts far beyond their borders, and often disproportionately affect the world’s poorest and most vulnerable. Despite a rise in nationalism in many countries, greater global prosperity is in the common interest, creating new economic and trade opportunities, increasing innovation, and reducing risks posed by global challenges in health, security, and climate.
The CDI covers eight distinct policy areas that affect development:

What does the CDI measure?
We assess countries across more than 40 indicators to come up with rankings for each of the eight policy components, as well as each country’s overall commitment to development. Countries score well for things like generous and high-quality finance for development, transparent investment, low barriers to trade for developing countries, and migration policies that are open and promote integration. Policies that enhance global public goods—such as fostering global health through disease prevention, supporting technological research, protecting biodiversity and the climate, and contributing to global security—also contribute to high scores.
How are countries doing?
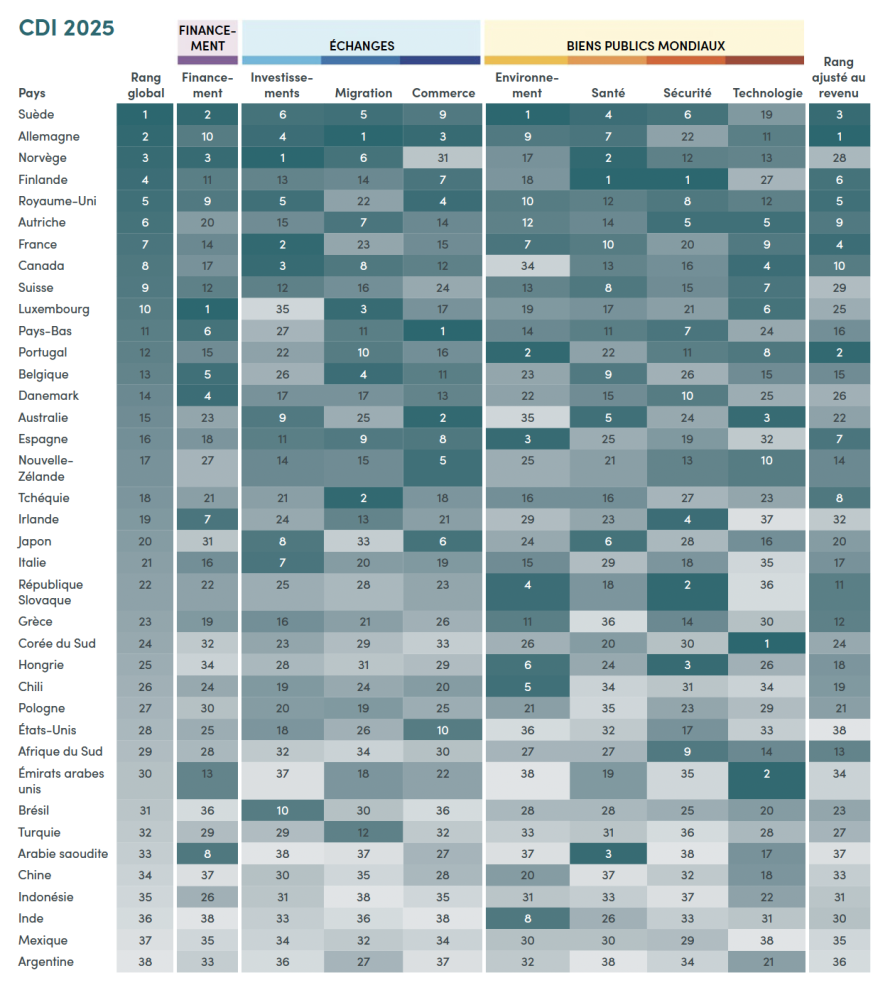
Sweden tops this year’s CDI, followed by Germany in second place and Norway in third place. Sweden ranks first in environment, second in development finance, and fourth in health. Its performance in technology, despite an increase in tax incentives for private R&D since the last CDI, remains relatively weak, with low levels of research collaboration. Though Sweden also finished top in the previous two editions of the CDI, its lead over the next-best-performing countries has shortened each time.
Germany comes second overall and is the highest-ranked G7 country; when scores are adjusted for country incomes, Germany overtakes Sweden to top the index. It ranks top of the migration component, following large increases in the numbers of migrants and refugees it accepts per capita. Norway ranks third, performing well in development finance and health—and ranking first for investment—but underperforming on trade and environment due to high agricultural subsidies and fossil fuel production.
Finland and the United Kingdom complete the top five: Finland comes first on health and security, while the United Kingdom scores strongly on its policies supporting investment in and trade with developing countries.
France dropped out of the top five to seventh overall, in part due to a series of cuts to its aid budget (the more recent cuts to the UK’s development budget are not yet captured in the data), though it still ranks in the top 10 across investment, environment, health and technology.
These results predate most of the steep cuts announced in four of the largest providers of development assistance—the US, UK, France, and Germany. Other providers have also announced cuts, and although the more recent and planned cuts are yet to appear in the official data, earlier reductions in the provision of development finance are already evident in our assessment. Still, finance is just one of eight components in the CDI.
Given the economic importance of countries in the G20, we include eight middle-income countries in the ranking. Despite dropping four ranks since the previous edition, South Africa still ranks highest among this group at 29th, with above-average contributions in technology and security. Türkiye and Brazil were the next highest, with relative strengths on migration and investment, respectively.
Luxembourg and Ireland have made the most improvement since the last edition of the CDI, each jumping four ranks. Luxembourg, now ranked 10th overall, is one of the few countries we measure to have increased its (already generous) provision of development finance, and it now tops that component. Austria and Chile each improved by three ranks, while the Netherlands dropped out of the top 10, falling five ranks to 11th.
Collective progress or decline?
While the rankings highlight how individual countries are doing relative to other powerful economies, and show ways in which they could be doing more for development, looking across the indicators can shine a spotlight on areas of collective progress or decline.
A majority of countries are giving less finance for international development than they were in the 2023 CDI (relative to the size of their economies). This is even before accounting for the recently announced cuts to aid budgets. Furthermore, we see that countries are also generally reducing the share of their development finance channelled through multilateral institutions, with this trend more pronounced among non-OECD providers (see section below on development finance quality).
Despite this clear backsliding on development finance, we do see some collective improvement across a number of non-aid policy areas. Between 2020 and 2022, the average CDI country accepted 70 percent more migrants per head of population—up from 66 per 10,000 people to 112 per 10,000 people—with migration from Ukraine, Russia, and Morocco among others driving that increase. Migration from these relatively wealthier countries, however, means that the average income of migrant origin countries has increased, and this is less good for development: a migrant arriving into a rich country from a poor one gains a greater relative increase in wealth and opportunities than a migrant worker from a wealthier country, and remittances they send home are also likely to be a more important component of income. The number of refugees hosted by each CDI country spiked in 2022 with large influxes of Ukrainian refugees, especially in neighbourhood countries such as Czechia and Poland, and those numbers have remained high.
On the environment, we see a majority of CDI countries reducing their emissions per capita, with almost three-quarters of countries improving between 2019 and 2023. This is especially important for development, as lower-income countries tend to be those most affected by the adverse impacts of climate change. However, although the average country has improved, as a collective group, the CDI countries were responsible for 3 percent more emissions in that same time frame: the significant increase in emissions in China alone more than negates the combined emissions reductions in all 30 countries that saw decreases.
Subsidies for fossil fuels (government support that lowers the cost of producing or consuming coal, oil, or gas) have, in contrast, increased in most CDI countries. The latest data, from 2022, reflects subsidies as they were in the immediate aftermath of Russia’s invasion of Ukraine; that is, in the context of spiking energy prices and increasing demand after restrictions from COVID eased. Countries that reduced subsidies for fossil fuels in such difficult geopolitical and macroeconomic circumstances—of which there were 10, including Argentina, Australia, and Türkiye—should be commended.
On trade, many of the changes instigated by the second Trump administration are yet to feature in the data, but will have significant impacts on lower-income countries.
In one bright spot, many CDI countries have made progress on reducing harmful subsidies for agriculture—these subsidies create a highly uneven playing field for low-income countries, for which agriculture typically constitutes a large portion of the economy. Agricultural subsidies declined in 28 countries, though they remain high across a number of those despite progress. This is especially the case in EU member states—with agricultural subsidies overseen by the European Commission as part of the Common Agricultural Policy, rather than by individual member states—as well as in Switzerland and Norway (though the value of subsidies in the latter remained very high at more than 56 percent of total farm production).
On security, our analysis reflects the increase in geopolitical tension and conflict in recent years. In our two key indicators, we see over half of countries reducing their peacekeeping contributions and increasing their arms exports, reflecting a longer-term trend of declining finance for peacekeeping. Neither Russia’s invasion of Ukraine nor Israel’s military operations in Gaza and the region following the 7 October 2023 attacks are addressed by active UN peacekeeping missions, and both have shaped the foreign and security priorities of many CDI countries.
At the time of this analysis, Israel and Russia were each engaged in major conflicts. Russia’s invasion of Ukraine has had devastating humanitarian and developmental impacts, causing disruption to food and energy markets with knock-on effects for developing countries worldwide. Israel’s military operations in Gaza and the region, and its restrictions on the entry of food, essential supplies, and aid, have had severe humanitarian consequences. The CDI has limited ability to capture the developmental impacts of such actions and cannot meaningfully quantify or compare the effects of different conflicts. For this reason, Israel and Russia are not included in the 2025 Commitment to Development Index.
Many of the spillover effects of Russia’s invasion however—such as higher fossil fuel subsidies, diverted aid resources, and food price increases—are reflected in other countries’ scores.
More information on this is available in the methodology.
Development trends and insights
This year’s CDI is published against a backdrop of major cuts to the provision of aid. This makes a case for countries to increase the quality of their remaining finance, but also to consider the wider set of policies that can accelerate prosperity and security in partner countries. In this section, we highlight three important areas: subsidies for agriculture and fossil fuels, R&D spend and focus, and the quality of development finance.
1. Subsidies for agriculture and fossil fuels
High-income countries spent billions of taxpayer money subsidising the production and consumption of fossil fuels and, to a lesser extent, agriculture. With ongoing pressure on public budgets and the major threats posed by climate change, these seem important areas on which to focus. However, they also represent unfair competition between countries—these are major industrial distortions.
There has been backsliding on fossil fuel subsidies, which have increased across most countries, largely in response to increased energy demand following COVID and price spikes resulting from Russia’s invasion of Ukraine. Across the 36 countries for which we have data, total fossil fuel subsidies amounted to 0.48 percent of their collective GNI in 2022, twice the 0.23 percent a year prior. But our analysis also shows very wide variations in the level of subsidy provided by governments.
In response to issues with gas supply, we have seen that the average subsidy for gas production across CDI countries more than tripled, even more so across the EU. Subsidies for oil also increased in over half of countries, but to a far smaller degree than for gas: the greatest absolute increases in oil subsidies were in Japan (an almost 14-fold increase) and Mexico. Some small consolation may be taken from the fact that subsidies for coal—the “dirtiest” fossil fuel—fell in 23 countries (and stayed the same in five), and that most subsidy increases for coal were modest. However, there were two notable exceptions: Poland and China, where subsidies increased almost fourfold and almost fivefold, respectively. In aggregate, the overall carbon intensity of CDI countries’ fossil fuel subsidies has dropped: the carbon intensity of all fossil fuel subsidies relative to oil was 95 percent in 2021 and just 85 percent in 2022.
Notably, the US provision of subsidies is relatively low. A focus on these subsidies at the G20 in the coming two years could free up public finance, rebalance trade, and accelerate progress on climate.
There has also been significant progress on reducing harmful subsidies that contribute to overfishing. The landmark WTO Agreement on Fishing Subsidies was adopted in mid-2022 and formally entered into force in September 2025—it has already been signed by all but a handful of CDI countries, such as India and Mexico. But even before this legal instrument took effect, we see that CDI countries had been reducing harmful fishing subsidies: between 2020 and 2022, the average subsidy provided by CDI countries decreased from 7.9 percent of fishing industry output to 5.3 percent.
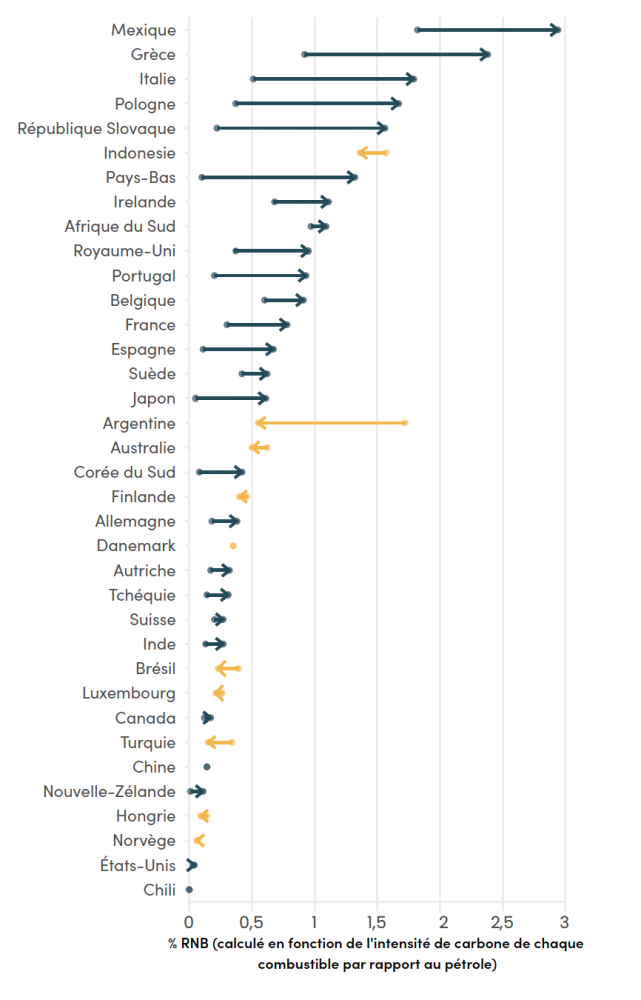
Figure 1. Fossil fuel subsidies increased overall from 2021 to 2022, but some countries reduced them
2. Research and development
The average country in the CDI spends more than twice as much economic effort on research and development (R&D) as it does on development finance. Collectively, it’s almost three times as much, at 0.58 percent compared to 0.2 percent on finance for international development. This figure has also been resilient to the cuts that have befallen development budgets across CDI countries—four years ago, the amount spent on R&D across CDI countries was worth 0.59 percent of their economies.
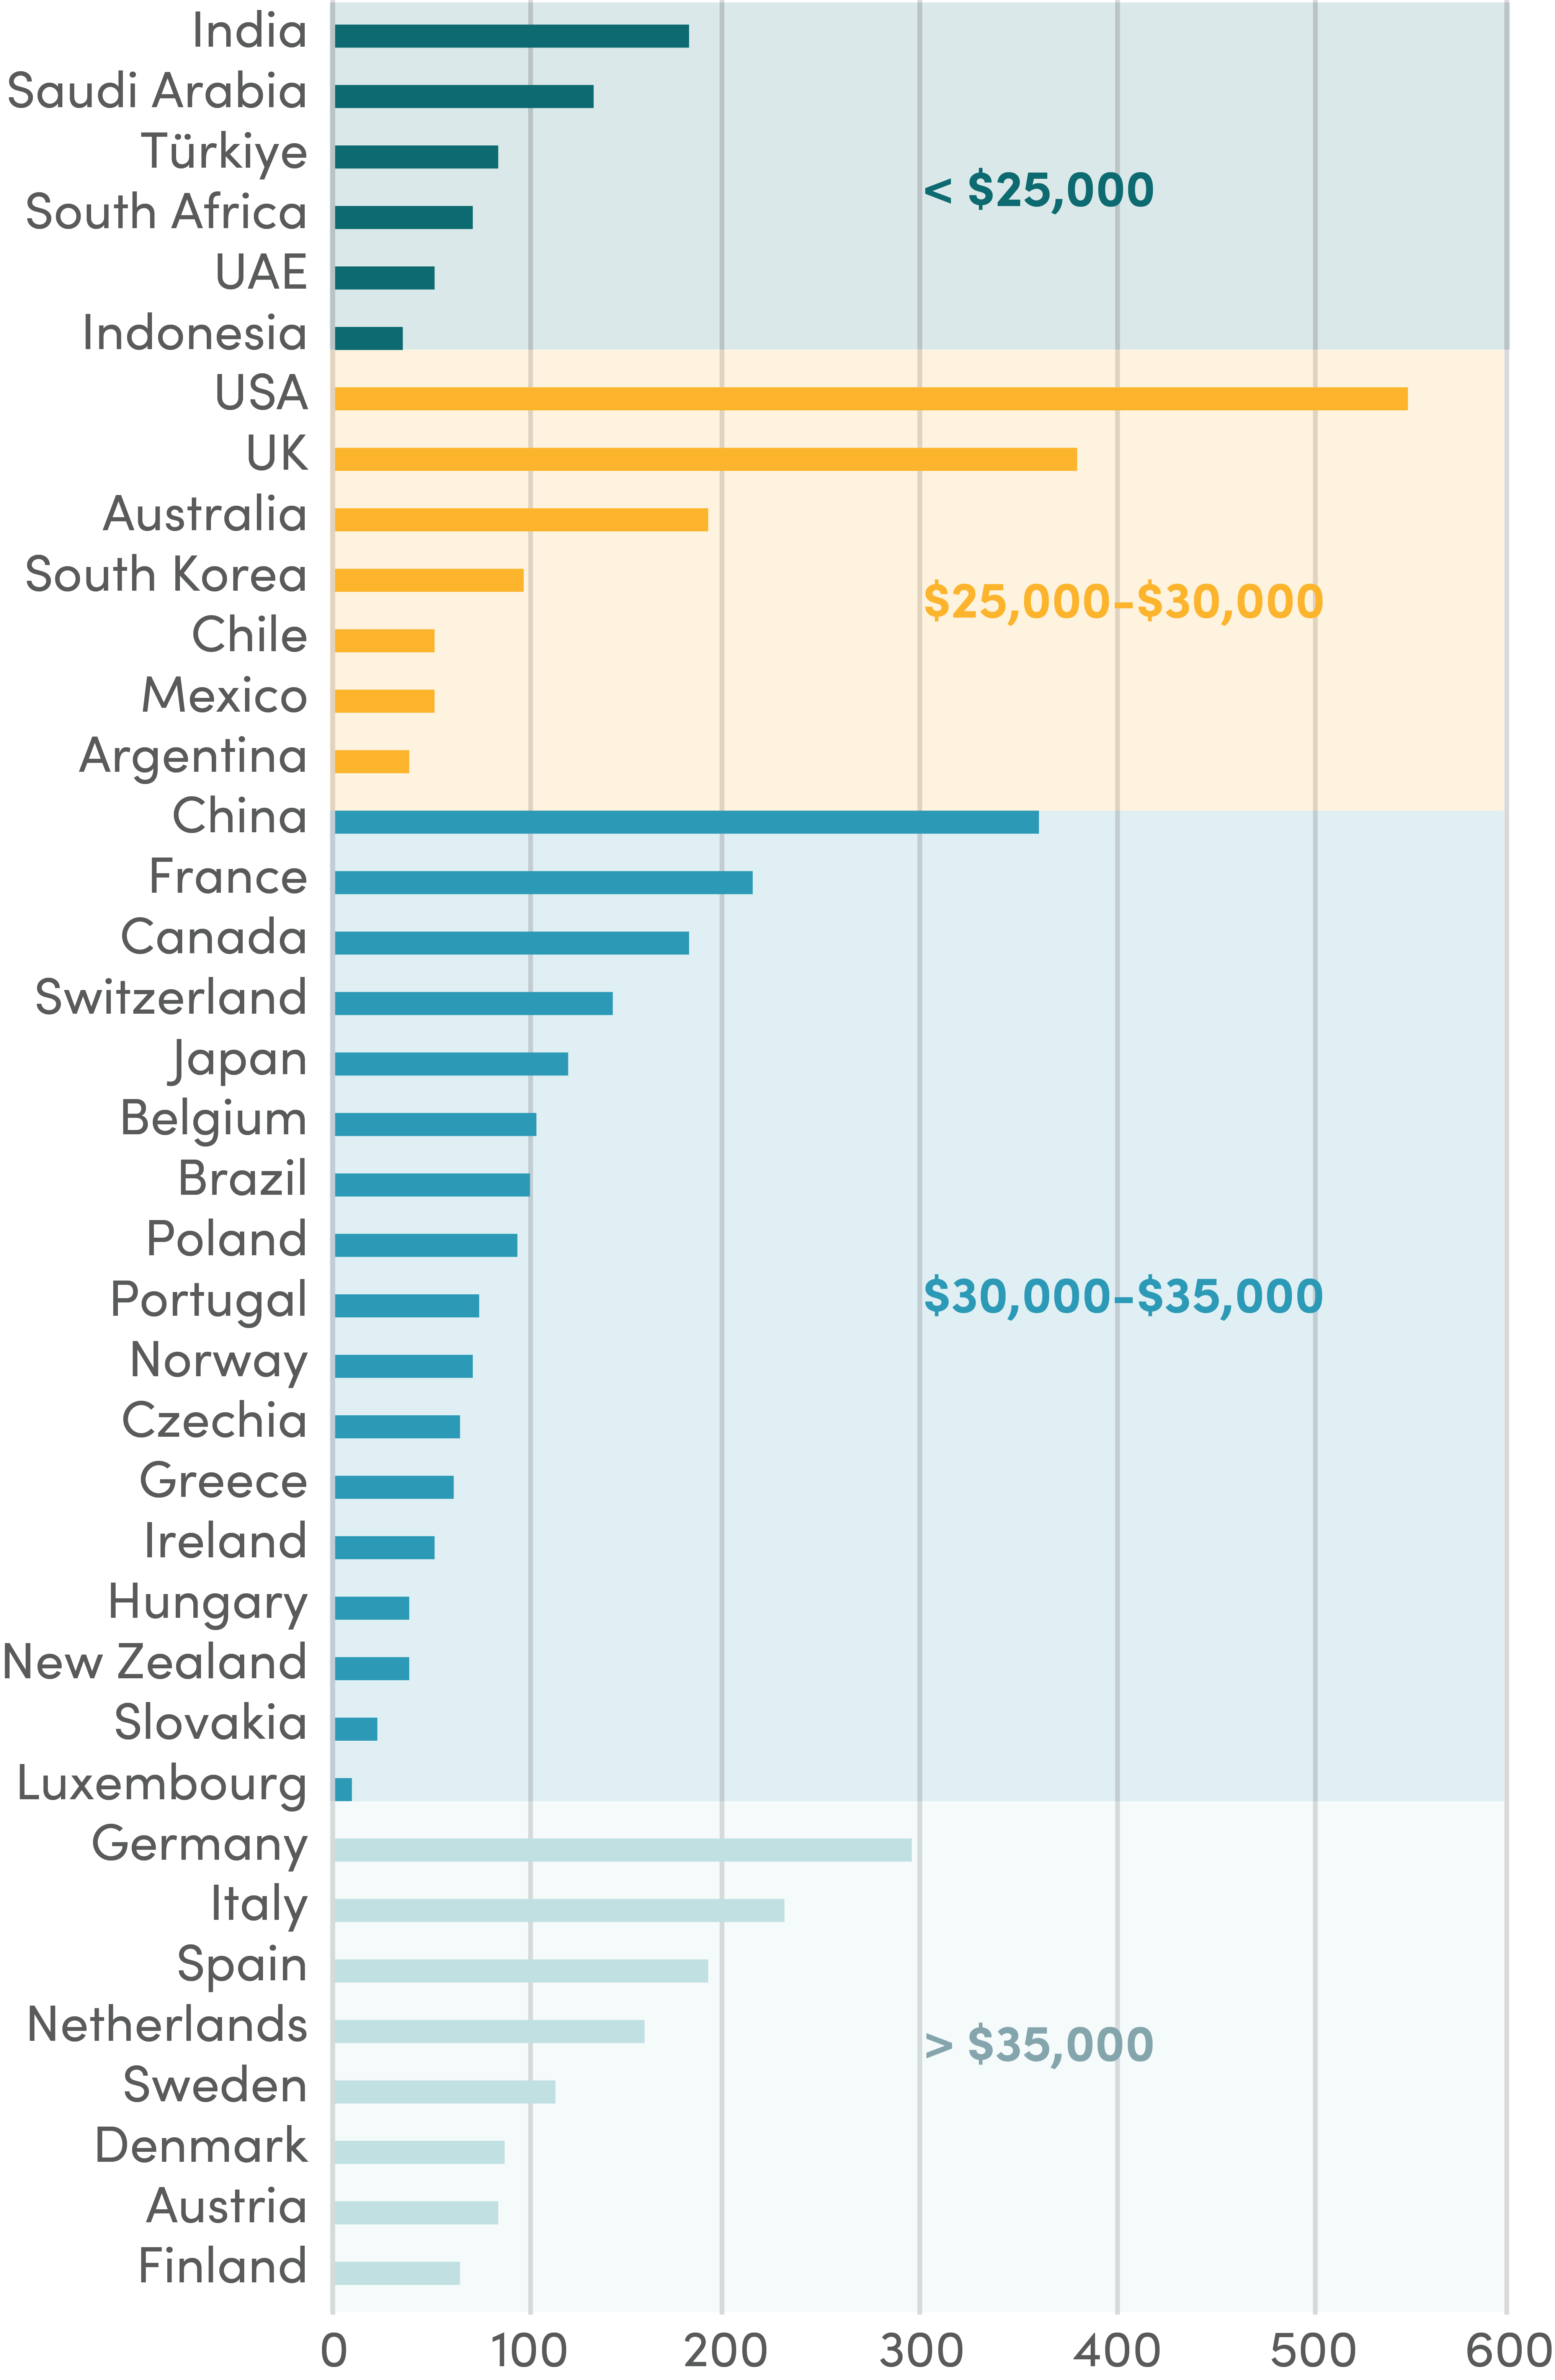
Figure 2. Total co-authored publications in 2024 (thousands), grouped by average income of co-author countries
R&D funding is aimed at improving societies and productivity, and to spur innovation to meet the challenges of the day. So many of the recent economic shocks have been international in nature or in implication: the impact of Russia’s war on inflation; climate change; COVID; and even the effect of US interest rates on global borrowing costs. Given the shared and international dimensions of so many of these (current and projected) challenges, R&D should be focused on them and involve international collaboration. Development officials and advocates should understand and encourage their government’s international focus.
For the six BRICS+ countries we assess, the amount spent by the government on R&D is orders of magnitude larger than that spent on finance for international development. Researchers from these countries are also more likely than those in other CDI countries to publish research papers in collaboration with researchers from lower-income countries (Figure 2). For example, while the average international co-author of research led by Austrian academics comes from a country with an income per head of $38,500, or almost 16 times the low-income country average, academics from South Africa tend to partner with researchers from countries with lower incomes: $16,900, or 7 times the low-income country average. For many countries, collaborating with lower-income countries presents opportunities both to tackle global issues and encourage mutual growth and innovation.
3. Development finance: New providers and focus on quality
We’ve highlighted that cuts to development finance started before the major cuts announced in 2025. But what about providers outside the OECD?
Our analysis shows nontraditional providers cut their aid first: in the 2020 CDI, based on data from roughly 2017, the 12 providers we assess outside the DAC provided 0.1 percent of their collective GNI as finance for international development. By the 2023 CDI, that figure had fallen to 0.075 percent of GNI, and today that figure stands at 0.05 percent. This is not an entirely homogenous decrease—for example, Saudi Arabia provided more in the latest assessment than in 2020—but the trend broadly holds across the group. Since 2023, China has reduced its finance by almost a quarter relative to its GNI, Indonesia by over a half, and South Africa by more than 80 percent.
That drop was also driven by a fall in the share of finance to multilateral institutions: Brazil reduced its proportion from 95 to 58 percent, and others, including India, Mexico, and South Africa, have reduced their proportions by more than 20 percentage points since our last assessment two years ago. In part, this reflected the conclusion of capitalization of the New Development Bank. It remains to be seen whether the newly expanded BRICS+ group leads to that institution receiving new capital.
On finance quality, our assessment is a simplified version of our Quality of ODA index (QuODA) with just a handful of indicators. Still, we see several clear trends.
The poverty focus of bilateral development finance has been steadily falling as finance is directed away from the poorest countries, where it can have the greatest impact. Much of this deterioration occurred in 2022 when substantial volumes of aid were redirected to (relatively higher-income) Ukraine. In 2018, the average income of CDI country finance recipients was 1.8 times the low-income country average, and by this edition of the CDI, that had increased to 2.2 times. Belgium remains the best country at targeting the poorest countries with its bilateral development finance, while the United States and Japan have both targeted their finance to relatively better-off countries.
In one bright spot, with new survey data on recipients’ views of providers, we have seen an uptick in ownership expressed over finance projects in most CDI countries—that is, a greater proportion of development project objectives are being drawn from results frameworks owned by the recipient country. Both the United Kingdom and the United States have made substantial progress, though EU countries including Italy and Germany make up the majority of top-performers on this indicator.
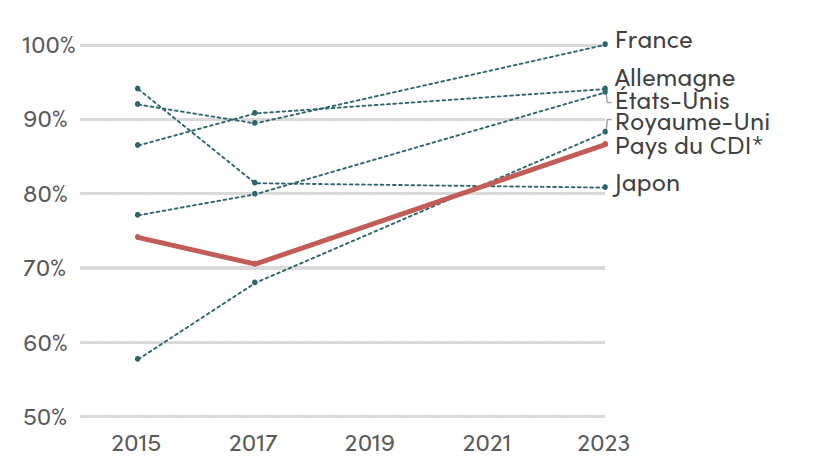
Figure 3. Aid objectives are becoming more aligned with partner countries
Share of projects with country-owned objectives
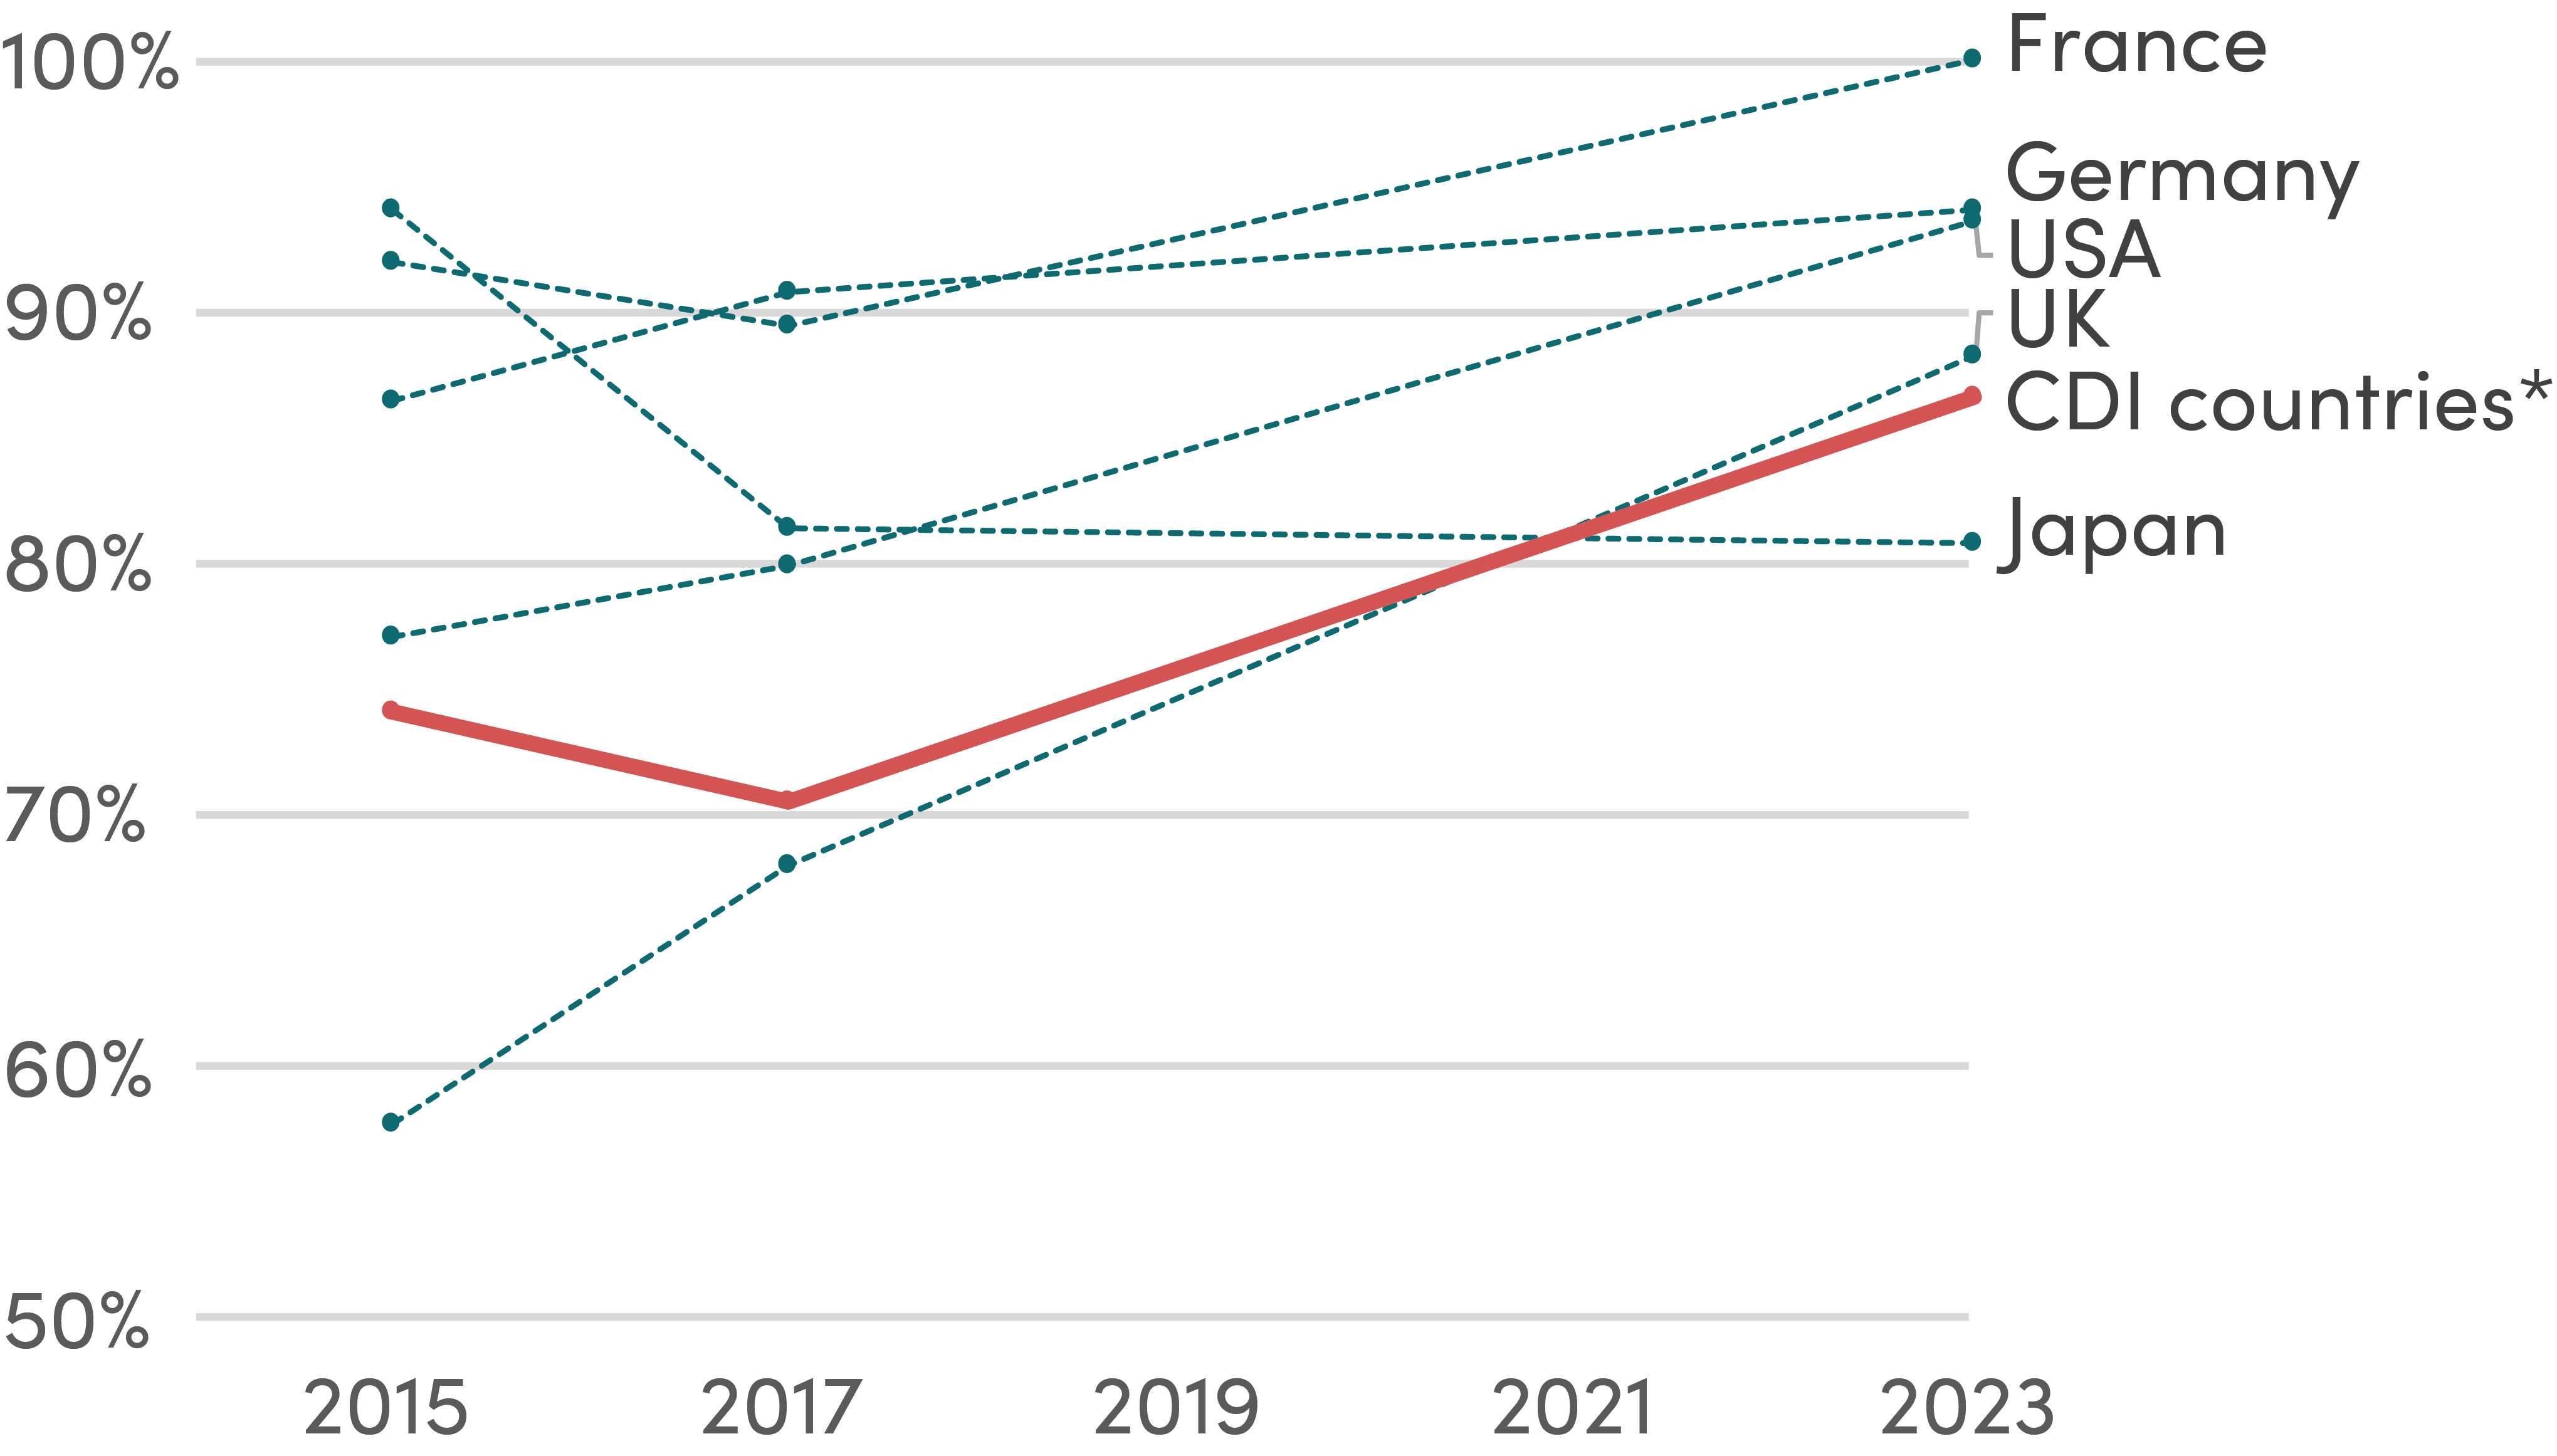
* CDI countries with available GPEDC data
Note: Figures above are not adjusted for missing data
For country reports and full results
Visit cgdev.org/cdi to explore the interactive web portal and see how your country is doing on the Commitment to Development Index. More information on the CDI, including the full data model and method paper are available on our project site at cgdev.org/project/commitment-development-index.

Alors que les niveaux de financement du développement sont en baisse, il est plus important que jamais de regarder au-delà de l'aide. C’est exactement ce que fait l’Indice de l’engagement pour le développement (Commitment to Development Index, CDI) en classant les pays les plus puissants du monde sur la base des politiques ayant une incidence sur le développement mondial.
Dans un monde de plus en plus interconnecté et soumis aux effets de la géopolitique, les décisions prises par les gouvernements des pays les plus riches ont des répercussions qui vont bien au-delà de leurs frontières et qui affectent souvent de manière disproportionnée les populations les plus pauvres et les plus vulnérables du monde. Malgré la montée du nationalisme dans de nombreux pays, une prospérité accrue au niveau mondial profiterait à tous en créant de nouvelles opportunités économiques et commerciales, en stimulant l'innovation et en réduisant les risques liés aux défis mondiaux en matière de santé, de sécurité et de climat.
Le CDI couvre huit domaines politiques distincts qui affectent le développement:
Comment le CDI est-il calculé ?
Nous évaluons les pays en fonction de plus de 40 indicateurs afin d’établir des classements pour chacune des huit composantes politiques, et de mesurer l'engagement global de chaque pays en faveur du développement. Les pays obtiennent de bonnes notes grâce aux pratiques suivantes : financement du développement de bonne qualité, transparence des investissements, faibles barrières commerciales favorisant les échanges avec les pays en développement et politiques migratoires ouvertes et encourageant l’intégration. Les politiques qui améliorent les biens publics mondiaux, telles que la promotion de la santé mondiale par la prévention des maladies, le soutien à la recherche technologique, la protection de la biodiversité et du climat et les contributions à la sécurité mondiale, entraînent également des scores élevés.
Quels sont les résultats des pays évalués ?
La Suède est en tête du CDI cette année, suivie de l’Allemagne en deuxième position, puis de la Norvège, qui occupe la troisième marche du podium. La Suède occupe la première place dans le domaine de l'environnement, la deuxième dans celui du financement du développement, et la quatrième dans celui de la santé. Ses performances en matière de technologie, malgré une augmentation des incitations fiscales en faveur de la R&D privée depuis le dernier CDI, restent relativement faibles, avec des niveaux de collaboration peu élevés en matière de recherche. Bien que la Suède ait également terminé en tête lors des deux éditions précédentes du CDI, son avance sur les autres pays les plus performants s'est réduite à chaque fois.
L'Allemagne arrive en deuxième position du classement général et est le pays du G7 le mieux classé ; lorsque les résultats sont ajustés en fonction des revenus des pays, l'Allemagne dépasse la Suède et se retrouve en tête de l'indice. Elle se classe au premier rang en matière de migration à la suite d'une forte augmentation du nombre de migrants et de réfugiés qu'elle accepte par habitant. La Norvège occupe quant à elle la troisième place du podium avec de bons résultats en matière de financement du développement et de santé - et elle se classe première en matière d’investissement - mais ses performances en matière de commerce et d’environnement sont faibles en raison de ses fortes subventions agricoles et d’une production élevée de combustibles fossiles.
La Finlande et le Royaume-Uni arrivent respectivement en 4e et 5e position : La Finlande arrive en tête en matière de santé et de sécurité, tandis que le Royaume-Uni obtient de bons résultats grâce à ses politiques de soutien à l'investissement dans les pays en développement et au commerce avec ceux-ci.
La France est sortie du top cinq pour se retrouver au septième rang au classement général, en partie à cause d'une série de réductions dans son budget d'aide (les réductions plus récentes effectuées dans le budget de développement du Royaume-Uni ne sont pas encore prises en compte dans les données), bien qu'elle se classe toujours dans les dix premières places pour l'investissement, l'environnement, la santé et la technologie.
Ces résultats sont antérieurs à la plupart des réductions importantes annoncées par quatre des plus grands pourvoyeurs d'aide au développement, à savoir les États-Unis, le Royaume-Uni, la France et l'Allemagne. D'autres pourvoyeurs ont également annoncé des réductions et, bien que les réductions les plus récentes et planifiées n'apparaissent pas encore dans les données officielles, les réductions antérieures de l'offre de financement du développement sont déjà évidentes dans notre évaluation. Cependant, la finance n'est que l'une des huit composantes du CDI.
Compte tenu de l'importance économique des pays du G20, nous incluons dans le classement huit pays à revenu intermédiaire. Malgré une chute de quatre places depuis l'édition précédente, l'Afrique du Sud se classe toujours en tête de ce groupe, à la 29e place, avec des contributions supérieures à la moyenne dans les domaines de la technologie et de la sécurité. La Turquie et le Brésil viennent ensuite, avec des atouts relatifs en matière de migration et d'investissement, respectivement.
Le Luxembourg et l'Irlande ont réalisé la meilleure progression depuis la dernière édition du CDI, chacun gagnant quatre places. Le Luxembourg, désormais classé au 10e rang du classement général, est l'un des rares pays à avoir augmenté, selon nos évaluations, son offre (déjà généreuse) de financement du développement, et il est aujourd'hui en tête de cette composante. L'Autriche et le Chili ont chacun progressé de trois places, tandis que les Pays-Bas sont sortis du top 10, perdant ainsi cinq places pour se retrouver à la 11e place.
Progrès ou déclin collectif?
Bien que ces classements mettent en évidence les performances de chaque pays par rapport aux autres puissances économiques et montrent comment ils pourraient faire davantage pour le développement, l'analyse des indicateurs met en lumière les domaines de progrès ou de déclin collectifs.
Une majorité de pays accordent moins de financements au développement international que dans le CDI 2023 (en tenant compte de la taille de leur économie). Et ce, avant même de prendre en compte les réductions récemment annoncées dans les budgets d'aide. En outre, nous constatons que les pays réduisent généralement la part de leur financement du développement acheminée par l'intermédiaire d'institutions multilatérales, cette tendance étant plus prononcée parmi les pourvoyeurs non membres de l'OCDE (voir la section ci-dessous sur la qualité du financement du développement).
Malgré ce net recul en matière de financement du développement, nous constatons une certaine amélioration collective dans un certain nombre de domaines politiques non liés à l'aide. Entre 2020 et 2022, le pays moyen du CDI a accepté 70 % de migrants en plus par habitant - de 66 pour 10.000 habitants à 112 pour 10.000 habitants - les migrations en provenance de l'Ukraine, de la Russie et du Maroc, entre autres, étant à l'origine de cette augmentation. La migration en provenance de ces pays relativement plus riches signifie toutefois que le revenu moyen des pays d'origine des migrants a augmenté, ce qui est moins favorable au développement : un migrant arrivant dans un pays riche en provenance d'un pays pauvre bénéficie d'une augmentation relative plus importante de richesse et d’opportunités qu'un travailleur migrant en provenance d'un pays plus riche, et les transferts de fonds qu'il envoie dans son pays d'origine sont également susceptibles de constituer une composante plus importante de son revenu. Le nombre de réfugiés accueillis par chaque pays du CDI a connu un pic en 2022 avec des afflux importants de réfugiés ukrainiens, en particulier dans les pays voisins tels que la Tchéquie et la Pologne, et ces chiffres sont restés élevés.
En ce qui concerne l'environnement, nous constatons qu’une majorité des pays du CDI ont réduit leurs émissions par habitant, et que près des trois quarts des pays ont amélioré leur situation entre 2019 et 2023. Cela est particulièrement important pour le développement, car les pays à faible revenu sont généralement ceux qui sont les plus touchés par les effets néfastes du changement climatique. Cependant, bien que le pays moyen se soit amélioré, en tant que groupe collectif, les pays du CDI ont été responsables d'une augmentation de 3 % des émissions au cours de la même période : à elle seule, l'augmentation significative des émissions en Chine fait plus qu'annuler les réductions d'émissions combinées dans les 30 pays qui ont connu des diminutions.
Les subventions aux combustibles fossiles (aides publiques qui réduisent le coût de production ou de consommation du charbon, du pétrole ou du gaz naturel) ont, en revanche, augmenté dans la plupart des pays du CDI. Les dernières données, qui datent de 2022, reflètent les subventions telles qu'elles étaient au lendemain de l'invasion de l'Ukraine par la Russie, c'est-à-dire dans un contexte de flambée des prix de l'énergie et d'augmentation de la demande après l'assouplissement des restrictions imposées par la COVID-19. Les pays qui ont réduit les subventions aux combustibles fossiles dans des circonstances géopolitiques et macroéconomiques aussi difficiles - au nombre de dix, dont l'Argentine, l'Australie et la Turquie - méritent d'être félicités.
En ce qui concerne le commerce, de nombreux changements initiés par la deuxième administration Trump ne figurent pas encore dans les données, mais ils auront des répercussions importantes sur les pays à faible revenu.
Un point positif tient au fait que de nombreux pays du CDI ont fait des progrès dans la réduction des subventions néfastes accordées à l'agriculture ; ces subventions créent des conditions de concurrence très inégales pour les pays à faible revenu, pour lesquels l'agriculture constitue généralement une grande partie de leur économie. Les subventions agricoles ont diminué dans 28 pays, mais restent élevées dans un certain nombre d'entre eux malgré les progrès réalisés. C'est particulièrement le cas dans les États membres de l'UE, où les subventions agricoles sont supervisées par la Commission européenne dans le cadre de la Politique agricole commune, plutôt que par les États membres individuels, ainsi qu'en Suisse et en Norvège (bien que la valeur des subventions dans ce dernier pays soit restée très élevée, à plus de 56 % de la production agricole totale).
En ce qui concerne la sécurité, notre analyse reflète l'augmentation des tensions et des conflits géopolitiques au cours de ces dernières années. Nos deux indicateurs clés font apparaître que plus de la moitié des pays réduisent leurs contributions au maintien de la paix et augmentent leurs exportations d'armes, ce qui reflète une tendance à long terme de baisse du financement du maintien de la paix. Ni l'invasion de l'Ukraine par la Russie, ni les opérations militaires menées par Israël à Gaza et dans la région à la suite des attentats du 7 octobre 2023 ne font l'objet de missions de maintien de la paix actives de l'ONU, et ces deux événements ont façonné les priorités de nombreux pays du CDI en matière de politique étrangère et de sécurité.
Au moment de la réalisation de cette analyse, Israël et la Russie étaient tous deux engagés dans des conflits majeurs. L'invasion de l'Ukraine par la Russie a eu des effets dévastateurs sur le plan humanitaire et sur celui du développement, avec une perturbation des marchés alimentaires et énergétiques et des répercussions sur les pays en développement du monde entier. Les opérations militaires menées par Israël à Gaza et dans la région, ainsi que les restrictions imposées à l'entrée des denrées alimentaires, des fournitures essentielles et de l'aide, ont eu de graves conséquences humanitaires. Le CDI n'a qu'une capacité limitée à saisir les effets de ces actions sur le développement et ne peut quantifier ou comparer de manière significative les effets des différents conflits. C'est la raison pour laquelle Israël et la Russie ne figurent pas dans l'indice 2025 de l'engagement pour le développement.
Cependant, de nombreuses retombées de l'invasion russe, telles que l'augmentation des subventions aux combustibles fossiles, le détournement des ressources d'aide et la hausse des prix des denrées alimentaires, se reflètent dans les résultats des autres pays.
Vous trouverez de plus amples informations sur ces ajustements dans la section méthodologie.
Tendances et perspectives de développement
Le CDI de cette année est publié dans un contexte de réductions importantes de l'aide. Cela plaide en faveur d'une amélioration de la qualité de leurs financements restants, mais aussi de la prise en compte d’un ensemble plus large de politiques susceptibles d'accélérer la prospérité et la sécurité dans les pays partenaires. Dans cette section, nous mettons en évidence trois domaines importants : les subventions à l'agriculture et aux combustibles fossiles, les dépenses et l'orientation de la R&D, et la qualité du financement du développement.
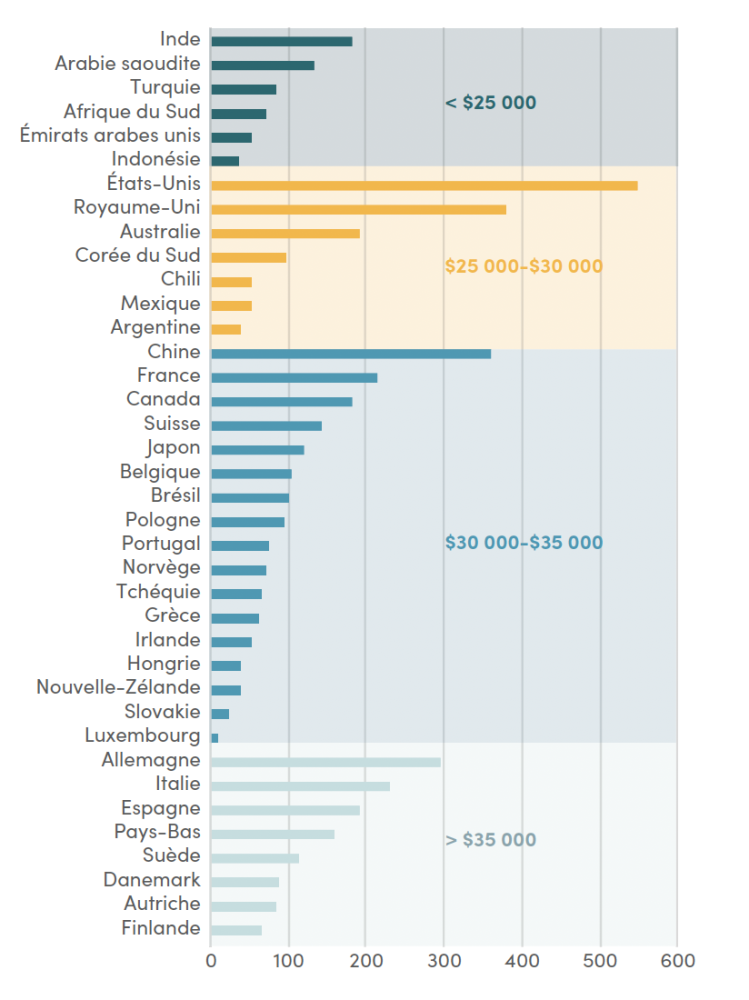
1. Subventions pour l'agriculture et les combustibles fossiles
Les pays à revenu élevé ont dépensé des milliards provenant de l'argent du contribuable afin de subventionner la production et la consommation de combustibles fossiles et, dans une moindre mesure, l'agriculture. Au vu de la pression constante exercée sur les budgets publics et des menaces majeures que fait peser le changement climatique, il semble important de se concentrer sur ces domaines. Cependant, ces subventions représentent également une concurrence déloyale entre les pays, en ce sens qu’elles induisent des distorsions industrielles majeures.
On observe un retour en arrière en matière de subventions aux combustibles fossiles, qui ont augmenté dans la plupart des pays, en grande partie en réponse à l'augmentation de la demande d'énergie suite à la COVID-19 et aux flambées des prix résultant de l'invasion de l'Ukraine par la Russie. Dans les 36 pays pour lesquels nous disposons de données, le total des subventions aux combustibles fossiles s'élevait à 0,48 % du RNB collectif en 2022, soit le double des 0,23 % de l'année précédente. Mais notre analyse montre également de très importantes variations dans le niveau des subventions accordées par les gouvernements.
En réponse aux problèmes d'approvisionnement en gaz naturel, nous avons constaté que la subvention moyenne pour la production de gaz dans les pays du CDI a plus que triplé, et plus encore dans l'UE. Les subventions au pétrole ont également augmenté dans plus de la moitié des pays, mais dans une mesure bien moindre que pour le gaz : les plus fortes augmentations absolues des subventions au pétrole ont été enregistrées au Japon (multiplication par près de 14) et au Mexique. Une petite source de réconfort provient du fait que les subventions au charbon - le combustible fossile le plus « sale » - ont diminué dans 23 pays (et sont restées inchangées dans cinq), et que la plupart des augmentations de subventions au charbon ont été modestes. Il y a eu cependant deux exceptions notables : la Pologne et la Chine, où les subventions ont été multipliées respectivement par près de quatre et par près de cinq. Dans l'ensemble, l'intensité de carbone globale des subventions aux combustibles fossiles des pays du CDI a diminué : l'intensité de carbone de toutes les subventions aux combustibles fossiles par rapport au pétrole était de 95 % en 2021 et de 85 % seulement en 2022.
Notamment, les subventions accordées par les États-Unis sont relativement faibles. En mettant l'accent, lors du G20, sur ces subventions au cours des deux prochaines années, on pourrait libérer des fonds publics, rééquilibrer les échanges commerciaux et accélérer les progrès en matière de climat.
Des progrès significatifs ont également été enregistrés en matière de réduction des subventions néfastes qui contribuent à la surpêche. L'accord historique de l'OMC sur les subventions à la pêche a été adopté à la mi-2022 et est entré officiellement en vigueur en septembre 2025 ; il a déjà été signé par tous les pays du CDI, à l'exception d'une poignée d'entre eux, comme l’Inde et le Mexique. Mais avant même l’entrée en vigueur de cet instrument juridique, nous constations que les pays du CDI avaient réduit les subventions néfastes à la pêche : entre 2020 et 2022, la subvention moyenne accordée par les pays du CDI est ainsi passée de 7,9 % de la production du secteur de la pêche à 5,3 %.
Figure 1. Les subventions aux combustibles fossiles ont globalement augmenté de 2021 à 2022, mais certains pays les ont réduites
2. Recherche et développement
Le pays moyen du CDI consacre plus de deux fois plus d'efforts économiques à la recherche et au développement (R&D) qu'au financement du développement. Collectivement, le financement de la R&D est trois fois plus élevé, soit 0,58 %, contre 0,2 % pour le financement du développement international. Ce chiffre a également résisté aux réductions qui ont frappé les budgets de développement des pays du CDI : il y a quatre ans, le montant consacré à la R&D dans les pays du CDI représentait 0,59 % de leur économie.
Figure 2. Total des publications co-écrites en 2024 (en milliers), regroupées selon le revenu moyen des pays des co-auteurs
Le financement de la R&D vise à améliorer les sociétés et la productivité, et à stimuler l'innovation en vue de relever les défis actuels. De nombreux chocs économiques récents ont été internationaux par nature ou par implication : l'impact de la guerre de la Russie sur l'inflation, le changement climatique, la COVID-19, et même l'effet des taux d'intérêt étasuniens sur les coûts d'emprunt mondiaux. Compte tenu des dimensions communes et internationales d'un grand nombre de ces défis (actuels et prévus), la R&D devrait être axée sur ces derniers et impliquer une collaboration internationale. Les responsables et les défenseurs du développement doivent comprendre et encourager l'orientation internationale de leur gouvernement.
Pour les six pays BRICS+ que nous évaluons, le montant dépensé par chaque gouvernement pour la R&D est de plusieurs ordres de grandeur supérieur à celui qui est dépensé pour le financement du développement international. Les chercheurs de ces pays sont également plus susceptibles que ceux des autres pays du CDI de publier des articles de recherche en collaboration avec des chercheurs de pays à faible revenu (Figure 2). Par exemple, alors que le coauteur international moyen d'une recherche menée par des universitaires autrichiens vient d'un pays dont le revenu par habitant est de 38 500 dollars, soit près de 16 fois le revenu moyen des pays à faible revenu, les universitaires d'Afrique du Sud ont tendance à s'associer à des chercheurs provenant de pays à revenu plus faible : 16 900 dollars, soit 7 fois le revenu moyen des pays à faible revenu. Pour de nombreux pays, la collaboration avec les pays à faible revenu offre des possibilités de s'attaquer à des problèmes mondiaux et d'encourager la croissance et l'innovation mutuelles
3. Financement du développement : nouveaux pourvoyeurs et priorité accordée à la qualité
Nous avons souligné que les coupes dans le financement du développement ont commencé avant les coupes majeures annoncées en 2025. Mais qu'en est-il des pourvoyeurs hors OCDE ?
Notre analyse montre que les pourvoyeurs non traditionnels sont les premiers à réduire leur aide : dans le CDI 2020, utilisant des données datant d'environ 2017, les 12 pourvoyeurs que nous avons évalué et qui sont en dehors du Comité d'aide au développement (CAD) de l’OCDE ont fourni 0,1 % de leur RNB collectif pour financer le développement international. Dans le CDI 2023, ce chiffre était tombé à 0,075 % du RNB, et aujourd'hui il est de 0,05 %. Il ne s’agit pas d’une baisse totalement homogène - par exemple, l'Arabie saoudite a fourni davantage dans la dernière évaluation qu'en 2020 - mais la tendance se maintient globalement dans l'ensemble du groupe. Depuis 2023, la Chine a réduit ses financements de près d'un quart par rapport à son RNB, l'Indonésie de plus de la moitié, et l'Afrique du Sud de plus de 80 %.
Cette baisse est également due à une diminution de la part des financements accordés aux institutions multilatérales : le Brésil a réduit sa part de 95 à 58 %, et d'autres pays, dont l'Inde, le Mexique et l'Afrique du Sud, ont réduit leur part de plus de 20 points de pourcentage depuis notre dernière évaluation réalisée il y a deux ans. Cette évolution reflète en partie la fin de la capitalisation de la Nouvelle Banque de développement du groupe BRICS+. Il reste à voir si le groupe des BRICS+ nouvellement élargi permettra à cette institution de recevoir de nouveaux capitaux.
En ce qui concerne la qualité du financement, notre évaluation est une version simplifiée de notre Indice de qualité de l'APD (Aide publique au développement) (QuODA) utilisant seulement quelques indicateurs. Néanmoins, plusieurs tendances se dégagent clairement.
L'importance accordée à la pauvreté dans le financement bilatéral du développement est en baisse constante, les fonds étant détournés des pays les plus pauvres où ils pourraient avoir le plus d'impact. Une grande partie de cette détérioration s'est produite en 2022 lorsque d'importants volumes d'aide ont été réorientés vers l'Ukraine (dont les revenus sont relativement plus élevés). En 2018, le revenu moyen des pays bénéficiaires des financements des pays du CDI était 1,8 fois supérieur au revenu moyen des pays à faible revenu, et dans cette édition du CDI, ce chiffre est devenu 2,2 fois supérieur. La Belgique reste le meilleur pays pour ce qui est de cibler les pays les plus pauvres avec son financement bilatéral du développement, tandis que les États-Unis et le Japon ont tous deux ciblé leurs financements sur des pays relativement plus aisés.
De nouvelles données d'enquête concernant l'opinion des bénéficiaires sur les pourvoyeurs apporte cependant un point de satisfaction : les bénéficiaires ont exprimé qu’il y avait une augmentation de l'appropriation des projets de financement en provenance de la plupart des pays du CDI, en ce sens qu'une plus grande proportion des objectifs des projets de développement est tirée des cadres de résultats appartenant aux pays bénéficiaires. Le Royaume-Uni et les États-Unis ont tous deux réalisé des progrès substantiels, même si les pays de l'UE, dont l'Italie et l'Allemagne, constituent la majorité des pays les plus performants pour cet indicateur.
Figure 3. Les objectifs de l'aide sont de plus en plus alignés sur ceux des pays partenaires
Part des projets dont les objectifs ont été appropriés par les pays
* Pays du CDI avec données disponibles du GPEDC
Note : Les chiffres ci-dessus ne sont pas ajustés de manière à tenir compte des données manquantes
Concernant les rapports des pays et les résultats complets
Rendez-vous sur le site cgdev.org/cdi pour explorer le portail web interactif et découvrir l'indice de l'engagement pour le développement de votre pays. Vous trouverez plus d'informations sur le CDI, y compris le modèle de données complet et la méthodologie sur le site du projet à l'adresse cgdev.org/project/commitment-development-index.
À propos du CDI
L’Indice de l’engagement pour le développement est établi chaque année depuis 2003 par le Center for Global Development (CGD). Le CGD œuvre à réduire la pauvreté mondiale et à améliorer les conditions de vie par le biais de recherches économiques novatrices qui promeuvent de meilleures politiques et pratiques de la part des décideurs mondiaux de premier plan. Ian Mitchell dirige le CDI et Edward Wickstead est le chercheur principal. Le CDI 2025 s’appuie sur les travaux des éditions précédentes de Beata Cichocka, Lee Robinson, Anita Käppeli, Owen Barder, David Roodman et Nancy Birdsall. Le CDI a bénéficié de financements pour les travaux du CGD Europe portant sur l'efficacité du développement, qui comprenaient des contributions de plusieurs gouvernements, dont l'Australie, le Canada, l'Allemagne, le Luxembourg et la Suède. Le CDI ne reflète pas la position officielle des bailleurs de fonds. Les auteurs sont responsables de toutes les décisions méthodologiques et des informations et opinions exprimées dans le présent document.
Con la caída de los niveles de financiamiento del desarrollo, es más importante que nunca mirar más allá de las ayudas. Eso es lo que hace precisamente el Índice de Compromiso con el Desarrollo (CDI, por sus siglas en inglés): clasifica a los países más poderosos del mundo en función de las políticas que afectan al desarrollo global.
En un mundo cada vez más interconectado y geopolítico, las decisiones que toman los gobiernos de las principales economías tienen repercusiones mucho más allá de sus fronteras, y, a menudo, afectan de manera desproporcionada a las personas más pobres y vulnerables del mundo. A pesar del crecimiento del nacionalismo en muchos países, una mayor prosperidad a nivel mundial continúa siendo un interés común que crea nuevas oportunidades económicas y comerciales, aumenta la innovación y reduce los riesgos que plantean los retos mundiales en materia de salud, seguridad y clima.
El CDI abarca ocho ámbitos de políticas distintos que afectan al desarrollo:
¿Qué mide el CDI?
Evaluamos a los países a través de más de 40 indicadores y los ordenamos en función de cada uno de los ocho componentes de las políticas, así como del compromiso general de cada país con el desarrollo. Los países obtienen buenas puntuaciones si ofrecen un financiamiento generoso y de alta calidad para el desarrollo, inversiones transparentes, escasos obstáculos al comercio para los países en desarrollo, y políticas migratorias abiertas y que fomentan la integración. Las políticas que mejoran los bienes públicos mundiales, como el fomento de la salud global mediante la prevención de enfermedades, el apoyo a la investigación tecnológica, la protección de la biodiversidad y el clima, y la contribución a la seguridad mundial, también contribuyen a obtener puntuaciones altas.
¿Cómo les está yendo a los países?
Suecia encabeza el CDI de este año, seguida de Alemania en segundo lugar y Noruega en tercero. Suecia ocupa el primer puesto en medio ambiente, el segundo en financiamiento del desarrollo y el cuarto en salud. A pesar del aumento de los incentivos fiscales a la I+D privada desde el último CDI, sus resultados en tecnología siguen siendo relativamente magros, con bajos niveles de colaboración en investigación. Aunque Suecia también ocupó el primer puesto en las dos ediciones anteriores del CDI, la distancia con los siguientes países con mejores resultados es cada vez menor.
Alemania ocupa el segundo lugar en la clasificación general y es el país del G7 con mejores resultados. Asimismo, si las puntuaciones se ajustan en función de los ingresos de los países, Alemania supera a Suecia y encabeza el índice. Ocupa el primer lugar en el componente de migración tras el gran aumento del número de inmigrantes y refugiados que acepta per cápita. Noruega ocupa el tercer lugar, con buenos resultados en financiamiento del desarrollo y salud y siendo el primero en inversión, pero con peores resultados en comercio y medio ambiente debido al elevado nivel de subvenciones agrícolas y a la producción de combustibles fósiles.
Finlandia y el Reino Unido completan los cinco primeros puestos: Finlandia ocupa el primer puesto en salud y seguridad, mientras que el Reino Unido destaca por sus políticas de apoyo a la inversión y al comercio con países en desarrollo.
Francia bajó de los cinco primeros puestos al séptimo, en parte, debido a una serie de recortes en su presupuesto de ayuda (los últimos recortes en el presupuesto de desarrollo del Reino Unido aún no se reflejan en los datos), aunque sigue estando entre los diez primeros países en inversión, medio ambiente, salud y tecnología.
Estos resultados son anteriores a la mayoría de los drásticos recortes anunciados en cuatro de los mayores proveedores de ayuda para el desarrollo: Estados Unidos, Reino Unido, Francia y Alemania. En otros países proveedores de ayuda también se anunciaron recortes, y, aunque los recortes más recientes y previstos aún no aparecen en los datos oficiales, las reducciones anteriores en la provisión de financiamiento para el desarrollo ya son evidentes en nuestro análisis. Sin embargo, el financiamiento es solo uno de los ocho componentes del CDI.
Dada la importancia económica de los países del G20, incluimos ocho países con un nivel de ingresos medio en el análisis. A pesar de haber descendido cuatro puestos desde la edición anterior, Sudáfrica sigue siendo el mejor ubicado de este grupo y ocupa el 29.º lugar, con contribuciones superiores a la media en tecnología y seguridad. Turquía y Brasil ocupan los siguientes puestos de este grupo de países, con puntos fuertes relativos en migración e inversión, respectivamente.
Luxemburgo e Irlanda son los países que más mejoraron desde la última edición del CDI, con un salto de cuatro puestos cada uno. Luxemburgo, ahora en el puesto 10, es uno de los pocos países que analizamos que aumentó su (ya generoso) aporte de financiamiento para el desarrollo, y ahora encabeza ese componente. Austria y Chile subieron tres puestos cada uno, mientras que los Países Bajos cayeron de los primeros 10 lugares hasta el 11.º puesto.
¿Progreso o declive colectivo?
Si bien las puntuaciones hacen referencia a la situación de cada país en relación con otras economías poderosas y exponen maneras en que podrían contribuir más al desarrollo, la observación general de los indicadores puede permitir visualizar áreas de progreso o declive colectivo.
La mayoría de los países están destinando menos fondos al desarrollo internacional que en el CDI 2023 (en relación con el tamaño de sus economías). Todo ello sin tener en cuenta los recortes anunciados recientemente en los presupuestos de ayuda. Además, vemos que los países también están reduciendo en general la parte de su financiamiento del desarrollo canalizada a través de instituciones multilaterales, una tendencia aún más pronunciada entre los proveedores no pertenecientes a la OCDE (véase la sección siguiente sobre la calidad del financiamiento del desarrollo).
A pesar de este claro retroceso en el financiamiento del desarrollo, observamos algunas mejoras colectivas en una serie de ámbitos políticos distintos al de las ayudas. Entre 2020 y 2022, el país promedio del CDI aceptó un 70 % más de migrantes por habitante (de 66 a 112 por cada 10.000 personas), con la migración procedente de Ucrania, Rusia y Marruecos, entre otros, impulsando el aumento. La migración desde estos países relativamente más ricos, sin embargo, implica que aumentó el nivel medio de ingresos de los países de origen de los migrantes y esto no es tan bueno para el desarrollo: un migrante que llega a un país rico desde uno pobre accede a un mayor aumento relativo de riqueza y oportunidades que un trabajador migrante de un país más rico, y las remesas que envían a sus países de origen también es probable que representen un porcentaje mayor de sus ingresos. El número de refugiados acogidos por cada país del CDI se disparó en 2022 con la gran afluencia de refugiados ucranianos, especialmente en países vecinos, como Chequia y Polonia, y esas cifras se mantuvieron en niveles elevados.
En cuanto al medio ambiente, vemos que la mayoría de los países del CDI está reduciendo sus emisiones per cápita, con mejoras en casi tres cuartas partes de los países entre 2019 y 2023. Esto es especialmente importante para el desarrollo, ya que los países de bajos ingresos suelen ser los más afectados por los efectos adversos del cambio climático. Sin embargo, aunque la media de los países mejoró, como grupo colectivo, los países del CDI fueron responsables de un 3 % más de emisiones en ese mismo periodo: el significativo aumento de las emisiones en China dejó ampliamente sin efecto las reducciones combinadas de las emisiones en los 30 países que experimentaron descensos.
No obstante, las subvenciones a los combustibles fósiles (ayudas públicas que reducen los costos de producir o consumir carbón, petróleo o gas) aumentaron en la mayoría de los países del CDI. Los últimos datos, de 2022, reflejan las subvenciones tal y como eran inmediatamente después de la invasión rusa de Ucrania; es decir, en un contexto de aumento de los precios de la energía y la demanda tras la relajación de las restricciones impuestas durante la pandemia de COVID. Los países que redujeron las subvenciones a los combustibles fósiles en circunstancias geopolíticas y macroeconómicas tan complejas (10 en total, incluidos Argentina, Australia y Turquía) merecen ser reconocidos.
En cuanto al comercio, muchos de los cambios impuestos por la segunda administración de Trump aún no se reflejan en los datos, pero tendrán repercusiones significativas en los países de bajos ingresos.
Un aspecto positivo es que muchos países del CDI redujeron las subvenciones para la agricultura que crean condiciones muy desiguales para los países de bajos ingresos, donde la agricultura suele constituir una gran parte de la economía. Las subvenciones agrícolas disminuyeron en 28 países, aunque siguen siendo elevadas en varios de ellos a pesar de los avances. Este es especialmente el caso de los Estados miembros de la UE, cuyas subvenciones agrícolas son supervisadas por la Comisión Europea en el marco de la Política Agrícola Común, y no por los Estados miembros individualmente, así como de Suiza y Noruega (aunque el valor de las subvenciones en este último país siguió siendo muy elevado, con un nivel superior al 56 % de la producción agrícola total).
En materia de seguridad, nuestro análisis refleja el aumento de las tensiones y conflictos geopolíticos en los últimos años. En nuestros dos indicadores clave, vemos que más de la mitad de los países están reduciendo sus contribuciones al mantenimiento de la paz y aumentando sus exportaciones de armas, lo que refleja una tendencia a largo plazo de reducción de los fondos aportados para el mantenimiento de la paz. Ni la invasión rusa de Ucrania ni las operaciones militares de Israel en Gaza y la región tras los atentados del 7 de octubre de 2023 son abordadas por misiones activas de mantenimiento de la paz de la ONU, y ambas definieron las prioridades exteriores y de seguridad de muchos países del CDI.
En el momento de este análisis, Israel y Rusia estaban inmersos en sendos conflictos de gran envergadura. La invasión rusa de Ucrania tuvo devastadoras repercusiones humanitarias y de desarrollo, causando perturbaciones en los mercados alimentarios y energéticos con efectos en cadena para los países en desarrollo de todo el mundo. Las operaciones militares de Israel en Gaza y la región, y sus restricciones a la entrada de alimentos, suministros esenciales y ayuda, tuvieron graves consecuencias humanitarias. El CDI tiene una capacidad limitada para captar las repercusiones de estas acciones en el desarrollo y no puede cuantificar o comparar de forma significativa los efectos de los distintos conflictos. Por esta razón, Israel y Rusia no están incluidos en el Índice de Compromiso con el Desarrollo de 2025.
Sin embargo, muchos de los efectos indirectos de la invasión rusa -como el aumento de las subvenciones a los combustibles fósiles, el desvío de recursos de ayuda y el incremento de los precios de los alimentos- se reflejan en las puntuaciones de otros países.
Para obtener más información sobre estas cuestiones, puede consultarse la metodología.
Tendencias y perspectivas de desarrollo
El CDI de este año se publica en un contexto de importantes recortes en las prestaciones de ayudas. Esto justifica que los países aumenten la calidad de su financiamiento restante, pero también que consideren el conjunto más amplio de políticas que pueden acelerar la prosperidad y la seguridad en los países socios. En esta sección, destacamos tres áreas importantes: las subvenciones a la agricultura y los combustibles fósiles, el gasto y la orientación de la I+D, y la calidad del financiamiento del desarrollo.
1. Subvenciones a la agricultura y los combustibles fósiles
Los países de altos ingresos gastaron miles de millones del dinero de los contribuyentes en subvencionar la producción y el consumo de combustibles fósiles y, en menor medida, la agricultura. Dada la presión a la que están sometidos los presupuestos públicos y las graves amenazas que plantea el cambio climático, parece importante centrarse en estos ámbitos. Sin embargo, también derivan en una competencia desleal entre países al provocar importantes distorsiones industriales.
Se produjeron retrocesos en las subvenciones a los combustibles fósiles que aumentaron en la mayoría de los países, en gran parte, como respuesta al aumento de la demanda de energía tras la pandemia de COVID y el incremento de precios derivado de la invasión rusa de Ucrania. En los 36 países de los que tenemos datos, las subvenciones totales a los combustibles fósiles ascendieron al 0,48 % de sus INB colectivos en 2022, el doble del 0,23 % del año anterior. Sin embargo, nuestro análisis también muestra variaciones muy amplias en el nivel de subvención proporcionado por los gobiernos.
En respuesta a los problemas de suministro de gas, observamos que la subvención promedio a la producción de gas en todos los países del CDI creció más de tres veces, y aún más en la UE. Las subvenciones al petróleo también aumentaron en más de la mitad de los países, pero en mucha menor medida que las del gas: los mayores aumentos absolutos de las subvenciones al petróleo se registraron en Japón (casi se multiplicaron por 14) y México. El hecho de que las subvenciones al carbón (el combustible fósil más “sucio”) disminuyeran en 23 países (y se mantuvieran en cinco), y que la mayoría de los aumentos de las subvenciones al carbón fueran modestos, puede servir de pequeño consuelo. No obstante, hubo dos excepciones notables: Polonia y China, donde las subvenciones se multiplicaron casi por cuatro y cinco, respectivamente. En conjunto, la intensidad global de carbono de las subvenciones a los combustibles fósiles de los países del CDI fue menor: la intensidad de carbono de todas las subvenciones a los combustibles fósiles en relación con el petróleo era del 95 % en 2021 y de solo el 85 % en 2022.
En particular, la concesión de subvenciones por parte de Estados Unidos es relativamente baja. Si el G20 se centrara en estas subvenciones en los próximos dos años, se podrían liberar fondos públicos, reequilibrar el comercio y acelerar los avances en materia climática.
También se avanzó mucho en la reducción de las subvenciones perjudiciales que contribuyen a la sobrepesca. El histórico Acuerdo de la OMC sobre Subvenciones a la Pesca se adoptó a mediados de 2022 y entró en vigor oficialmente en septiembre de 2025 (ya lo firmaron todos los países del CDI, salvo unos pocos, como India y México). Sin embargo, incluso antes de que este instrumento legal entrara en vigor, vemos que los países del CDI ya habían estado reduciendo las subvenciones perjudiciales a la pesca: entre 2020 y 2022, la subvención promedio otorgada por los países del CDI disminuyó del 7,9 % de la producción de la industria pesquera al 5,3 %.
Figura 1. Las subvenciones a los combustibles fósiles aumentaron en general de 2021 a 2022, pero algunos países las redujeron
2. Investigación y desarrollo
El país promedio del CDI gasta en investigación y desarrollo (I+D) más del doble que en el financiamiento del desarrollo. En conjunto, es casi el triple, un 0,58 % frente al 0,2 % del financiamiento para el desarrollo internacional. Esta cifra también resistió los recortes sufridos por los presupuestos de desarrollo de los países del CDI: hace cuatro años, los fondos destinados a I+D en los países del CDI representaban el 0,59 % de sus economías.
Figura 2. Total de publicaciones en coautoría en 2024 (miles), agrupadas por ingresos medios de los países coautores
El financiamiento de I+D tiene por objeto mejorar las sociedades y la productividad, y estimular la innovación para hacer frente a los retos del momento. Muchas de las recientes conmociones económicas tuvieron un carácter internacional o repercusiones globales: el impacto de la guerra de Rusia en la inflación, el cambio climático, la pandemia de COVID e, incluso, el efecto de los tipos de interés estadounidenses en los costos de los préstamos mundiales. Dadas las dimensiones compartidas e internacionales de tantos de estos retos (actuales y previstos), la I+D debería centrarse en ellos e implicar una colaboración internacional. Los funcionarios y defensores del desarrollo deben comprender y fomentar el enfoque internacional de su gobierno.
En los seis países del BRICS+ evaluados, el gasto público en I+D tiene una magnitud muy superior al destinado al financiamiento del desarrollo internacional. Los investigadores de estos países también son más propensos que los de otros países del CDI a publicar trabajos de investigación en colaboración con investigadores de países de ingresos más bajos (Figura 2). Por ejemplo, mientras que los coautores internacionales promedio de las investigaciones dirigidas por académicos austríacos proceden de un país con un ingreso per cápita de 38 500 dólares, es decir, casi 16 veces la media de los países de ingresos bajos, los académicos de Sudáfrica tienden a asociarse con investigadores de países con ingresos más bajos: 16 900 dólares, es decir, 7 veces la media de los países de ingresos bajos. Para muchos países, colaborar con otros países de bajos ingresos ofrece oportunidades tanto para abordar problemas globales como para fomentar el crecimiento y la innovación mutuos
3. Financiamiento del desarrollo: nuevos proveedores y atención a la calidad
Ya mencionamos que la disminución del financiamiento del desarrollo empezó antes de los grandes recortes anunciados en 2025. ¿Pero qué ocurre con los proveedores que no forman parte de la OCDE?
Nuestro análisis muestra que los proveedores no tradicionales fueron los primeros en recortar su ayuda: en el CDI de 2020, basado en datos de aproximadamente 2017, los 12 proveedores que evaluamos fuera del CAD aportaron el 0,1 % de sus INB colectivos para financiar el desarrollo internacional. En el CDI de 2023, esa cifra había descendido al 0,075 % de los INB, y actualmente se sitúa en el 0,05 %. No se trata de un descenso totalmente homogéneo (Arabia Saudita, por ejemplo, aportó más en la última evaluación que en la de 2020), pero la tendencia se mantiene en líneas generales en todo el grupo. Desde el año 2023, China redujo su financiamiento en casi una cuarta parte en relación con sus INB, Indonesia en más de la mitad, y Sudáfrica en más del 80 %.
Este descenso también se vio impulsado por la caída de la proporción del financiamiento a instituciones multilaterales: Brasil redujo su proporción del 95 al 58 %, y otros, como India, México y Sudáfrica, disminuyeron su financiamiento en más de 20 puntos porcentuales desde nuestro último análisis hace dos años. En parte, esto reflejó la conclusión de la capitalización del Nuevo Banco de Desarrollo. Queda por ver si el grupo BRICS+ con su reciente ampliación hace que esta institución reciba nuevos capitales.
En cuanto a la calidad del financiamiento, nuestra evaluación es una versión simplificada de nuestro Índice de calidad de la AOD (QuODA, por sus siglas en inglés) con solo algunos indicadores. Aun así, observamos varias tendencias claras.
La atención prestada a la pobreza en el financiamiento bilateral del desarrollo sufrió un descenso constante a medida que el financiamiento se aleja de los países más pobres, donde puede tener el mayor impacto. Gran parte de este deterioro se produjo en 2022, cuando se redirigieron volúmenes sustanciales de ayudas a Ucrania (un país con ingresos relativamente más altos). En el año 2018, el nivel medio de ingresos de los beneficiarios del financiamiento de los países del CDI era 1,8 veces superior a la media de los países de ingresos bajos y, en esta edición del CDI, fue 2,2 veces mayor. Bélgica sigue siendo el país que mejor destina su financiamiento bilateral para el desarrollo de los países más pobres, mientras que Estados Unidos y Japón destinaron su financiamiento a países relativamente más prósperos.
Los nuevos datos de la encuesta sobre la opinión de los beneficiarios acerca de los proveedores de ayudas reflejan un aspecto positivo, dado que permiten observar un aumento de la apropiación expresada sobre los proyectos de financiamiento en la mayoría de los países del CDI, es decir, que una mayor proporción de los objetivos de los proyectos de desarrollo se están extrayendo de marcos de resultados que son propiedad del país beneficiario. Tanto el Reino Unido como Estados Unidos reflejan un progreso sustancial, pero los miembros de la UE, incluidos Italia y Alemania, constituyen la mayoría de los países con mejores resultados en este indicador.
Informes nacionales y resultados completos
Para explorar el portal web interactivo y ver cómo el desempeño de su país en el Índice de Compromiso con el Desarrollo, ingrese a cgdev.org/cdi. Para obtener más información sobre el CDI, incluido el modelo de datos completo y el documento metodológico, ingrese a la página web del proyecto: cgdev.org/project/commitment-development-index.
Acerca del CDI
El Centro para el Desarrollo Global (CGD, por sus siglas en inglés) elabora el Índice de Compromiso con el Desarrollo desde el año 2003. El CGD trabaja para reducir la pobreza en el mundo y mejorar la calidad de vida a través de una investigación económica innovadora que impulse mejores políticas y prácticas por parte de los principales responsables de la toma de decisiones a nivel mundial. Ian Mitchell es el director del CDI y Edward Wickstead es el investigador principal. El CDI de 2025 se basa en el trabajo realizado en ediciones anteriores por Beata Cichocka, Lee Robinson, Anita Käppeli, Owen Barder, David Roodman y Nancy Birdsall. Para el CDI, se utilizaron fondos destinados al trabajo del CGD Europa sobre la eficacia del desarrollo que incluyeron contribuciones de varios gobiernos, como los de Australia, Canadá, Alemania, Luxemburgo y Suecia. El CDI no refleja la opinión oficial de quienes lo financian. Los autores son responsables de todas las decisiones metodológicas y de la información y las opiniones aquí expresadas.
Topics
CITATION
Mitchell, Ian, and Edward Wickstead. 2025. Commitment to Development Index 2025. Center for Global Development.DISCLAIMER & PERMISSIONS
CGD's publications reflect the views of the authors, drawing on prior research and experience in their areas of expertise. CGD is a nonpartisan, independent organization and does not take institutional positions. You may use and disseminate CGD's publications under these conditions.